A new study of Brazilian concrete strength conformance
Um novo estudo da conformidade da resistência do
concreto produzido no Brasil
Abstract
Resumo
This paper presents a new evaluation of the strength compliance of concretes produced in Brazil. It is based on experimental results of over twen-ty-seven thousand concrete samples from diferent parts of the country. Results show that a signiicant part of Brazilian concrete do not reach the characteristic strength (fck) speciied in design, and the percentage of nonconforming samples tend to be higher than 5%. This study also reveals the concrete produced in the South and Midwest regions have less variability than the ones produced in the other regions of the country. These results emphasize the importance of a rigorous control in manufacturing and reception of concretes in order to reduce the nonconforming cases.
Keywords: concrete strength compliance, concrete structures, structural safety.
Este artigo apresenta uma nova avaliação da conformidade dos concretos atualmente produzidos no Brasil. Ela está pautada em resultados de ensaios de resistência à compressão axial de mais de vinte e sete mil corpos de prova de concretos moldados in loco, no ato de seu recebimento, em diferentes obras do país. Os resultados mostram que parte do concreto produzido no Brasil não alcança a resistência característica (fck) pre-vista em projeto, e que o percentual de amostras não conformes tende a ser superior a 5%. Este estudo também evidencia que os concretos pro -duzidos nas regiões Sul e Centro-Oeste apresentam menor variabilidade que aqueles pro-duzidos nas demais regiões do país. Estes resultados reforçam a importância de um controle rigoroso na fabricação e no recebimento do concreto visando diminuir a ocorrência de não conformidades.
Palavras-chave: conformidade da resistência do concreto, estruturas de concreto, segurança das estruturas.
a Colegiado de Engenharia Civil, Universidade Federal do Vale do São Francisco, Juazeiro, BA, Brasil; b Departamento de Engenharia de Estruturas, Escola de Engenharia de São Carlos, São Carlos, SP, Brasil.
Received: 23 Sep 2016 • Accepted: 13 Feb 2017 • Available Online: 27 Jul 2017
W. C. SANTIAGO a b
A. T. BECK b
1. Introduction
This article presents an investigation about the strength compli-ance of concretes manufactured in diferent states from the ive geographic regions of Brazil. It is based on results from axial com-pression strength tests at 28 days of age performed in more than 27 thousand cylindrical specimens of concrete molded in loco. This study divides the data into 4 classes – C20, C30, C40 and C50 – in order to evaluate the conformance of the concrete as a function of its characteristic strength. The analysis are performed both at regional and national levels. As part of this work, compari-sons are made between these results and the results shared by Santiago and Beck ive years ago [1].
It is important to emphasize the entire study is based on current national normalization, specially the codes for compression test of concrete cylindrical specimens [2], preparation, control and ac -ceptance of concrete [3] and the design of concrete structures [4]. This work is part of a larger project about the calibration, based on structural reliability, of the partial factors from Brazilian design codes. The calibration is being developed by the authors of this paper, though it has already been addressed in a preliminary way by Beck and Doria [5], Beck et al. [6], Chaves et al. [7] and Beck and Souza Jr. [8].
2. Compressive strength of concrete
The compressive strength of concrete is random by nature, its vari-ability is a result from the constituent materials, test procedures, production and operation equipments. The necessary measures to reduce variability involves the quality control of each one of the variables and the more eicient it is, the more homogeneous is the concrete produced [9].
The concrete production involves its dosage which is the process used to obtain the best proportion between cement, aggregates, water, additives and addition in order to meet certain speciica -tions [10]. Concrete’s preparation, control and acceptance code [3] establish three preparation conditions: condition A (applied to all classes), condition B (applied to classes C10 and C20) and condi-tion C (applied to classes C10 and C15).
Once produced, the concrete is submitted to a quality control that test the cylindrical specimens at 28 days, in order to verify its com-pressive strength. Concrete’s preparation, control and acceptance code [3] allows the control to be by total or partial sampling. In
the control by total sampling two specimens are molded for each concrete batch, while in the control by partial sampling at least six specimens are molded for each 50 or 100 m3 of concrete used on the structure.
At the end of the quality control, a batch is considered conform when the estimate value of its characteristic strength (fckest), re-ferred to a (known) sampling of a (unknown) population, satisies the relation presented in Eq. (1). It is worth mentioning the char-acteristic strength (fck) of the concrete is a reference value, which have to be reach by at least 95% of the specimens tested.
(1)
Although the compressive strength test in specimens is an evidence of quality of the concrete, its result is restricted to indicate a potential strength of the population based on sampling. Accordingly, a con-crete is considered conform when less than 5% of its samples pres -ent a compressive strength value below the predicted one.
The issue of the conformity of structural concretes produced in Brazil has been the object of several studies, but it still needs to be further developed. Among the studies carried out, stand out Magal-hães et al [11], Santiago and Beck [1], Silva Filho and Helene [12], Castro [13], Borges [14] and Vieira Filho [15].
Some studies also indicate the dosing plants are centralizing the dosage strength in the characteristic strength and not in the average strength [1, 16]; which is probably the main reason for the frequent oc -currences of nonconforming concrete in Brazilian construction sites. In this scenario, this study present a statistic description that repre-sents the set of concrete produced in Brazil, given the analysis are performed from samples collected and tested in the same condi-tions established by a code applied throughout the country.
3. Origin and database classiication
The present work is subsidized with information about the com-pressive strength at 28 days of over 27 thousand cylindrical speci-mens – 10 cm diameter and 20 cm height – of concretes molded
in loco in constructions sites from the ive Brazilian geographical
regions – Midwest (CO), South (S), Southeast (SE), North (N) and Northeast (NE) – referring to the 15 federative units. Table 1 shows a quantiication of the specimens according to the diferent regions. In accordance with the concrete’s preparation, control and accep -tance code [3], the concrete studied were produced with condi -tion A of prepara-tion between 2011 and 2016 at authorized dosing plants, and certiied technological-control companies controlled it by total sampling.
Table 1
Quantification of the specimens by Brazilian regions
Region Quantity Percentage
CO 4857 17
S 2222 8
SE 16612 60
N 300 14
NE 3814 1
Total 27805 100
Table 2
Quantification of the specimens by strength class
Class Quantity Percentage
C20 3866 14
C30 6685 24
C40 3982 14
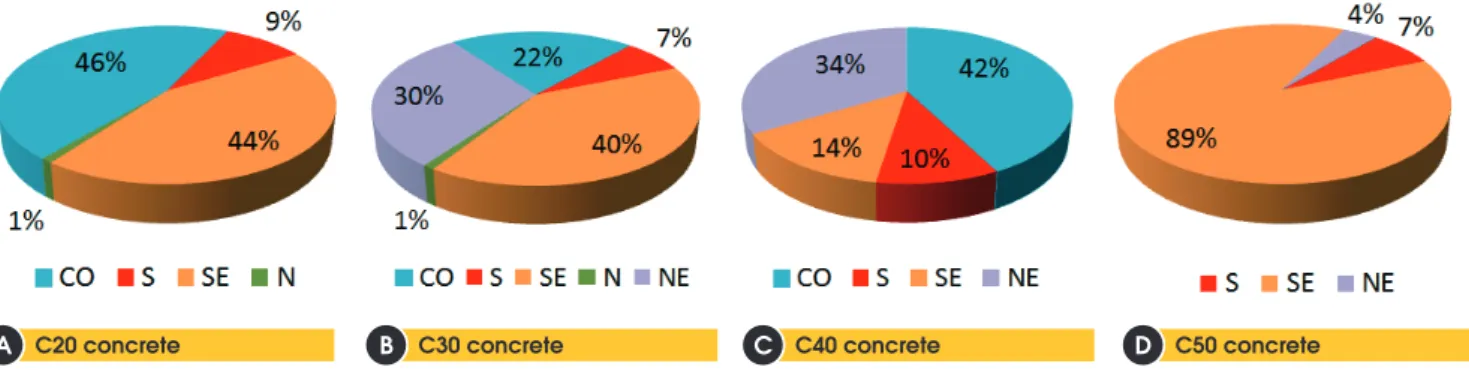
In order to evaluate the behavior of the concrete in relation to its characteristic strength, the data were classiied into 4 classes – C20, C30, C40 and C50 – according to the information available in the technological control reports. Table 2 presents a brief quantiication of the tested specimens according to the evaluated strength classes. Figure 1 shows the percentage distribution of the data according to the geographical regions of the country for each one of the four strength classes of concrete studied in this work. The results ex-pressed in the graphics have a strong relation with the strength classes usually used in each region.
In addition, the data used were obtained from the following com-panies, educational institutes and laboratories: AJL Engenharia,
Centro de Tecnologia da UFAL, CONSULTARE Laboratório, CSP Projetos e Consultoria, EGELTE Engenharia, ITAPIPU BINACIO-NAL, Laboratório de Ensaios de Materiais da FACENS, MPA Con-trole Tecnológico, SENAI-DF, SILCO Engenharia, TECNOL Tec-nologia em Concreto, TECNOCON Engenharia e VENTUSCORE Soluções em Concreto.
4. Database treatment
The randomness nature of concrete strength requires a statistical approach for the problem. Thus, based on the samples, average strength (fcm), estimated characteristic strength (fckest), standard
de-Figure 1
Percentage of sampling data according to the brazilian regions
C20 concrete C30 concrete C40 concrete C50 concrete
B B B B
A B C D
Figure 2
Box-and-whiskers representation for the samples according to the regions
C20 concreteB
A BB C30 concrete
C40 concrete
B
viation (�), variation coeicient (Cve) and the probability distribu -tion curve were determined.
If n is the total number of samples and fi each one of the values (i = 1, 2, 3, …, n), the average strength (fcm) was calculated through the sum of all samples divided by the total number as it is shown in Eq. 2. From the increasing order of the samples (f1 < f2 < f3 < … < fn) it was possible to estimate the characteristic strength (fckest) based on the result corresponding to 5% percen -tile, see Eq. 3.
(2)
(3)
The standard deviation (�), which represents the regularity and dispersion of the results in relation to the mean, was found from the square root of the sample variance, as it is shown in Eq. 4. The variation coeicient was calculated through the ration between the standard deviation and the mean, see Eq.5.
(4)
(5)
Results from widely known international works [17, 18] indicate that
normal distribution is the one that best its the description of con -crete behavior, which was proven after successive its using Easyit software. It should be mentioned that in the existence of an eicient control, the strength values are grouped close to the mean and the distribution curve is high and narrow; on the opposite scenario, the strength values spread out and the curve becomes low and wide. As the objective of this study was to obtain statistical descriptions that represent the sets of concrete produced in the country, the data from diferent construction sites were grouped and analyzed in blocks. Therefore, the national statistics were obtained from regional statistical weights, which were applied according to the number of samples available for each class in each region of the country. Eq. 6 shows the expression used in the weighting calculations.
(6)
It is worth mentioning this works also involved a previous statistical analysis of the samples in order to eliminate data that does not be-long to the group (outliners). Figure 2 shows box-and-whiskers rep-resentations for the strength class samples studied in order to high-light the lower and upper barriers used to exclude spurious results.
5. National results
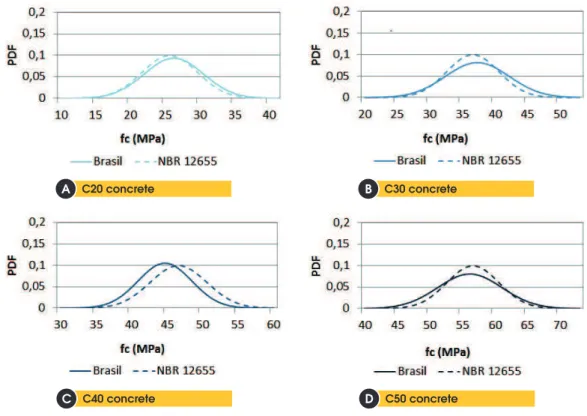
Figure 3 shows the probability distribution curves obtained from axial compression tests on cylindrical specimens of concrete molded at re-cipient and tested at 28 days, as well as the probability distribution
Figure 3
Comparison between the distribution function of concrete produced in Brazil and the ones foreseen
in NBR 12655
C20 concrete
B
A BB C30 concrete
C40 concrete
B
curves of the same concrete if it was to attend condition A of prepara-tion as established in concrete’s preparaprepara-tion, control and acceptance code [3]. It should be mentioned the results from each studied classes came from the same population, which they propose to represent. Concrete from classes C20 and C30 presents mean strength (fcm) and standard deviation (�) values higher than the ones predicted in the control and recipient norm [3]. Concrete from classes C40 and C50, on the other hand, presents mean strength (fcm) value lower than the predicted value in the same norm.
Results obtained in terms of estimated characteristic strength (f
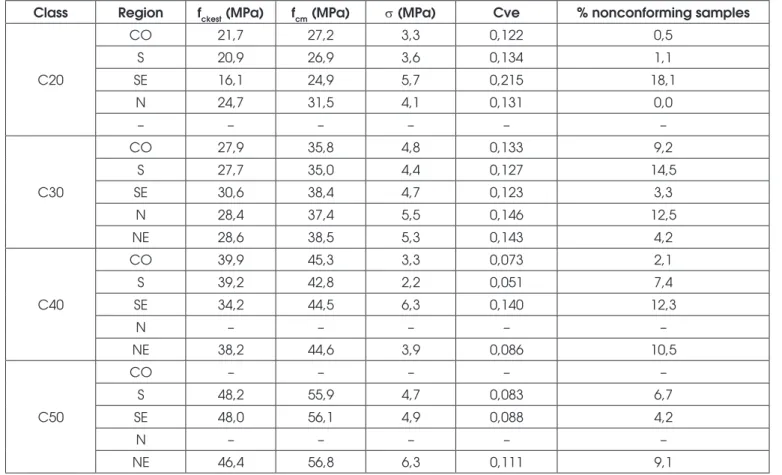
ck-est), mean strength (fcm), standard deviation (�), variation coeicient (Cve) and percentage of nonconforming concrete samples pro-duced in Brazil are shown in Table 3. Results show that the esti-mated characteristic strength is lower than the speciied character -istic strength (fckest < fck) and that the percentage of nonconforming samples tends to be higher than the 5% stated in the norm.
Table 3
Results of the concrete produced in Brazil
Class fckest (MPa) fcm (MPa) s (MPa) Cve % nonconforming
samples
C20 19,2 26,2 4,3 0,164 8,3
C30 29,2 37,3 4,9 0,131 5,7
C40 38,5 44,7 3,8 0,084 6,9
C50 48,0 56,1 4,9 0,088 4,5
Figure 4
Summary of the results of the concretes produced
in Brazil
Figure 5
Comparison between the distribution functions of concrete produced in the different regions of the country
C20 concreteB
A BB C30 concrete
C40 concrete
B
For each strength class of concrete, Figure 4 shows the ration variation between the mean strength and the speciied charac -teristic strength (fcm/fck), the ration between the estimated char-acteristic strength and the speciied charchar-acteristic strength (fckest/ fck) and the variation coeicient (Cve). In this Figure is possible to observe the ration between the mean strength and the speci-ied characteristic strength (fcm/fck) and the variation coeicient (Cve) tend to decrease with increasing strength, while the ration between the estimated characteristic strength and the speciied characteristic strength (fckest/fck) tends to remain constant.
6. Regional results
Figure 5 presents the probability distribution curves obtained for concretes produced in diferent geographic regions of the country. It’s evident that the concrete produced in diferent loca -tions not always present similar behavior. Concrete produced in the South and Center-West regions, for example, tend to pres-ent less variability than those produced in the Southeast and Northeast regions.
Table 4 illustrate the results obtained in terms of estimated char-acteristic strength (fckest), mean strength (fcm), standard deviation (�), variation coeicient (Cve) and percentage of nonconforming samples produced in the diferent regions of the country. Despite the dispersion of the results, it is evident that in most cases, the
estimated characteristic strength tends to be lower than the spec-iied characteristic strength (fckest < fck) and that the percentage of nonconforming samples tends to be higher than 5%.
Figure 6 indicates the variation of the ration between the mean strength and the speciied characteristic strength (fcm/fck), the variation of the ration between the estimates characteristic strength and the speciied characteristic strength (fckest/fck) and the variation coeicient (Cve) for each strength class of concrete and geographic region of the country. This igures shows that, despite the relative dispersion of the results, it is possible to observe a declining trend of the ration between the mean strength and the speciied characteristic strength (fcm/fck)) and of the variation coef-icient (Cve) with increasing strength.
7. Comparison with previous results
Figure 7 presents the probability distribution curves based on da-tabase from this study (2016), as well as the probability distribution curves based on database from Santiago and Beck [1] (2011). This igure let clear that in the interval of ive years the concrete pro -duced in Brazil presented an increase of mean strength, although the variability also increased. At irst, this result is an indication that the dosing plants have centered the dosage of concrete on the mean strength and not in the characteristic strength anymore, as pointed out in previous works [1, 16].
Table 4
Summary of the concretes produced in the different regions of Brazil
Class Region fckest (MPa) fcm (MPa) s (MPa) Cve % nonconforming samples
C20
CO 21,7 27,2 3,3 0,122 0,5 S 20,9 26,9 3,6 0,134 1,1 SE 16,1 24,9 5,7 0,215 18,1
N 24,7 31,5 4,1 0,131 0,0
– – – – – –
C30
CO 27,9 35,8 4,8 0,133 9,2 S 27,7 35,0 4,4 0,127 14,5 SE 30,6 38,4 4,7 0,123 3,3
N 28,4 37,4 5,5 0,146 12,5 NE 28,6 38,5 5,3 0,143 4,2
C40
CO 39,9 45,3 3,3 0,073 2,1 S 39,2 42,8 2,2 0,051 7,4 SE 34,2 44,5 6,3 0,140 12,3
N – – – – –
NE 38,2 44,6 3,9 0,086 10,5
C50
CO – – – – –
S 48,2 55,9 4,7 0,083 6,7 SE 48,0 56,1 4,9 0,088 4,2
N – – – – –
Figure 6
Summary of the results of concrete produced in the different regions of the country
f /fcm ckB
A BB fckest/fck
Cve
B
C
Figure 7
Comparison between the distribution functions of the concrete produced in Brazil until 2011 and 2016
C20 concreteB
A BB C30 concrete
C40 concrete
B
Table 5 present results obtained in terms of estimated character-istic strength (fckest), mean strength (fcm), standard deviation (�), variation coeicient (Cve) and percentage nonconforming concrete samples from Brazil until 2011 and 2016. The results show that, in general, there has been an increase of strength and a decrease in the percentage of nonconforming samples.
For each strength class, the Figure 8 indicates the variation of the ration between the mean strength and the speciied characteristic strength (fcm/fck), the variation of the ration between the estimates characteristic strength and the speciied characteristic strength (f
ck-est/fck) and the variation coeicient (Cve) according to the concrete produced until 2011 and 2016. It is possible to notice that the ra-tion between the estimated characteristic strength and the speci-ied characteristic strength (fckest/fck) tends to be constant only for concrete that belonged to the current database (2016).
8. Conclusions
This paper presented a study of concrete strength conformance from four distinct classes – C20, C30, C40 and C50 – produced in Brazil. This study was accomplished using a database of over twenty-seven thousand cylindrical specimens molded in loco and tested at 28 days with instantaneous and monotonic load. The concrete from classes C20 and C30 presented mean strength
(fcm) values higher than the ones predicted in the concrete’s prepa -ration, control and acceptance code [3], while the concrete from classes C40 and C50 presented mean strength values lower than the ones predicted on this same code. For all the evaluated class-es, the estimated characteristic strength tended to be lower than the correspondent characteristic strength (fckest < fck), as well as the percentage of nonconforming samples and the standard deviation (�) values tend to be higher than the ones stipulated.
In relation to the regionalized results, concretes produced in the South and Center-West regions presented the lower variability than the ones produced in the Southeast and Northeast region. However, the percentage of nonconforming samples tended to be higher than 5% in all the regions.
In both national and regional results, it was possible to observe that the ration between the mean strength and the speciied char -acteristic strength (fcm/fck) and the variation coeicient (Cve) tended to decrease with increasing strength, while the ration between the estimates characteristic strength and the speciied characteristic strength (fckest/fck) tended to be constant.
Although the results indicate that the concrete currently produced in the country present a slightly lower quality than the one pre-dicted in the concrete’s preparation, control and acceptance code [3], it is notable that along the last ive years the material presented a substantial improvement in its behavior, considering the results published by Santiago and Beck [1].
The authors of this work are involved in a bigger project that aims the calibration, based on structural reliability, of the partial factors from Brazilian design codes. Therefore, this study of strength con-formance of the concrete produced in the country is fundamental to achieve the inal goal.
9. Acknowledgments
The authors are grateful to CNPq for the founding, as well as the professionals who provided the necessary data for the accomplish-ment of this work: Aline Heloá de Souza, André Moraes, Antônio Nereu Cavalcanti Filho, Cesar Pinto, Dagoberto Façanha, De-olinda de Oliveira Alves, Egydio Herve Neto, Fábio Luiz Willirich, Gezeli Bandeira de Mello, Girley da Silva Vespaziano, João Marce-lo Linhares Feijão, Jônatas Moraes, Karoline A. MeMarce-lo Moraes, Luis Guilhermo Vellacich, Luiz Felipe Ferrira Mello, Luiz Paulo Prigol,
Table 5
Results of the concretes produced in Brazil until 2011 and 2016
Class Year fckest (MPa) fcm (MPa) s (MPa) Cve % nonconforming samples
C20 2016 19,2 26,2 4,3 0,164 8,3 2011 23,0 23,7 1,8 0,071 1,0 C30 2016 29,2 37,3 4,9 0,131 5,7 2011 27,9 28,0 3,6 0,105 9,0 C40 2016 38,5 44,7 3,8 0,084 6,9 2011 35,9 33,6 3,6 0,090 30,0 C50 2016 48,0 56,1 4,9 0,088 4,5
2011 42,4 41,1 2,9 0,062 84,0
Figure 8
Marcos Aurélio Vianna de Escobar, Rafael Akira Akisue, Renato Trindade, Valdinei Jacques Alves and Vinícios Wagner Oliveira.
10. References
[1] SANTIAGO, W.C.; BECK, A.T. Estudo da (Não-)Conformi -dade de Concretos Produzidos no Brasil e sua Inluência na Coniabilidade de Pilares Curtos. Revista IBRACON de Estruturas e Materiais, v.4, p.663 - 690, 2011.
[2] ASSOCIAÇÃO BRASILEIRA DE NORMAS TÉCNICAS. Concreto - Ensaios de compressão de corpos-de-prova cilíndricos. - NBR 5739, Rio de Janeiro, 2007.
[3] ASSOCIAÇÃO BRASILEIRA DE NORMAS TÉCNICAS. Concreto de cimento Portland - Preparo, controle, recebi-mento e aceitação - Procedirecebi-mento. - NBR 12655, Rio de Janeiro, 2015.
corpos-de-prova cilíndricos. - NBR 5739, Rio de Janeiro, 2007.
[4] ASSOCIAÇÃO BRASILEIRA DE NORMAS TÉCNICAS. Projeto de estruturas de concreto — Procedimento. - NBR 6118, Rio de Janeiro, 2014.
[5] BECK, A.T.; DÓRIA A.S. Reliability analysis of I-section stell columns designed according to new Brazilian building codes. J, of the Braz. Soc of Mech. Sci & Eng. 30, 152-160, 2008. [6] BECK, A.T.; DE OLIVEIRA, W.L.A.; DE NARDUM, S.; EL
-DEBS, A.L.H. Reliability-based evaluation of design code provisions for circular concrete-illed steel columns. Engi -neer Ing Structures, Elsevier, v.31, p.2299-2308, 2009. [7] CHAVES, I.A.; BECK, A.T.; MALITE, M. Reliability-based
evaluation of design guidelines for cold-formed steel I-con-crete composite beams. J, of the Braz. Soc of Mech. Sci & Eng. v.32, p.442-449, 2010.
[8] BECK, A.T.; SOUZA JR, A.C. A irst attempt towards reliabil -ity-based calibration of Brazilian structural design codes. J, of the Braz. Soc of Mech. Sci & Eng. v.32, p.119-127, 2010. [9] PORRERO, K. Evaluación de los ensayos de resistencia del
concreto. Boletín INME - Instituto de Materiales y Modelos Estructurales da Facultar de Ingenieria da Universidade Central de Venezuela, vol. 21, No. 72/73, p. 165-207, 1983. [10] MEHTA, P. K.; MONTEIRO, P.J.M. Concreto: estrutura, pro
-priedades e materiais. Editora Pini. São Paulo, 2008. [11] MAGALHÃES, Fábio Costa; DE VASCONCELLOS REAL,
Mauro; DA SILVA FILHO, Luiz Carlos Pinto. The problem of non-compliant concrete and its inluence on the reliability of reinforced concrete columns. Materials and Structures, v. 49, n. 4, p. 1485-1497, 2016.
[12] SILVA FILHO, L. C. P.; HELENE, P. Análise de estruturas de concreto com problemas de resistência e dissuração. In: ISAIA, G. C. (Editor), Concreto: Ciência e Tecnologia. IBRACON, São Paulo, 2011.
[13] CASTRO, E de. Estudo da resistência à compressão por meio de pequeno diâmetro e esclerometria. Dissertação de Mestrado. PPGEC/UFU. Uberlânida-MG, 2009.
[14] BORGES, M. L. Avaliação da qualidade de concreto produ -zidos em centrais dosadoras, misturados em caminhão be-toneira e de concreto produzidos em centrais misturadoras. Dissertação de Mestrado. UFG. Goiânica-GO, 2009.
[15] VIEIRA FILHO, J. O. Avaliação da resistência à compressão do concreto através de testemunhos exterídos: contribuição à estimativa do coeiciente de correlão devido aos efeitos de broqueamento. Tese , USP - Universidade de São Paulo. São Paulo-SP, 2007.
[16] FARIA, R., 2009: Concreto não conforme, Revista Téchne, Edição 152, novembro 2009. Disponível em: <http://www. revistatechne.com.br/engenharia-civil/152/artigo156894-1. asp?o=r>. Acesso em: 16 janeiro 2016.
[17] ELLINGWOOD, B; GALAMBOS, T.V. Probability-based cri -teria for structural design. Structural Safety 1, p.15-26, 1982. [18] NOWAK, A.S; SZERSZEN, M.M. Calibration of design code