• Nenhum resultado encontrado

Mat. Res. vol.7 número2

N/A
N/A
Protected

Academic year: 2018

Share "Mat. Res. vol.7 número2"

Copied!
10
0
0

Texto

(1)

*e-mail: gmugica@ing.unlp.edu.ar

Effect of Porosity on the Tensile Properties

of Low Ductility Aluminum Alloys

Gustavo Waldemar Mugicaa*, Daniel Oscar Tovioa, Julio César Cuyasa, Aulio César Gonzálezb

aLaboratorio de Investigaciones en Metalurgia Física, Facultad de Ingeniería

Universidad Nacional de La Plata, Calle 48 esq. 116 (1900) La Plata, Argentina

bFacultad de Ingeniería, Universidad Nacional de la Plata. Consejo Nacional de

Investigaciones Científicas Técnicas, Calle 48 esq. 116 (1900). La Plata, Argentina

Received: May 27, 2002; Revised: November 10, 2003

The literature contains reports of several studies correlating the porosity and mechanical proper-ties of aluminum alloys. Most of these studies determine this correlation based on the parameter of global volumetric porosity. These reports, however, fail to separate the effects of microstructural features and porosity on alloys, though recognizing the influence of the latter on their mechanical properties. Thus, when the decrease in tensile strength due to the porosity effect is taken into ac-count, the findings are highly contradictory. An analysis was made of the correlation between me-chanical properties and global volumetric porosity and volumetric porosity in the fracture, as well as of the β-Al5FeSi phase present in 380 aluminum alloy. Our findings indicate that mechanical

proper-ties in tension relating to global volumetric porosity lead to overestimations of the porosity effect in detriment to the mechanical properties. Moreover, the proposed models that take into account the effects of particles, both Si and β-Al5FeSi, are unapplicable to low ductility alloys.

Keywords: aluminum, foundry, porosity, mechanical properties

1. Introduction

Several studies in the literature correlate the porosity and mechanical properties of cast aluminum alloys1-5 and

most of these studies use the parameter of global volumet-ric porosity to determine this correlation.

Apart from the porosity effect, the mechanical proper-ties of these alloys generally result from a set of variables such as chemical composition6,7, morphology and size of

eutectic silicium8, type and shape of intermetallic particles

of iron9,10, particularly β-Al

5FeSi phase, and dendritic cell

size. Thus, when the decrease in tensile strength due to the effect of porosity is taken into account, the results are highly inconsistent11.

Among the reports analyzed in ref. 11 by the authors, the aforementioned effects of the microstructural proper-ties were not separated from the effect of porosity, although the influence of the former on the mechanical properties is recognized. This leads to very different results, as can be seen in Table 1. The ∆UTS listed in this table indicate the

deterioration of tensile strength caused by the effect of po-rosity in 356 aluminum alloy, according to Radhakrisna2

and Pan12. Similar results were found for elongation in

ref. 11, by the same authors, and for alloy, indicated in Ta-ble 1, and by two other authors for 319 aluminum alloy.

Some authors5,6 state that, when the mechanical

proper-ties and global volumetric porosity are correlated, the dis-persion value decreases if the porosity is measured in the fracture plane.

(2)

Of all the bibliography reviewed here, only Eady and Smith12, who worked with 356 aluminum alloy, considered

conditions similar to the abovementioned ones. To reach these conditions, we used the same type of mold (dimen-sions and materials), the same temperature and the same cast procedure, which resulted in the same thermal cycle for all the material used to manufacture our pieces. The degassing grade was modified to obtain different values of porosity.

The correlation between mechanical properties, global volumetric porosity and volumetric porosity in the fracture was analyzed, as was the presence of β-Al5FeSi phase.

In this paper, the expressions “global volumetric poros-ity” and “volumetric porosity in the fracture” are used to distinguish the porosity measurements taken from the whole tension tested piece, and the porosity determined from small specimens of material close to the fracture.

2. Experimental Procedure

The two 380 aluminum alloy compositions used in this study are listed in Table 2, together with the standard com-position given by the Aluminum Association (AA).

Mechanical properties such as tensile strength, yield strength, and elongation were studied. To this end, plates of each composition, alloy 1 and alloy 2 (see Table 2), were obtained without adding eutectic modifiers or grain refin-ers. These were cast in sand molds, using a cast pouring temperature of 750 ± 5 °C in each case.

Figure 1 shows a diagram of the plate and its correspond-ing measurements. To obtain a laminar flow of the liquid during casting, the mold was placed at an angle of about 50° in relation to the horizontal position and raised to a

ver-tical position during pouring. The different grades of po-rosity were obtained by means of different degassing times, using two gases: N2 99.99% and N2 99.00%, injected with a static graphite nozzle with a porous plug13.

Each sample’s global volumetric porosity and volumet-ric porosity in the fracture were obtained by means of a

Table 1. Detrimental effect on tensile strength obtained by Pan and Radhakrishna’s equation for 356 aluminum alloy.

Porosity% ∆UTS (MPa)

Radhakrishna Pan

1 -69.9 -20.2

2 -124.0 -40.4

3 -162.3 60.6

4 -184.8 -80.8

Table 2. Chemical compositions of 380 aluminum alloys.

Composition (% in weight)

Si Fe Mg Mn Cu Zn Ni Sn

A.A. standard 7.5-9.5 2.0 0.10 0.50 3.0-4.0 3.0 0.50 0.35

Alloy 1 8.21 0.75 0.01 0.32 3.47 1.38 0.02 0.02

Alloy 2 9.17 0.99 0.02 0.30 3.12 0.78 0.02 0.02

(3)

differential weighing technique in air and water and were compared with a standard sample cast in a large mass per-manent Cu mold.

To determine the global volumetric porosity, 18 × 18 × 120 mm bars were cut perpendicularly to the long-est axis of the plate and at different distances from the cold end (Fig. 1). Specimens were taken from these bars for ten-sile tests, which were performed in an Instron machine with 5.000 kg maximum load and a head displacement speed of 1 mm/min. The size of the test specimens corresponded to the ASTM A370 standard for 8.75 mm diameter test speci-mens.

The cooling rate was measured at various distances from the cold end. For this purpose, highly sensitive K-type ther-mocouples were used in the central area of the plate, as il-lustrated in Fig. 1. Data were recorded using an data acqui-sition device connected to a computer. The cooling rate was

calculated in the portion of the curve between the liquidus and eutectic Al-Si temperatures.

Metallographic samples were taken in the central area of the plates and the dendritic cell sizes were measured us-ing an image analysis system.

3. Results

3.1. Cooling rate and dendritic cell size:

The interdendritic space, which is dependent on the cool-ing rate, can usually be expressed by the followcool-ing equation14:

DAS = a . ε -m

where aandm are constants which vary with the alloy com-position, and ε is the cooling rate.

The cooling curves depicted in Fig. 2 were taken at 43, 223 and 398 mm from the cold end of the plate. The

calcu-Figure 2. Cooling curves for different distances from the of cold end: 1) 23 mm; 2) 223 mm; 3) 398 mm.

Figure 3. Correlation between cooling rate and distance from the cold end.

Table 3. Grain and dendritic cell sizes of the two compositions at different distances from the plate’s cold end.

Alloy 1 Alloy 2

Distance from D.E.*(mm) Dendritic Distance from D.E.*(mm) Dendritic

Extreme Cold (mm) Cell Size (µm) Extreme Cold (mm) Cell Size (µm)

10 4.8 34.4 5 4.8

-30 5.3 35.3 45 4.6 29.95

60 4.7 33.0 75 4.7 29.86

95 5.0 32.4 115 4.6 29.11

130 4.7 36.3 150 4.5 27.70

170 5.2 32.7 185 4.7 28.79

200 5.2 35.5 220 4.8 28.55

230 - 36.2 255 4.8 25.76

270 5.2 37.0 290 4.8 28.42

300 5.1 34.4 325 4.7 27.62

340 4.9 36.7 380 4.5 26.74

360 5.1 34.0 390 4.8 30.21

395 4.4 49.1 395 - 30.12

(4)

lated cooling rates are represented in Fig. 3 as a function of their distance from the plate’s cold end.

Table 3 gives the results of the dendritic cell size meas-ured at different distances from the cold end of the plate. The measurements are the result of the average of at least 300 calculations carried out in at least 15 different fields in each sample.

The results obtained here indicate that the cell size meas-ured at different distances from the cold end were

practi-cally identical, except for the sample taken near the hot end, where the cell size may be significantly larger than in the rest of the plate. This material was excluded from all the plates.

The metallographic image in Fig. 4 indicates how the measurements listed in Table 3 were taken.

3.2. Volumetric porosity and mechanical properties:

Figure 5 shows the behavior of tensile strength, yield strength and elongation versus global volumetric porosity. Figure 6a shows the behavior of tensile strength, yield strength and elongation versus the volumetric porosity in the fracture.

Figure 6b illustrates the tensile strength, corrected by porosity according to the “effective diameter” criterion pro-posed by Surappa et. al.5

The shape factor 1.5 was used here for the pores, which corresponded to the average value for the pores making up 85% of the total area of porosity.

This figure also shows the yield strength corrected by the area lost due to the porosity in each test specimen close to the fracture.

3.3. β-Al5FeSi phase:

The β-Al5FeSi phase content in the two compositions was significantly different because of the iron content in each alloy. The micrographs in Fig. 7a and 7b, below, cor-roborate this statement.

Figure 5. Tensile strength, yield strength and elongation rate as a function of volumetric porosity for the two alloys.

(5)

Figure 6. a)Tensile strength, yield strength and elongation rate as a function of the volumetric porosity near the fracture surface of the two alloys; b)Tensile strength and yield strength as a function of the volumetric porosity near the fracture surface of the two alloys. Rm is the tensile strength corrected by a factor of 1.5. Ry is the yield strength corrected by the area of pores.

(6)

3.4. Fracture of particles:

Figure 8a and 8b show the shape of the β-Al5FeSi phase and Si particle fractures. The metallographic image indi-cates the direction of the applied load.

Figure 8c reveals broken particles next to the fracture, while Fig. 8d and 8e show the effect of isolated pores on the particles.

4. Discussion

It is widely accepted that the mechanical properties of aluminum casting alloys depend on microstructural charac-teristics such as the dendritic cell size, grain size, silicon size in the eutectic Al-Si, and the size and morphology of the β-Al5FeSi phase, as well as on the pores and inclusions. The available literature considers these factors simultane-ously, which prevents the reader from clearly distinguish-ing their individual effects.

The experiments performed in the present work were carried out on a selected range of thermal parameters so as to obtain similar microstructures. Table 3 lists the dendritic cell sizes of the alloys involved in this study. In the case of alloy 1, the average dendritic cell size was 34.8 µm, while alloy 2 showed smaller cells with an average size of 28.57 µm.

Dendritic cell size exerts a similar effect on the mechani-cal properties of 380 and 356 aluminum alloys, according to Spear and Gardner15, and the increase in dendritic cell

size from 28.6 µm to 34.8 µm may have affected the tensile strength by up to 3% without affecting the yield strength. The conditions used by Spear and Gardner were such that an increase in dendritic cell size was accompanied by an increase in porosity. Therefore, it is reasonable to suppose

that the actual effect of larger dendritic cell size on the me-chanical properties, within the size range considered, was appreciably lower.

The average grain size, in equivalent diameter, was 4.97 mm in alloy 1 and 4.7 in alloy 2.

Figure 5 shows the behavior of the tensile strength, yield strength and elongation versus the global volumetric poros-ity for the two alloys. As can be seen, both tensile strength and elongation decreased with increasing porosity.

Alloy 2 displayed a higher tensile strength with every porosity value, a behavior attributable to the smaller size of the dendritic cells15, smaller grain size and higher Mg and

Fe content.

It should be noted that the Si content in alloy 2 was higher than in alloy 1, and that it increased by 0.96%. The Si form-ing the eutectic was about 0.84%, since the Fe content in-creased by 0.24% and combined with Si to form β-Al5FeSi phase. The Fe content in alloy 2 and the cooling rate ap-plied caused the Fe to combine with the Si almost com-pletely, forming the β-Al5FeSi phase16.

The elongation results in Fig. 5 indicate that alloy 2, with a higher Si and Fe content, was less affected by every level of porosity. The mechanical properties of these alloys had so far been analyzed only in relation to global volumet-ric porosity. However, Fig. 9 shows that the pore distribu-tion in the material analyzed here tended to increase towards the center of the plate center, following the orientation of solidification. Hence, it can be assumed that the highest values of volumetric porosity will be found in the central region of the tensile tested specimen, where the occurrence of a fracture is highly probable.

The dispersion value indicated in the graphs of Fig. 5 and 6a is normal for these alloys, even when they are cast in a)

Figure 7. Micrograph of the alloys studied, showing the β phase present. a) alloy 1; b) alloy 2.

(7)

a permanent mold with a much finer microstructure6.

Moreo-ver, an initial analysis of Fig.6a and a comparison with Fig. 5 reveals that the volumetric porosity in the fracture is higher than the global volumetric porosity of the same sample17.

This difference, therefore, confirms that the effect of poros-ity on the loss of mechanical properties per unit of porosporos-ity is overestimated when it refers to global volumetric poros-ity.

Due to the different compositions of the two alloys, one might expect a parallel displacement of the corresponding curves in a representation of tensile strength versus poros-ity, but not a change in slope. The slight difference in the slope of tensile strength versus the straight lines of porosity, in Fig. 6a, is too small to be attributed to the higher content of β-Al5FeSi phase and Si plate, as some authors affirm10.

Reports that attribute the increasing deterioration of mechanical properties to the combined action of porosity and β-Al5FeSi phase are confusing, since they consider a simultaneous change in these two microstructural charac-teristics. In the results shown here for the two alloys and for each level of porosity, only the composition and, conse-quently, the content of Si and β-Al5FeSi phase were changed. In Fig. 6a, the alloy with much greater strength shows the least effect of porosity on the elongation values. This finding is congruent with that observed by Eady and Smith12

for 356 aluminum alloy. The alloy with greater elongation and low porosity, alloy 1, having 0.75% of volumetric po-rosity in the fracture, displayed a lower elongation value than did alloy 2.

The hardening work coefficient of both alloys was meas-ured, showing n1 = 0.36 for alloy 1 and n2 = 0.40 for alloy 2. These values are average, since they decrease as the poros-ity increases. The higher value of n in alloy 2 has a greater capacity to distribute plastic deformation. This condition decreases the effect of area loss due to the presence of pores, thus making the alloy’s ductility less sensitive to porosity.

It is worth noting that, although the tensile strength of the two alloys is affected similarly by the porosity, the elon-gation is more strongly affected in alloy 1.

Figures 5 and 6a illustrate the yield strength versus both the global volumetric porosity and the volumetric porosity in the fracture.

In Fig. 6b, the loss of yield strength caused by porosity is explained mainly by the sample’s loss of area. The tensile strength values cannot be explained, even though the “ef-fective diameter” criterion proposed by Surappa5 was

ap-plied. However, the loss of area represented by the pores was undoubtedly not the only cause for the drop in tensile strength.

It is interesting to note that, regardless of their position in

a) b) c)

d) e)

(8)

Figure 9. Volumetric distribution of porosity on the plate.

Figure 10. Correlation between global volumetric porosity and volumetric porosity in the fracture.

relation to the pore, the particles close to pores and separated from the fracture plane are not fractured (Fig. 8d and 8e), appearing to indicate that these pores did not behave as stress concentrators, which corroborates Surappa’s observations.

On the other hand, the results obtained reveal a possible error in evaluating the effect of the global volumetric rosity, which may differ significantly from that of the po-rosity at the fracture surface, the latter being directly re-sponsible for reducing the mechanical properties.

Figure 10 shows the tendency of the experiments per-formed here, relating the global volumetric porosity to the volumetric porosity in the fracture.

Some authors15,17 obtained lower dispersion values when

correlating the mechanical properties with the volumetric porosity in the fracture. Such lower values were not observed

in our study, although it should be noted that our measure-ments were not taken at the fracture but were obtained by weighing a volume 5 mm from the fracture surface. Meas-urements of smaller volumes (much closer to the fracture) showed no significant variations.

Figures 8a, 8b and 8c show the characteristic microstruc-ture in the zone of fracmicrostruc-ture. As can be seen, the damaged particles were restricted to a narrow site not wider than 150 µm. The fractured particles were oriented mostly along the major axis nearly perpendicular to the direction in which the load was applied. This situation is similar to that de-scribed by Samuel3 for 319 aluminum alloy, but contrary to

that observed by Cáceres17 in 356 aluminum alloy. In the

latter’s report, the fractured particles were oriented with their major axis aligned approximately in the direction of the applied load. This orientation was also found in other cases of alloys with a ductile matrix18,19.

These findings appear to indicate that the particle dam-age models for ductile alloys, such as the one proposed by Cáceres17, do not apply to alloys with low elongation

val-ues, e.g., 319 and 380 aluminum alloys, since Cáceres adopted the “fiber-loading” mechanism proposed by Kelly and Davies20, which involves the transversal fracture of

par-ticles whose major axis is aligned with the direction of the applied load.

5. Conclusions

Although this study involved 380 aluminum alloy, our conclusions are not limited to this material.

The fact that the distribution of porosity was not ran-dom invalidates global volumetric porosity as the de-termining parameter for porosity-related deterioration of the alloy’s mechanical properties.

Correlating mechanical properties under tensile stress to global volumetric porosity leads to an overestima-tion of the effect of porosity on the deterioraoverestima-tion of these properties, since fracture porosity (usually higher) rather than global volumetric porosity is di-rectly responsible for this deterioration.

No fixed ratio exists between global volumetric po-rosity and volumetric popo-rosity in the fracture, since this ratio depends on local conditions of solidifica-tion. Because the ratio between the two porosities can-not be preestablished, it is impossible to establish the aforementioned overestimation.

The effect of porosity on yield strength may be attrib-uted basically to the loss of resistant area resulting from the presence of pores.

Because fracturing usually occurs in the area with the highest degree of porosity, it is evidently determined mainly by porosity.

(9)

even when the resistant area in the sample is corrected by porosity effect, indicating that the effect is not solely attributable to the loss of area in the tested section of the material.

The alloys’ variation in ductility appears to be more closely related with the hardening work coefficient than with the presence of brittle phases.

The model proposed by Cáceres for brittle particle damage is not applicable to low ductility alloys.

References

1. Samuel, A.M.; Samuel, F.H. Journal of Materials Sci-ence, v. 30, p. 4823, 1995.

2. Radhakrishna; Seshan; Seshadri, M.R. Transactions In-dian Inst. Metals, v. 34, p. 169, 1981.

3. Samuel, A.M.; Samuel, F.H. Metallurgical and Materi-als Transactions A. v 26ª, p. 2359, 1995.

4. Surappa, M.K.; Blank, E.; Jaquet, J.C. Scripta Metallurgica, v. 20, p.1281, 1986.

5. Cáceres, C.H. Scripta Metallurgica et Materalia, v. 32, n. 11, p. 1851, 1995.

6. Wang, L.; Makhlouf, M.; Apelian, D. AFS Transactions, p. 675, 1995.

7. Cáceres, C.H.; Davidson, C.J.; Griffiths, J.R.; Wang, Q.G.

Metallurgical and Materials Transactions A, v 30 A, p. 2611, 1999.

8. Wang, Q.G.; Cáceres, C.H.; Griffiths, J.R. AFS

Transac-tions, p. 131, 1998.

9. Vorren, O.; Evensen, J.E.; Pedersen, T. B. AFS Transac-tions, p. 459, 1984.

10. Murali, S.; Raman, K.S.; Murthy, K.S.S. AFS Transac-tions, p. 1175, 1996.

11. Cuyás, J.C.; Mugica, G.W.; Tovio, D.O.; González, A.C.

“Jornadas SAM 2000 - IV Coloquio Latinoamericano de Fractura y Fatiga”, Neuquén Argentina, v. 1, p. 191, agosto/2000.

12. Eady, J.A.; Smith, D.M. Materials Forum, v. 9, n. 4, p. 217, 1986.

13. Tovio, D.O.; Mugica, G.W.; González, A.C.; Cuyás, J.C.

AFS Transactions, p. 457, 2001.

14. Hatch, J.E. Aluminum Properties and Physical Metal-lurgy, American Society for Metals 9 th Edition, p. 35, 1999.

15. Spear, R.E.; Gardner. AFS Transactions, v. 71, p. 209, 1963.

16. Shumacher, J.J.; González, A.C.; Cuyás, J.C. Congreso Bolivariano de Ingeniería Mecánica, in press, julio/2001. 17. Cáceres, C.H.; Griffiths, J.R. Acta Materalia, v. 44, n. 1,

p. 25, 1996.

18. Le Roy, G.; Emburg, J.D. ; Edward, G.E.; Asbhy, M.F.

Acta Metallurgica, p. 1509, 1981.

19. Walli, K.; Saario, T.; Torronen, K. International Jour-nal of Fractura, p. 201, 1987.

(10)

Imagem

Figure 1. Diagram of the plate. The dots indicate the position of thermocouples used for measuring the cooling rate.
Table 3. Grain and dendritic cell sizes of the two compositions at different distances from the plate’s cold end.
Figure 5 shows the behavior of tensile strength, yield strength and elongation versus global volumetric porosity.
Figure 6. a)Tensile strength, yield strength and elongation rate as a function of the volumetric porosity near the fracture surface of the two alloys; b) Tensile strength and yield strength as a function of the volumetric porosity near the fracture surface
+4

Referências

Documentos relacionados

The results indicate that the level of insulin resistance must be monitored in adolescents with excess weight and body fat, as it seems that, the higher the

The results of the present study indicate that the combination of ACP with morphine, meperidine and fentanyl results in moderate to intense sedation, with a higher incidence

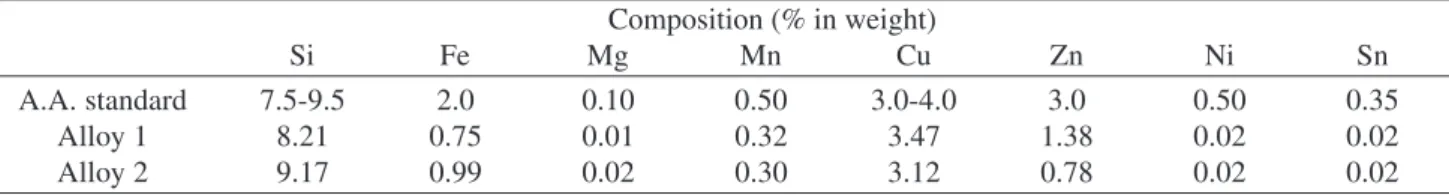
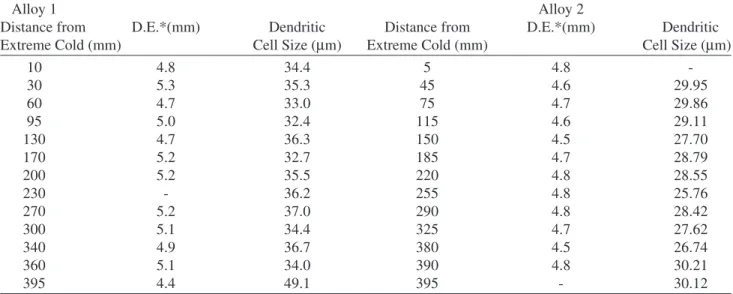
The purpose of the present work is to improve the mechanical properties (elongation % and strength) of the hypereutectic Al-Si alloy using rapid solidiication, addition

In order to observe the efect of growth velocity and Fe content on microstructure and mechanical properties of Al–1.9Mn–xFe alloys, eutectic rod spacings, microhardness and

The titanium content and the number of carbides per area of these alloys, in spite of being much higher than in the L1 alloy, were very low (Ti content maximum of 0.03% and number

The structure of the remelting zone of the steel C90 steel be- fore conventional tempering consitute cells, dendritic cells, sur- rounded with the cementite, inside of

social assistance. The protection of jobs within some enterprises, cooperatives, forms of economical associations, constitute an efficient social policy, totally different from

Results: The results showed that the physical and mechanical properties of the experimental TFMs with ZM are comparable with the properties of the commercial reference and