*e-mail: [email protected]
Trabalho apresentado no 1º Congresso da Sociedade Brasileira em Materiais, Rio de Janeiro, Julho de 2002.
Microhardness and Chemical Composition of Human Tooth
Maria del Pilar Gutiérrez-Salazara,b, Jorge Reyes-Gasgaa*
aInstituto de Física, UNAM; Apdo. Postal 20-364, 01000 México D.F., México
bFacultad de Odontología, UNAM; Circuito de la Investigación s/n. Cd. Universitaria,
04510 Coyoacán, México D.F., México
Received: November 15, 2002; Revised: June 2, 2003
Hardness of human tooth, both in enamel and dentin, has been measured at different sites using a Vicker’s diamond. In this work we show that these values are almost constant all along the enamel and dentin thicknesses. Indentations were done from outer enamel surface to inner dentin layer, going through the enamel-dentin junction, both in transverse and longitudinal samples. Geometrical well-shape indentation uniformity was checked both with light and with scanning electron microscopes, and the chemical composition of the tooth was analyzed with characteristic X-ray energy dispersive spectroscopy. Hardness measurements were in the range from 270 to 360 VHN for enamel and 50 to 60 VHN for dentin. Cervical zone in longitudinal section showed the lowest value while in transverse sections the highest. All the hardness values were statically significative. Tour results indicate that the difference between enamel and dentin hardness has nothing to do with the content of Na, Cl and Mg, but the percentage of organic and inorganic materials in enamel and dentin.
Keywords:microhardness, chemical composition, human tooth, enamel, dentin
1. Introduction
Tooth enamel is the most mineralized tissue of human body. Its composition is 96 wt.% inorganic material and 4 wt.% organic material and water. In dentin, the inorganic material represents 70 wt.%. This inorganic material is mainly composed by a calcium phosphate related to the hexagonal hydroxyapatite, whose chemical formula is Ca10(PO4)6·2(OH) 1. X-ray energy dispersive spectroscopy
(EDS) analysis of enamel and dentin also indicated the pres-ence in small quantities of other elements such as Na, Cl and Mg 2.
Human teeth are exposed to a different point-to-point pressure during mastication. Therefore, the study and analy-sis of their hardness is very important for understanding how masticatory strains are distributed throughout the tooth, and for predicting how stresses and strains are altered by dental restorative procedures, age and disease. Moreover, the hardness values can be related to other mechanical prop-erties, such as Young’s modulus and yield stress3,4.
Meas-urement of hardness in tooth is not easy, however. Because the structures that enamel2 and dentin present, prisms
run-ning from the enamel-dentin junction (EDJ) to the surface
in the case of enamel and a heterogeneous composite mate-rial in the case of dentin5-7, it is easy to imagine that their
hardness values are different, even from one site to other inside enamel and dentin themselves; and that they would be chemically dependent.
Hardness testing, together with intra-oral models, has great importance in de- and re-mineralization experiments8. The
hardness of human tooth has been determined by a variety of methods, including abrasion9, scratch10, and indentation
tech-niques3,4,11-14. Since considerable local variations have been
reported in enamel and dentin, the methods using a micro-scratch or micro-indentation have been preferred, and the Knoop diamond indenter is commonly used4,8,13,14. Recently,
nano-indentation using atomic force microscopy was reported in hardness measurements of dentin3.
Knoop (KHN) and Vicker (VHN) hardnesses have re-ported approximately the same value15. The average
hard-ness value for enamel and dentin is in the range from 270 to 350 KHN (or from 250 to 360 VHN) and from 50 to 70 KHN respectively4. However, the standard deviations (SD)
for example, Craig and Peyton13 reported for enamel a
hard-ness in the range from 344 ± 49 to 418 ± 60 VHN; Collys et al.14 from 369 ± 25 to 431 ± 35; Wilson and Love16 from
263 ± 26 to 327 ± 40. The micro-hardness of the occlusal enamel varied from 359 to 424 VHN, and that of the cervical enamel from 227 to 342 VHN14. These variations can be
pro-duced by factors such as histology features, chemical com-position, specimen preparation, and load and reading error in indentation length (IL).
In sound human enamel, it was reported that the hard-ness values, the mineral content, and the density gradually decrease from the outer surface to the EDJ18-22. More
spe-cific, Kodaka et al.19 found a moderate correlation between
the Vicker hardness and P concentration in enamel, but a low correlation with Ca. They indicated that VHN values, Ca and P percentage significantly decreased in the outer, middle and inner enamel sites. Other studies11,19 reported
that the outer enamel surface is harder than the inner sur-face, and that hardness continuously decreases from the outer edge to EDJ. Gustafson and Kling21 proposed that the
dif-ferences of hardness in enamel can be produced by varia-tions in the direction of indentavaria-tions in a single tooth sec-tion. However, some other studies13 have found any
differ-ence at all, only slight indications that enamel is harder in the cusp and outer surface than in the cervical margin or EDJ, but the difference was less than the SD reported, and thus no definite statement can be made.
Hardness numbers reported for dentin also varies. Be-cause of the larger size of the indentation in relation to the dentin microstructure, this variation may be due to the dif-ferences in the dentinal tubule density at different locations. Kenney et al.3,using a modified atomic-force microscope
to measure the hardness of dentin, indicated that hydrated peritubular dentin has a hardness inside the range from 2.2 to 2.5 GPa independent of location, while in intertubular dentin this hardness did depend upon location, and it was significantly greater near the EDJ (values from 0.49 to 0.52 GPa) than near the pulp (from 0.12 to 0.18 GPa).
Another parameter that must be taken into account in is time. It was reported that in human tooth the hardness in-dentations restored after time13,22. However, in general,
lit-tle is known about the way the size of these indentations changes with time. Since enamel is a rather brittle material, time dependency of an indentation seems to be very small or negligible. But, in dentin, Herkstroter et al.22 found that
indentations relaxed (becomes smaller) over a period of one day; after that the indentations do not change statistically anymore. Some explanation for indentation relaxation could be the differences in the content of organic matrix and/or in the bonding between mineral and organic matrix.
As it can be seen, too many parameters are involved in the analysis of human tooth hardness; therefore, in this work we obtain accurate Vickers hardness values (with minimum SD)
for enamel and dentin in sound teeth. We took care of the sample preparation method, the chemical composition all along the tooth, and the relative orientation of the indenter with the enamel prisms and dentin tubules to identify and control the parameters that statistically affect the hardness measurement. Vickers hardness indentations were measured and analyzed with light microscopy (LM) and scanning elec-tron microscopy (SEM).
2. Experimental procedure
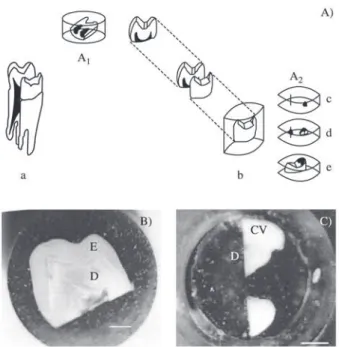
Seven mature, sound premolars freshly extracted by or-thodontic reasons were embedded in self-curing resin (Fig. 1). The embedded teeth were sectioned either trans-versely or longitudinally (Fig. 1: a, A2) using diamond wheel cutter Whiler Mod. Cutto-1. Three teeth were sectioned par-allel to the occlusal surface, making cuts close to 0.5 mm from the cuspid, 1.5 mm in the cusp, in the medium third, and the cervical third (Fig 1: c, d, e). The others were sec-tioned bucolingually perpendicular to the mesiodistal axis of the tooth (Fig. 1: A1).
One of the factors that affect the hardness measurement is the specimen preparation, because any tilt or not flat sur-face would yield a too large IL and thus a smaller VHN value. Therefore, to produce a flat surface in the specimens is crucial in this analysis. With this in mind, the specimens were polished with silicon carbide papers from no 1200 to
4000, in a progressively way, with water. Final polish was done with 0.05 polishing alumina in a low-speed metallur-gical polisher Buehler, mod. Minimet, with light load on the specimen. Afterwards, the samples were cleaned by three periods of 5 min each with distilled water inside on ultra-sonic cleaner Branultra-sonic mod. 52.
Vicker hardness measurements were made with a mi-cro-hardness tester Matsuzawa mod. MHT2 with a square based diamond indenter with 136° angle. This tester has a light microscope of high resolution and contrast with mag-nification of 400 ×. Indentations were made with a rate of 20 s descending and loads of 10 g, 25 g, and 50 g; and never close to any edge of the specimen or another indentation. The minimum distance between two consecutive indenta-tions was bigger than 40 µm. The number of indentations
from tables. The mean value and SD were calculated for both IL and VHN. Kappa statistics was used to assessment the reliability of the observer error in reading IL. A Kappa value of 0.90 was achieved. To reduce errors, the same ob-server made the reading. The Zeiss Axiotech LM and Jeol 5200 SEM microscopes were used for these observations. The results were analyzed comparing the diagonal indenta-tion length values using the variance analysis ANOVA. For the EDS chemical analysis, a Philips XL30 SEM with a NORAN-EDS detector, was used.
3. Results
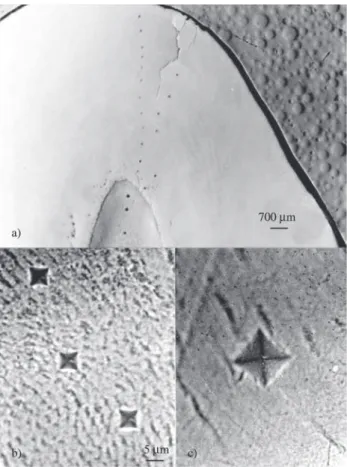
Figure 3 shows some of the main indentation irregulari-ties produced in human teeth when some experimental pa-rameters are not adequate; they are an indication that the sample preparation method, or the load, and/or the position of the indentation are not the correct ones. Any of these irregularities allow the correct measurement of IL, and, therefore, in this work, when one of them was observed, the sample was not used for hardness measurement. In fact, observation of any of these irregularities was enough for re-checking preparation and experimental procedures of the sample under analysis.
Figure 4 shows shape of the VHN indentations that cover all the requirements for hardness measurements. Figure 4a shows an example of indentations produced through all the tooth thickness in a cusp longitudinal sample. Figure 4b shows some of the indentation produced in enamel, while Fig. 4c shows one in dentin. Magnification in Figs. 4b and 4c is the same, so the hardness difference in enamel and dentin is straightforward. Figure 4 also allows the compari-son between the indentation size and the enamel prisms size: this indicates an indentation area of 25 µm2.
To avoid indentations such as those shown in Fig. 3, the sample preparation method was perfected and the analysis with loads of 10 , 25 , and 50 g was carried out. The mean values for IL produced with these loads in the same zone and their corresponding VHN values are shown in Table 1. Taking in account the SD in each case, the similar-ity of the VHN values in the zone analyzed is straightfor-ward. However SD for loads of 10 and 50 g are bigger than that for 25 g.
Collys et al.14 suggested a load of 50 g for studies of
hardness in tooth because they said that lower loads influ-ence the indentation size. They indicated two aspects for this load influence: 1) the sample surface is altered during the polish process producing a coating bigger than the big-gest depth reached for the indenter; and 2) with lower loads, the difficulty to read the indentation marks increase. How-ever, in this work we did not observe, after the sample prepa-ration method followed, any coating layer; eventhough, the enamel and dentin structure is always observed (Fig. 4).
Figure 1. A) Cutting of the human tooth and preparation of the samples for hardness measurements. a) Longitudinal cut; b) resin embedding; A1) longitudinal sample; A2) transverse sample (c-e). B) Light microscope image of section A1. C) Light microscope image of section A2 (d).
E = enamel, D = dentin, CV = vestibular cusp. Bar = 2 mm.
The length of the axes of the squared-shaped indenta-tion (IL) was read either with the micrometer scale fitted to the eyepiece of the hardness tester, with other light micro-scope (LM), and with SEM. The VHN value was obtained
The depth reached with the square based diamond indenter used was of 2 µm approximately. Moreover, with the load
of 50 g almost all the indentations showed fractures and material accumulation, such as those shown in Fig. 3. With the load of 10 g the indentations were very difficult to read. The hardness values obtained with both 25 and 50 g were statistically similar, but load of 25 g produced less fracture indications and better indentation shapes. There-fore, after the analysis of Table 1, and taking in account all above said, the load of 25 g was chosen for the hardness measurements. Occasionally some slight fractures were observed in the outer edge of the grove zone (zone 4) and in the middle third (zone 2), close to the vestibular surface, but not in any of the others. Time of load application is another parameter that we studied. McColm23 indicated that
15 to 30 s are quite recommended for ceramic materials. Therefore we applied the load of 25 g during 20 s for this study.
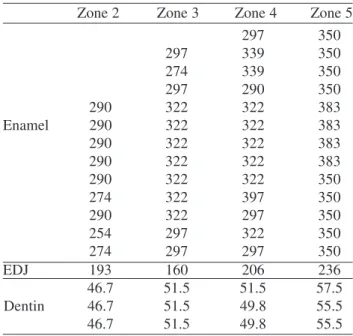
Figure 2 shows the different levels of the human tooth where the Vicker hardness indentations where carried out. Table 2 shows the main VHN values obtained with the load of 25 g at the different tooth zones evaluated. This table indicates that the zone corresponding to the transverse sec-tion parallel to occlusal (zone 5) showed the biggest hard-ness values, whereas zone 1 (cervical) showed the lowest. Note that, however, taking in account the SD values, the difference in hardness between of zone 1 and zone 5 is mini-mum. Table 3 shows the main VHN values obtained from the different zones evaluated. Here we observe that hard-ness in enamel is higher than in dentin, as expected, but it
remains almost constant in all the enamel and dentin thick-nesses respectively. Only close to the EDJ there is a gap where it decreases from enamel’s value to dentin’s value.
From the data obtained, the zone with the minimum VHN value was zone 2 (the middle third) while the biggest was the zone 5 (parallel to the occlusal). In general, indenta-tions in the transverse section samples where more easily reading, with very good shape and with minimum fracture mark. In the other hand, in longitudinal section the indenta-tions showed some indication of fracture, especially those of zone 2. Statistically speaking, the results obtained by ANOVA showed significative differences (p > 0.05) among the zone 5 and the others. From this, it is concluded that zone 5 showed the significatively bigger hardness value, whereas zone 1 showed the lowest.
The chemical analysis by EDS indicated that the Ca/P relationship was bigger in enamel than dentin. In enamel it was around 1.63, compared with 1.67 in pure
hydroxyapa-Figure 3. Light microscope images of the irregularities commonly observed in the hardness indentation of the human tooth produced by non-flat surfaces. For those on/or close the EDJ (a,b) the defor-mation is produced by the difference in hardness of enamel and dentin. Some indentations showed some cracking and accumula-tion of material around it (c, indicated by the arrow).
E: enamel; D: dentin.
Table 1. Vicker’s hardness number (VHN) and indentation length (IL) for different loads in the same tooth zone. Mean values and standard deviations (SD) for IL and VHN are shown. N is the number of indentations, taken from the 7 samples, and taken in account for statistics. Note the increment of SD for 10 g, because the error in IL measurement is bigger, and 50 g, because excessive load.
Load (g) N IL µm (± SD) VHN (± SD)
10 15 8.20 (± 0.24) 276 (± 19.03)
25 9 12.60 (± 0.17) 292 (± 09.67)
50 10 17.30 (± 0.61) 310 (± 24.83)
Table 2. Vicker’s hardness number (VHN) and indentation length (IL) for the five analyzed zones from the 7 samples analyzed. Mean values and standard deviation (SD) for IL and VHN are shown. N is the number of indentations taken from the 7 samples, and taken in account for statistics. These data was obtained with a load of 25 g. Note the small variations in VHN values for the first four zones when SD, indicated by (*), is taken in account. The parallel to occlusal zone presents the bigger VHN value.
Zone N IL µm (± SD) VHN (*)
1. Cervical 55 13.06 (± 1.19) 270 (230-279)
2. Middlethird 114 12.51 (± 0.45) 297 (279-322)
3. Cusp 154 12.54 (± 0.58) 297 (266-327)
4. Grove 89 12.39 (± 0.48) 301 (327-390)
5. Parallel to
289 11.31 (± 0.55) 363 (327-397)
occlusal
Table 3. Main VHN values for the five zones from the 7 samples analyzed. Zone 1 (cervical) was not included because its very small thickness allowed only few good indentations (always less than four). The value for EDJ represents indentations in enamel, 20 µm away from the junction.
Zone 2 Zone 3 Zone 4 Zone 5
297 350
297 339 350
274 339 350
297 290 350
290 322 322 383
Enamel 290 322 322 383
290 322 322 383
290 322 322 383
290 322 322 350
274 322 397 350
290 322 297 350
254 297 322 350
274 297 297 350
EDJ 193 160 206 236
46.7 51.5 51.5 57.5
Dentin 46.7 51.5 49.8 55.5
46.7 51.5 49.8 55.5
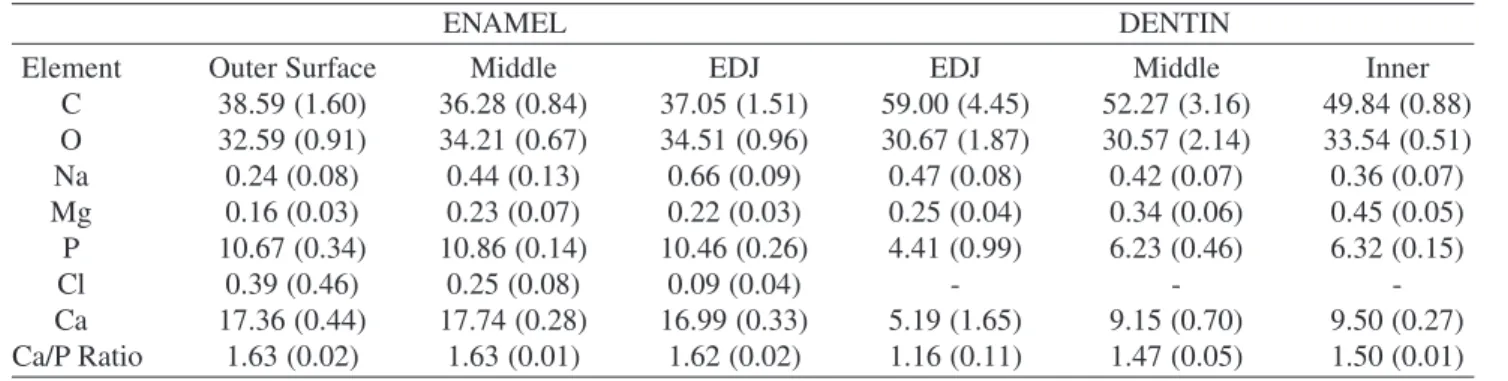
tite; that is, more Ca than P (Table 4). Na, Cl and Mg were also detected24 (Fig. 5). In general, in enamel Na and Mg
showed a minimum in the enamel outer surface, but in-creased continuously until reach the EDJ. Ca and P remained almost constant all the enamel thickness. Cl was higher de-tected in the enamel outer surface than in EDJ. In dentin, the ratio Ca/P was found around 1.5 (Table 4); that is, more P in enamel than in dentin; Cl was not presented, Mg in-creased from EDJ to the inner surface, and Na dein-creased in these sites (Fig. 5). It is also worth noting the behavior of C and O: in dentin the percentage of C and O is higher than in enamel. This is an indication of more weight percentage of organic material in dentin than in enamel, as it is well known.
4. Discussion
According with our results, in tooth hardness studies the Vicker indenter is more useful than the Knoop’s because a square shape has to be always conserved; and close to the outer surface and the EDJ a small elongation of the diago-nals of the indentations, that produce errors in hardness measurements, is easily detected. Therefore, we propose that the Vicker indenter has to be used always in the tooth hard-ness studies.
We statistically found any significative hardness differ-ence in the same zone of the sound tooth samples analyzed but only among the different zones of the same tooth itself,
Table 4. EDS results from enamel and dentin. Data in at.% and they are the main values from 3 samples analyzed. EDS analysis was carried out from the outer enamel surface to EDJ in enamel, and from EDJ to the inner dentin layer in dentin. The data in the two EDJ columns were taken inside enamel and dentin respectively, but 20 µm away from the EDJ in each case. The data for Na, Cl and Mg are graphically shown in Fig. 5.
ENAMEL DENTIN
Element Outer Surface Middle EDJ EDJ Middle Inner
C 38.59 (1.60) 36.28 (0.84) 37.05 (1.51) 59.00 (4.45) 52.27 (3.16) 49.84 (0.88)
O 32.59 (0.91) 34.21 (0.67) 34.51 (0.96) 30.67 (1.87) 30.57 (2.14) 33.54 (0.51)
Na 0.24 (0.08) 0.44 (0.13) 0.66 (0.09) 0.47 (0.08) 0.42 (0.07) 0.36 (0.07)
Mg 0.16 (0.03) 0.23 (0.07) 0.22 (0.03) 0.25 (0.04) 0.34 (0.06) 0.45 (0.05)
P 10.67 (0.34) 10.86 (0.14) 10.46 (0.26) 4.41 (0.99) 6.23 (0.46) 6.32 (0.15)
Cl 0.39 (0.46) 0.25 (0.08) 0.09 (0.04) - -
-Ca 17.36 (0.44) 17.74 (0.28) 16.99 (0.33) 5.19 (1.65) 9.15 (0.70) 9.50 (0.27)
Ca/P Ratio 1.63 (0.02) 1.63 (0.01) 1.62 (0.02) 1.16 (0.11) 1.47 (0.05) 1.50 (0.01)
according with Tables 2 and 3. We found hardness values in the range from 270 to 360 VHN for enamel and from 50 to 60 VHN for dentin; the differences depend on the zone evalu-ated. These results are similar to those reported by Craig and Peyton13, but in our case these VHN values are constant
all along the enamel and dentin thicknesses for each evalu-ation zone. In conclusion, an slight increment in hardness was observed from zone 1 to zone 5; that is, from the cervi-cal zone in longitudinal section to the transverse section, parallel to occlusal.
Some authors21 have indicated some variations in
hard-ness from the tooth outer surface compared with those sites close to EDJ, similar to the ones reported in Table 2, but they have also obtained, significative increments in the SD values. Eventhough, they have reported bigger VHN values for the outer surface than for the EDJ, indicating, as Gustafson and Kling21, that these differences in hardness
are produced by the wrinkled structure that prisms present in the outer surface. In this work, statistically speaking the hardness values remained constant along the enamel and dentin thicknesses respectively, and they only changed close to the EDJ for natural reasons: there is a gap of around 20 µm before and after the EDJ where the indentation shape
shows some of the irregularities indicated in Fig. 3. This gives place to lower hardness values such as those that they reported. We decide not to include these values in our meas-urements because they did not fulfill all the requirements to be accepted for a Vicker hardness analysis.
It is clear that the VHN difference between enamel and dentin is a result of the difference in the organic and inor-ganic materials content, as it is well known. However, ac-cording with our results, the VHN found in enamel and den-tin themselves are not influenced by the presence of the minor elements Na, Cl and Mg, as some authors have indi-cated18-22, but only for the percentage of mineralization in
these tissues.
5. Conclusions
The tooth Vicker hardness values do not show statisti-cally any change from the outer enamel surface to EDJ, and from EDJ to the inner dentin surface; they remain constant all along enamel and dentin thickness in the zone under analysis. The hardness is only bigger along the transversal section than along the longitudinal section, and slightly big-ger from zone 1 to zone 5. The VHN difference between enamel and dentin is a result of the percentage of minerali-zation they present.
Acknowledgements
We acknowledge the technical help from R. Trejo, J. Cañetas, R. Hernández, P. Mexia, C. Magaña, M. Aguilar, C. Zorrilla, S. Tehuacanero, L. Rendón, and A. Sánchez. We thank the economical support from DGAPAUNAM (Project IN-104902).
References
1. Le Geros, R.Z. Calcium phosphates in oral biology and medicine, Howard M. Myers, Ed., San Francisco, Cali-fornia, 1991.
2. Reyes-Gasga, J.; Alcantara-Rodriguez, C.M.; Gonzalez-Trejo, A.M.; Madrigal-Colin, A. Acta Microscopica, v. 6, p. 24-38, 1997.
3. Kinney, J.H.; Balooch, M.; Marshall, S.J.; Marshall. G.W.; Weihs, T.P. Archs Oral Biol., v. 41, p. 9-13, 1996. 4. Meredith, N.; Sherriff, M.; Setchell, D.J.; Swanson, S.A.V.
Archs, Oral Biol. v. 41, p. 539-545, 1996.
5. Marshall, G.W. Quintessence Int. v. 24, p. 606-617, 1993. 6. Fosse, G.; Saele, P.K.; Eibe, R. Acta Odontol. Scand,
v. 50, p. 201-210, 1992.
8. Stephen, N.; Wei, H.Y.; Koulourides, V. J. Dent. Res., v. 51, p. 648-651, 1972.
9. Taketa, F.; Perdue, H.S.; O’Rourke, W.F.; Sievert, H.W.; Phillips, P.H. J. Dent. Res., v. 36, p. 739-742, 1957. 10. Totah, V.P. J. Dent. Res., v. 21, p. 99-104, 1942. 11. Caldwell, R.C.; Muntz, M.L.; Gilmore, R.; Pigman, W.
J. Dent. Res., v. 36, p. 732-737, 1957.
12. Sweeney, W.T. J. Dent. Res., v. 21, p. 303-310, 1942. 13. Craig, R.G.; Peyton, F.A. J. Dent. Res., v. 37,
p.661-668, 1958.
14. Collys, K.; Slop, D.; Cleymaet, R.; Coomanss, D.; Michotte, Y. Dent Mater., v. 8, p. 332-335, 1992. 15. Ryge, G.; Foley, D.E.; Fairhurst, C.W. J. Dent. Res.
v. 40, p. 1116-1121, 1961.
16. Wilson, T.G.; Love, B. Am. J. Orth. and Dentofacial Orthop, v. 107, p. 379-381, 1995.
17. Gaspersic, D. J. Oral Pathol. Med., v. 24, p.153-158, 1995.
18. Robinson, C.; Weatherell, J.A.; Hallsworth, A.S. Caries Res., v. 15, p. 70-77, 1981.
19. Kodaka, T.; Debari, K.; Yamada, M.; Kuroiwa, M. Car-ies Res., v. 26, p. 139-141, 1992.
20. Davidson, C.L.; Hoekstra, I.S.; Arends, J. Caries Res., v. 8, p. 135-144, 1974.
21. Gustafson, G.; Kling, O. Odontol. Tskr., v. 56, p. 23-30, 1948.
22. Herkströter, F.M.; Witjes, M.; Ruben, J.; Arends, J. Car-ies Res., v. 23, p. 342-344, 1989.
23. McColm, I.J. Introduction and overview in ceramic hard-ness, Plenum Press, New York, 1990.