O
R
I
G
I
N
A
L
A
R
T
I
C
L
E
Elastic modulus of PVDF with bentonite or LiNbO
3
using
deformation energy
Carlos Alberto Fonzar Pintão
1* and Celso Xavier Cardoso
21
Department of Physics, Faculty of Science, Universidade Estadual Paulista “Julio de Mesquita Filho” –
UNESP, Bauru, SP, Brazil
2
Department of Physics, Chemistry and Biology, Faculty of Science and Technology, Universidade
Estadual Paulista “Julio de Mesquita Filho” – UNESP, Presidente Prudente, SP, Brazil
Abstract
Polyvinylidene luoride (PVDF) is valued for its properties of transparency to light, lightness, lexibility, mechanical strength, chemical stability, ease of processing, and low-cost production. Ceramics have low mechanical strength and poor processability, but have excellent piezo- and pyroelectric characteristics. The deiciencies of ceramics can be minimized by combining them with polymers. Accordingly, PVDF samples with different percentages of bentonite or
LiNbO3 were used to obtain composites via “casting,” and the modulus of elasticity (E) of the composites was studied
using a specially designed system. The method used to obtain E took into account the strain energy and the strength of
the materials. Based on the results, E decreased with an increased percentage of bentonite and, in the case of LiNbO3,
for the percentages of 30% and 35% increases.
Keywords: bentonite, deformation energy, LiNbO3, modulus of elasticity, PVDF.
1. Introduction
This study uses a specially designed system to determine the modulus of elasticity (E) of the tensile strength of polymer composites. Several methods and techniques can be used to obtain E, including static testing (tensile, torsion, bending), dynamic testing (resonant frequency method), wave propagation methods (ultrasonic echo-pulse method), and nanoindentation testing. Each method has advantages and disadvantages. Moreover, the measured Young’s modulus values obtained from these methods are different, even for the same sample material. Of these methods, the pulse-echo ultrasound method is most commonly
used[1,2]. This technique is nondestructive and does not
alter the sample’s physical or chemical properties; thus, it has significant practical interest. However, the pulse-echo ultrasound method can only measure E values for a single sample temperature and for well-defined sizes. In such cases, Poisson coefficient information is needed to obtain E, and the sample dimensions may be crucial. Clay and polymeric materials have complementary characteristics regarding the preparation of ferroelectric materials. Such materials are widely used in the electronics, sensors, and transducers industries, which require piezoelectric materials and easy processability. We used polyvinylidene fluoride (PVDF), which is an important transducer material because of its mechanical resistance, chemical inertness[3], and high
piezoelectricity[4]. PVDF is used in hydrophones, industrial
acoustic materials, and vibration sensors. Depending on the conditions used to process PVDF, it presents at least four crystalline phases, known as α, β, γ, and δ[5-7]. PVDF
has a spherulitic crystallization morphology in which the spherulites are formed by lamellar crystalline regions, which grow from the center to the edges in a radial direction, and by amorphous regions, located between the crystalline lamellae
of the spherulites[8,9]. In a dimethylformamide (DMF) solution
from which, in the crystallization of PVDF, both the α and β phases are obtained, it has been found[10] that, depending
on the crystallization temperature (T), the predominantly α-phase films crystallize at T < 160 °C. The influence of the PVDF phases is scientifically and technologically important because these phases can influence the physical and chemical properties of PVDF. In addition, PVDF is easy to process
and its production costs are low[11]. Unfortunately, neat
PVDF cannot completely meet the mechanical, thermal, and oxidation resistance property requirements of some harsh environments[12,13]. Many efforts have been made to improve
the properties of PVDF. For example, the incorporation of organic polymers or inorganic fillers into the PVDF matrix to produce composites has been extensively studied to further improve its properties[14,15]. This present study aims
to introduce and apply a technique to measure the modulus of elasticity (E) of polymeric composites.
2. Materials and Methods
The casting method was used to incorporate ceramic
LiNbO3 or bentonite into the PVDF, in which the PVDF
measurements were taken (Figure 1A). A caliper or micrometer was used to obtain the parameters (a and b) for determining the area of the rectangular cross-section (A) and the length (L) at the instant the tensile force was applied (Figure 1B).
The values for six samples of PVDF/LiNbO3, with increasing
percentages, by weight, of LiNbO3, are shown in Table 1,
while the values for 10 samples of PVDF/bentonite, with increasing percentages, by weight, of the bentonite, are presented in Table 2.
2.1 Deflection energy method for obtaining E
Consider an elastic structure submitted to applied loads and deformed elastically. In this deformation process, the principle of energy conservation[16] is used, expressed as:
+ = ∆ E
W Q E (1)
WE is the work carried out by the applied external forces,
Q is the heat that the structure exchanges with its surrounding area, and ΔE is the variation in the associated energies of the structure: kinetic energy (K) and internal energy (U). Considering that the increase in these loads is gradual and that a state of equilibrium is maintained during this process, then the variation of kinetic energy is zero and ΔE is due only to the variation in internal energy U. Under these conditions, Equation 1 is reduced to:
= ∆ E
W U (2)
The work, which is energy stored in the structure due to tensile force in an infinitesimal volume element[6,7],
is represented by the strain and stress tensors, σij and eij,
respectively. The energy, dU, which is stored in this element when the deformation has reached its final value eij, is:
Figure 1. (A) System for measuring E: (1) Pieces of attachment of samples; (2) Force sensor (FS-PASCO: CI6537); (3) XY table;
(4) Samples: PVDF/LiNbO3 or PVDF/Bentonite; (5) Rotational movement sensor (RMS-PASCO: CI6538; [8]); (6) Motor for moving
XY table; (7) Key to activate motor; (8) Computer with specific software; (9) Interface (PASCO: CI7650-750); (B) Schematic diagram of the XY table, Pieces of attachment of samples and FS; Cross section of sample of area A; Prismatic bar width a, height b and length L.
Table 1. Results of PVDF/LiNbO3.
LiNbO3, wt. % B0 (N/rad) L (mm) a (mm) b (mm) A (mm2) E (MPa)
4 1.480 ± 0.004 18.23 ± 0.05 15.45 ± 0.05 0.04 ± 0.01 0.6 ± 0.1 1510 ± 378 10 1.347 ± 0.004 13.66 ± 0.05 15.50 ± 0.05 0.03 ± 0.01 0.5 ± 0.2 1369 ± 458 15 0.727 ± 0.002 12.67 ± 0.05 13.75 ± 0.05 0.04 ± 0.01 0.6 ± 0.1 579 ± 145 25 0.727 ± 0.002 12.67 ± 0.05 13.75 ± 0.05 0.04 ± 0.01 0.6 ± 0.1 579 ± 145 30 7.34 ± 0.02 8.48 ± 0.05 11.6 ± 0.05 0.07 ± 0.01 0.8 ± 0.1 2651 ± 379 35 4.97 ± 0.02 5.29 ± 0.05 10.7 ± 0.05 0.04 ± 0.01 0.4 ± 0.1 2126 ± 532
Table 2. Results of PVDF/bentonite.
bentonite, wt. % B0 (N/rad) L (mm) a (mm) b (mm) A (mm2) E (MPa)
0
= ∫ σ eij
ij ij
dU de (3)
By integrating the total volume (V) of the structure, we obtain the total internal energy U due to the deflection, which is expressed as:
0
( )
=∫ ∫eij σij ij
U de dV (4)
In cases where the elastic structure shows linear behavior, it is isotropic, and it is subjected to pure tensile stress. Using Hooke’s law[16], it is established that:
2 11
1 2 =∫ σ
U dV
E (5)
where E is the modulus of elasticity of the tensile force. To measure E, a prismatic bar is used with a uniform cross-section of area A and length L, subjected to applied force F by a force sensor (FS) at one end with another attached to XY table (Figure 1A and B).
With regard to material resistance[17], it is known that the
stress state of an internal point of a polymer, xi, based on the
experimental conditions shown in Figure 1, is expressed as:
11
σ =F
A (6)
The cross-sectional area is represented by A, which is given by the product of the sides: width (a) and height (b). Substituting this stress component in Equation 5 yields the internal strain energy in the structure for this specific application:
2
2 =F L
U EA
(7)
The external work conducted by F is:
= ∆ E
W F L (8)
From Equation 7 and Equation 8, we obtain:
*
2
= E A∆ = ∆
F L B L
L (9)
If we replace the values of the cross-sectional area (A) and use B* and the calibration factor of the force sensor (f), we obtain the equation for the calculation of E:
*
2 =B L
E f
A (10)
2.2 Measurement of the modulus of elasticity of tensile force
A rotation movement sensor (RMS) was used to measure the turning angle, φ (rad), of the screw that moves the XY table when it shifts from ΔL[18]. A pulley, with a diameter
of ϕ=28.70 ± 0.05 mm, was attached to the RMS shaft. With the belt that passes through this pulley, and in the other pulley of the same diameter ϕ affixed to the shaft of the table
transmission mechanism, one can register φ. On the same side as the rotation sensor, we used a microwave motor with a constant torque to move the XY table in the two required directions: one for approximation and the other for drawing XY table away from the force sensor. One piece of the XY table is attached to the opposite side of the rotation sensors, and screws are used to fix one side of the sample. The force sensor (FS) has a fixture that is similar to that of the table. That fixture is attached with a screw to the other end of the sample (Figure 1A and B). The FS is fixed to a steel base that sits on a countertop. Turning the screw moves the XY table at an angle φ (rad), displacing the sample. The motion is measured by ΔL, i.e., φ (0.000160 m).
Thus, tensile force is slowly applied to the sample by force F. FS is zeroed before measuring F. The value of F is automatically recorded for each angle φ with an RMS. The two sensors are connected at an interface to a computer. Using PASCO software, the experimental points for F (N) and φ (rad) are obtained in real-time, simultaneously. Thus, we can adjust the straight line and obtain the slope of B0 because
the points are linear in a regime in which the material shows elastic behavior. The slope B0 has units expressed in N/rad,
which is transformed to N/m using the B*=B0 (1/0.000160)
ratio, since it was evaluated for the measurement system in question where 1 rad equals 0.000160 m.
To determine these measurements, we had to obtain a calibration factor (f) because the value of F measured (FMEASURED) in FS is different from that of F applied (FAPPLIED). Factor f can be obtained experimentally by
applying known forces (FAPPLIED), and then measuring
the forces with FS (FMEASURED). For this, we used known
masses: 0.020 kg, 0.050 kg, 0.100 kg, 0.200 kg, 0.500 kg, and 1.00 kg. They were fixed at one end of an inextensible cord passing over a pulley at the other end, and attached
to FS. Before placing the samples of polymer/LiNbO3 or
polymer/bentonite into clamps, their dimensions (a and b) were measured with a caliper and a micrometer.
At the beginning of the experiment, the samples were fixed on the XY table and FS by locking the components
without an applied tensile force. L0 was measured with
a caliper. The length, L, was obtained from the curve of force F (N) as a function of the angle φ (rad). For each of the samples studied, three measures of F as a function of the angle φ were obtained. The first measurement was very important for providing information about how many rotations (φ [ rad ]) were needed to turn the screw of the XY table to exert tensile force on the sample. L is reported as
the sum of (L0 + φ [0.00016 m]). For the second and third
3. Results and Discussion
The results presented in Figure 2 show the calibration curve of the FS. The value obtained was f = 11.0697 ± 0.0003. This value was used in Equation 10 to obtain E. A typical curve, F, as a function of φ for a PVDF/LiNbO3 (65/35 wt. %)
composites, is shown in Figure 3. The slope B0 of the
three curves shown in Figure 3 was obtained by fitting a straight line to each of the curves when they showed the linear behavior that is characteristic of an elastic regime. For the proposed method to be applied, it is important that a region on the curve of force F (N) as a function of the angle φ (rad) represents linear behavior. In our experimental procedure, the limits of elasticity of these samples were not exceeded. Thus, we achieved good reproducibility for the E value. On the other hand, a different procedure can be adopted that uses various samples cut from the same sample source. Then, the complete experimental curve (F as a function of φ) can be determined for each sample. In that case, we can determine E using the strain energy method. It is possible to obtain the values of the forces for the limit of elasticity and for the rupture of the sample. Toward that end, we must consider the maximum load limits of FS (± 20N). Because we had a number of reduced samples, we chose the method described in this paper. An examination of the samples under a microscope shows the presence of isotropic and anisotropic structures, which could be due to the method in which these compounds were prepared[5]. This may explain the greater or lesser rigidity
of the samples when adding increasing mass percentages of
LiNbO3. The procedure to obtain E shows that these samples
behaved as an elastic structure, but that does not mean that they were completely isotropic, and it does not invalidate the proposed method. As the crystallization temperature is decreased to < 160 °C, it is expected that there would be a predominance of the α phase[8-10]. For each PVDF sample with
different percentages of LiNbO3, we calculated the average
value of B0, measured by the sensors FS and RMS, relative
to the three measurements of the curves as a function of the angular position. Equation 10 was then used to calculate the
value of E. The results are shown in Table 1.
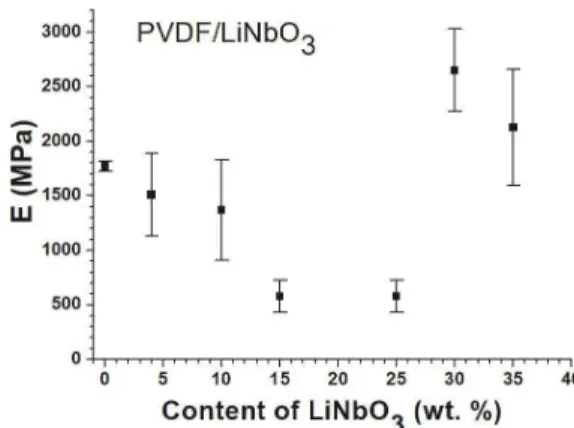
Figure 4 shows the final results of E, which is expressed in MPa for all the studied samples with increasing percentages
of LiNbO3. Using our method, the E value of the PVDF was
close to 2000 MPa, which is close to the expected value[19].
A typical curve, F, as a function of φ for a composite based on PVDF/bentonite (90/10 wt. %), is shown in Figure 5.
The same procedure for PVDF/LiNbO3 was performed for
PVDF/bentonite. For each PVDF sample with different percentages of bentonite, we calculated the average value
of B0, measured by the sensors FS and RMS, relative to
the three measurements of the curves as a function of the angular position. Equation 10 was then used to calculate
the value of E. The results are shown in Table 2.
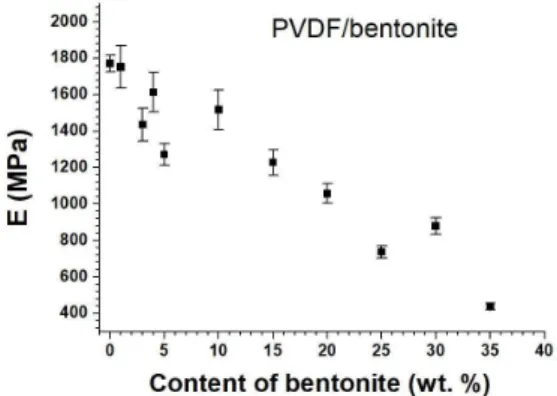
Figure 6 shows the final results of E, which is expressed in MPa for all the studied samples with increasing percentages of bentonite. In this case, the rigidity of the composite decreases with the increasing percentage, by weight, of bentonite.
Figure 2. Calibration curve of the force sensor. The calibration
factor f is 11.0697 ± 0.0003.
Figure 3. Typical curves of force F (N) as a function of the
angular position φ (rad). Sample of PVDF/LiNbO3: L0 = 4.65 ± 0.05 mm; L = 4.65 + 4.0 (0.16) = 5.29 mm ± 0.05 mm;
a = 10.70 ± 0.05 mm; b = 0.04 ± 0.01 mm; A = 0.4 ± 0.1 mm2;
B0 = 4.97 ± 0.02 N/rad; B*= 31083 ± 148 N/m. E is calculated using
Equation 10: E = 2126 ± 532 MPa.
Figure 4. Experimental values of E obtained in the samples
(PVDF/LiNbO3) at different percentages by weight. The value
of E for the sample PVDF/LINbO3 (100/0, wt. %) was obtained
4. Conclusions
The system described in this study is an alternative method for obtaining E in polymer composites. This method took into account the tensile strain energy and the strength of the materials. The method was applied to PVDF samples with
different percentages, by weight, of LiNbO3 or bentonite.
It can be used with other types of materials in cases where the elastic structure shows linear behavior. Based on our results, the studied samples showed variations in the values
of E when the percentage of LiNbO3 or bentonite changed.
The values of E decreased as the percentage of bentonite increased. The value of E increased when the percentages,
by weight, for LiNbO3 were 30% and 35%.
5. Acknowledgements
The authors thank FAPESP, process number: 2007/04094-9, and CAPES, process number: BEX
6571/14-0.
Figure 5. Typical curves of force F (N) as a function of the
angular position φ (rad). Sample of PVDF with bentonite:
L0 = 11.00 ± 0.05 mm; L = 11.00 +2.3 (0.16) = 11.37 mm ± 0.05 mm;
a = 12.20 ± 0.05 mm; b = 0.14 ± 0.01 mm; A = 1.71 ± 0.01 mm2;
B0 = 6.59 ± 0.02 N/rad; B*= 41188 ± 119 N/m. E is calculated by
Equation 10: E = 1518 ± 109 MPa.
Figure 6. Experimental values of E obtained from the samples
(PVDF/bentonite) at different percentages by weight. The value of E for the sample PVDF/bentonite (100/0, wt. %) was obtained according to Wallner et al.[19], that is, 1771 ± 46 MPa.
6. References
1. Truel, R., Elbaum, C., & Chic, B. B. (1969). Ultrasonic methods in solid state physics. New York: Academic Press.
2. Nowick, A. S., & Berry, B. S. (1972). Anelastic relaxation in crystalline solids. New York: Academic Press.
3. Roh, Y., Varadan, V. V., & Varadan, V. K. (2002). Characterization
of all the elastic, dielectric, and piezoelectric constants of uniaxially oriented poled PVDF films.IEEE Transactions on Ultrasonics, Ferroelectrics, and Frequency Control, 49(6), 836-847. PMid:12075977. http://dx.doi.org/10.1109/
TUFFC.2002.1009344.
4. Motyl, E. (2001). Comparison between step and pulsed
electroacoustic techniques using both PVDF and LiNbO3
transducers.Journal of Electrostatics, 51-52, 530-537. http://
dx.doi.org/10.1016/S0304-3886(01)00064-X.
5. Costa, C. M., Mendes, S. F., Sencadas, V., Ferreira, A., Gregorio,
R. Jr, Ribelles, J. L. G., & Méndez, S. L. (2010). Influence of
processing parameters on the polymer phase, microstructure and macroscopic properties of poly (vinilidene fluoride)/ Pb(Zr0.53Ti0.47)O3 composites.Journal of Non-Crystalline
Solids, 356(41-42), 2127-2133. http://dx.doi.org/10.1016/j.
jnoncrysol.2010.07.037.
6. Mendes, S. F., Costa, C. M., Caparros, C. V., Sencadas, V.
S., & Lanceros-Méndez, S. (2012). Effect of filler size and
concentration on the structure and properties of poly(vinylidene fluoride)/BaTiO3 nanocomposites.Journal of Materials Science, 47(3), 1378-1388. http://dx.doi.org/10.1007/s10853-011-5916-7.
7. Mendes, S. F., Costa, C. M., Sencadas, V., Nunes, J. S., Costa, P., Gregorio, R., Jr., & Méndez, S. L. (2009). Effect of the ceramic
grain size and concentration on the dynamical mechanical and dielectic behavior of poly (vinilidene fluoride)/Pb(Zr0.53Ti0.47)O3
composites.Applied Physics A: Materials Science & Processing, 96(4), 899-908. http://dx.doi.org/10.1007/s00339-009-5141-2. 8. Lovinger, A. J. (1982). Developments in crystalline polymers.
Journal of Polymer Science Part C: Polymer Letters, 20(10), 559-560. http://dx.doi.org/10.1002/pol.1982.130201011. 9. Broadhurst, M. G., Davis, G. T., Mckinney, J. E., & Collins, R.
E. (1978). Piezoelectricity and pyroelectricity in polyvinylidene
fluoride: a model.Journal of Applied Physics, 49(10), 4992-4997. http://dx.doi.org/10.1063/1.324445.
10. Gregorio, R., Jr., & Cestari, M. (1994). Effect of crystallization
temperature on the crystalline phase content and morphology of poly(vinylidene fluoride).Journal of Polymer Science. Part B, Polymer Physics, 32(5), 859-870. http://dx.doi.org/10.1002/
polb.1994.090320509.
11. Inderherbergh, J. (1990). Polyvinylidene fluoride (PVDF)
appearance, general properties and processing.Ferroelectrics, 115(4), 295-302. http://dx.doi.org/10.1080/00150193.1991.1 1876614.
12. Dargaville, T. R., Celina, M., & Chaplya, P. M. (2005). Evaluation
of piezoelectric Poly (vinylidene fluoride) polymers for use in space environments. I. Temperature limitations.Journal of Polymer Science. Part B, Polymer Physics, 43(11), 1310-1320.
http://dx.doi.org/10.1002/polb.20436.
13. Dargaville, T. R., Celina, M., Martin, J. W., & Banks, B.
A. (2005). Evaluation of piezoelectric PVDF polymers for
use in space environments. II. Effects of atomic oxygen and vacuum UV exposure.Journal of Polymer Science. Part B, Polymer Physics, 43(18), 2503-2513. http://dx.doi.org/10.1002/
polb.20549.
14. Malmonge, L. F., Langiano, S. C., Cordeiro, J. M. M., Mattoso,
L. H. C., & Malmonge, J. A. (2010). Thermal and Mechanical
15. Xu, H. P., Dang, Z. M., Jiang, M. J., Yao, S. H., & Bai, J.
(2008). Enhanced dielectric properties and positive temperature
coefficient effect in the binary polymer composites with surface modified carbon black.Journal of Materials Chemistry, 18(2), 229-234. http://dx.doi.org/10.1039/B713857A.
16. Tauchert, T. R. (1974). Energy principles in structural mechanics.
New York: McGraw-Hill.
17. Timoshenko, S. P., & Goodier, J. N. (1980). Theory of elasticity. 3rd ed. Rio de Janeiro: Guanabara Dois.
18. Pasco Scientific. (1996). User’s Guide: Science Workshop™ Interface, Version 2.2. Roseville: Pasco Partners LLC. 19. Wallner, G. M., Major, Z., Maier, G. A., & Lang, R. W. (2008).
Fracture analysis of annealed PVDF films.Polymer Testing, 27(3), 392-402. http://dx.doi.org/10.1016/j.polymertesting.2008.01.006.