Hydrol. Earth Syst. Sci., 17, 2569–2579, 2013 www.hydrol-earth-syst-sci.net/17/2569/2013/ doi:10.5194/hess-17-2569-2013
© Author(s) 2013. CC Attribution 3.0 License.
Geoscientiic
Geoscientiic
Geoscientiic
Geoscientiic
Hydrology and
Earth System
Sciences
Open Access
Gaining and losing stream reaches have opposite hydraulic
conductivity distribution patterns
X. Chen1, W. Dong1,2, G. Ou1, Z. Wang1, and C. Liu1
1School of Natural Resources, University of Nebraska-Lincoln, Lincoln, NE 68583-0996, USA
2Key Laboratory of Groundwater Resources and Environment of China Ministry of Education, Jilin University,
Changchun, 130021, China
Correspondence to:X. Chen ([email protected])
Received: 16 November 2012 – Published in Hydrol. Earth Syst. Sci. Discuss.: 4 February 2013 Revised: 24 May 2013 – Accepted: 31 May 2013 – Published: 9 July 2013
Abstract.In gaining streams, groundwater seeps out into the streams. In losing streams, stream water moves into ground-water systems. The flow moving through the streambed sedi-ments under these two types of hydrologic conditions is gen-erally in opposite directions (upward vs. downward). The two opposite flow mechanisms affect the pore size and fine parti-cle content of streambeds. Thus it is very likely that the oppo-site flow conditions affect the streambed hydraulic conduc-tivity. However, comparisons of the hydraulic conductivity (K) of streambeds for losing and gaining streams are not well documented. In this study, we examined theK distribution patterns of sediments below the channel surface or stream banks for the Platte River and its tributaries in Nebraska, USA. Two contrasting vertical distribution patterns were ob-served from the test sites. In gaining reaches, hydraulic con-ductivity of the streambed decreased with the depth of the sediment cores. In losing reaches, hydraulic conductivity in-creased with the depth of the sediment cores. These con-trasting patterns in the two types of streams were mostly at-tributed to flow directions during stream water and ground-water exchanges. In losing reaches, downward movement of water brought fine particle into the otherwise coarse sediment matrix, partially silting the pores. For gaining reaches, up-ward flow winnowed fine particles, increasing the pore spac-ing in the top parts of streambeds, leadspac-ing to higher hydraulic conductivity in shallower parts of streambeds. These flux di-rections can impactKvalues to depths of greater than 5 m. At each study site, in situ permeameter tests were conducted to measure theKvalues of the shallow streambed layer. Statis-tical analyses indicated thatKvalues from the sites of losing
reaches were significantly different from theKvalues from the sites of gaining reaches.
1 Introduction
Stream networks drain land surface runoff and can receive groundwater baseflow. In stream–aquifer interactions, wa-ter or solute passes through streambeds that control the hy-drologic connectivity between stream water and groundwa-ter. Streambed hydraulic conductivity is a key parameter in the analysis of stream–aquifer interactions. In areas where streamflow depletion induced by groundwater use is a wa-ter management issue, knowledge of streambed hydraulic conductivity is needed in the development of integrated wa-ter use plans of stream wawa-ter and groundwawa-ter. When rivers are polluted, migration of pollutants from rivers to the ad-jacent aquifer systems poses a big threat to the quality of the groundwater supply systems and thus to human health. Streambed hydraulic properties control the seepage velocity and thus the movement of contaminants between rivers and groundwater.
(Rosenberry and Pitlick, 2009a). When streambed mobility is low, upward flow enhances the hydraulic conductivity and downward flow reduces hydraulic conductivity. The ratio of
K determined during upward flow toK determined during downward flow is greater than 1 and can be as high as 2.4 (Rosenberry and Pitlick, 2009a). Downward seepage pulls fine-grained particles onto or into the bed until they clog pore spaces and reduceK in the sediment volume at or just below the sediment–water interface (Rosenberry and Pitlick, 2009a). Upward seepage velocity at the points of preferential discharge often is sufficient to suspend particles, even with no surface water current. The upward force thus expands the pore space, leading to higher hydraulic conductivity.
Some lab flume studies (Packman et al., 2000a,b) demon-strated that the forming of clogging layers is a common sed-imentation process in streams. Clogging is a very effective process that reduces streambed hydraulic conductivity. The simulations using flumes often neglect the groundwater com-ponent and do not relate seepage direction to K changes. A recent study by Karwan and Saiers (2012) suggested that clay-sized particles and colloids can travel within the pore space of sediments by stream water filtration in the hyporheic zone. Steady dynamic pressure variations over bedforms in-duce streamflow to enter the streambed and then exit (Elliot and Brooks, 1997). While they did not discuss the possible effect of this filtration onK, it is apparent that when reten-tion of clay takes place in the streambed, the fine materials will likely reduce the hydraulic conductivity. This numer-ical simulation of particle transport in sediments (Karwan and Saiers, 2012) focuses on the filtration of clay particles in small-scale sediments (<0.5 m in depth) below the water– sediment interface. Laboratory studies are conditioned to a small sand column or sand box. Thus, these small-scale stud-ies under controlled hydrodynamic conditions do not fully reflect how the streambed hydraulic conductivity has been changed by upward or downward flow directions in the sed-iments under natural settings of streambeds. Rosenberry and Pitlick (2009a) suggested that it would be valuable if re-searchers could document the effects of seepage direction (upward or downward) on the K distribution in the natu-ral world because this directional bias has been neglected in most field investigations. In a field investigation in the South Platte River of Colorado using a seepage meter method, Rosenberry and Pitlick (2009b) confirmed that vertical hy-draulic conductivity at specific locations varied depending on seepage direction, and was slightly larger to more than an or-der of magnitude larger during upward seepage than during downward seepage.
An infiltration situation in losing streams can occur under natural conditions or be induced by lowering the groundwa-ter table by adjacent pumping wells (Hiscock and Grischek, 2002). Streambeds and the river banks provide filtration functions that lead to deposition of fine particulate matter (organic or inorganic), biological colonization, and chemi-cal precipitation or mineralization. The input and deposition
of sediment particles, micro-organisms and colloids, and the precipitation of iron and manganese oxy-hydroxides and calcium carbonates within the streambed reduce streambed hydraulic conductivity (Hiscock and Grischek, 2002). The physical, biological and chemical processes are the driving mechanisms that clog stream sediments and reduce the sed-iment pores under losing conditions (Hancock, 2002). The physical process mainly involves settling of fine particulate matter on the water–sediment interface; some fine particles can be transported into the pores of the upper streambed layer depending on the hydrologic condition and sediment structures (Bouwer, 2002; Cui et al., 2008; Stuyfzand et al., 2006; Wett et al., 2002). For example, the accumulation of fine solids at a Rhine River riverbank filtration site is lim-ited to the water–sediment interface, and chemical precipita-tion occurs about 10 cm below the interface (Schubert, 2002). Gunkel and Hoffmann (2006) confirmed that in a bank fil-tration system of Lake Tegel (Germany) algae (mainly di-atoms) adapts to the sediment pore system and has a very high concentration in the upper 5 cm of sediment which sig-nificantly influences the composition of the upper sediment layer. The concentration of algae rapidly decreases below 10 cm. It seems that the effect of the physical, biological and chemical clogging is most significant only at a small depth. However, the clogging can reduce the streambed hydraulic conductivity by 10–100 times and thus reduces the hydrolog-ical connections between streams and the adjacent aquifers. The filtration efficiency of the streambed depends on several physical, biological and chemical factors, including the size of suspended particles and streambed sediment composition, pore water velocity, pore water pH and ionic strength, and the surface chemical composition of the suspended particles (Ren and Packman, 2002; Karwan and Saiers, 2012). Differ-ences in grain size (and therefore pore size) of the framework exercises a strong controlling influence on the infiltration of fine particles into bed interstices (Frostick et al., 1984).
Numerical simulations of stream–groundwater interac-tions across channels indicate that stream water infiltration in streambeds can penetrate a depth greater than one meter and reach a depth of up to 5 m beneath the water–sediment interface (Chen and Chen, 2003). Numerical simulations of hyporheic exchanges along stream longitudinal profiles indi-cate that stream water penetration into streambeds can reach depths up to 10 m (Gooseff et al., 2006). This filtration pro-cess, if bringing fine particles into the channel sediments, will reduce the pore space of the original framework of the streambed, leading to decreased streambedKat greater depths than laboratory experiments can illustrate. However, the effective depth of this potential mechanism for reducing
X. Chen et al.: Gaining and losing stream reaches have opposite hydraulic distribution patterns 2571
as the infiltrated stream water plume travels downward. Con-sequently, this filtration process can form a streambed that has a higher content of silt and clay in the shallow parts of the streambed. It will thus be interesting to investigate how this filtration process affectsK variations with depth in los-ing stream reaches. Furthermore, in loslos-ing streams, water moves laterally in addition to seeping downward as shown by Chen and Chen (2003). Thus, fine particles can filtrate later-ally into the sediments below river banks. Field observations by Banzhaf et al. (2011) and Gerecht et al. (2011) indicated that stream water is able to move into river banks laterally for several meters. To the best of our knowledge, careful analy-sis ofKprofiles specifically for losing streams has not been conducted.
Opposite to losing streams, gaining streams receive groundwater which migrates predominantly in the vertical direction beneath the water–sediment interface. This upward movement expands pore size and then enhancesKof the top parts of streambeds (Song et al., 2007; Chen, 2011). Upward flow can pick up fine particles that otherwise are retained on the surface of coarse particles or clog between coarse grains. The water flow in pores suspends the fine particles and brings them upwards into streams; stream currents wash away the fine materials. This winnowing process sorts streambed sedi-ments and leaves coarse materials in streambeds. As a result, the hydraulic conductivity becomes larger in the top layer of streambeds (Dong et al., 2012).
Based on the above analyses, theK distribution in these two groups of streams will form opposite patterns. It is likely that in losing reaches, streambedKis the smallest near the water–sediment interface and increases with depth; in gain-ing streams, streambed K is likely the greatest near the water–sediment interface and decreases with depth. It would be ideal if a study were conducted in the same stream reach during a losing condition and a gaining condition. It is dif-ficult, however, to predict when the change of seepage di-rection will occur or whether the didi-rection will change for a given stream segment. In this study, we selected several stream reaches which were either predominantly losing or predominantly gaining. We determined the losing and gain-ing conditions for the study sites based on field methods or groundwater modeling results. We conducted in-channel falling-head permeameter tests to determine theKfor the top streambed layers using the method described by Chen (2004) and Genereux et al. (2008). From theseK values, we iden-tified the difference of theK of the top-layer sediments be-tween the two types of streams. We then collected a sequence of cores from sediments below the top layer to a depth of about 10 to 15 m and determinedKfor these cores. From the
Kprofiles with depth, we analyzed the distribution trend of
Kwith depth for these two types of streams.
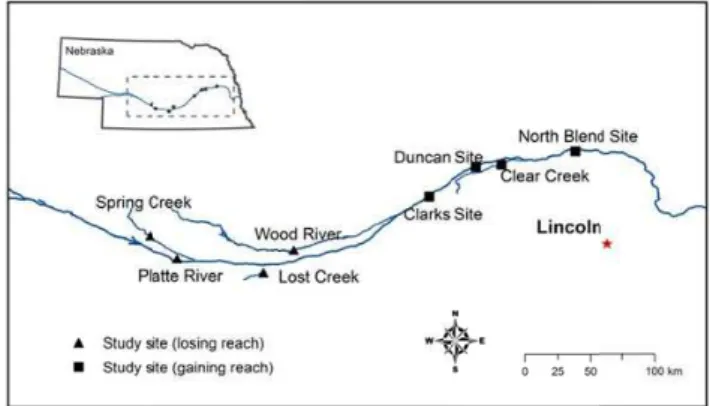
Fig. 1.Location map of eight study sites in south-central and eastern Nebraska. Four study sites were in gaining stream reaches and the other four study sites were in losing stream reaches.
2 Study area and methods
2.1 Study area
2.2 Determination of losing and gaining conditions
Stream water and groundwater temperatures were measured using the Multi-Parameter Testr 35 at four study sites during our field work (the Lost Creek, the Wood River, the Platte River north channel, and the Clear Creek sites). Groundwa-ter temperature here refers to the temperature measured from sediments about 40 to 50 cm beneath the water–sediment in-terface. For a losing reach, the temperatures of stream water and groundwater will be close to each other because stream water infiltrates into the underlying streambed and into the sediments on both sides of the channel, although there will be a time delay of sediment temperature to peak temper-ature in stream water (Silliman et al., 1995). For gaining streams, the water temperature beneath the water–sediment interface is close to the shallow regional groundwater tem-perature and the stream water temtem-perature is higher because of the high atmospheric temperatures in the summer. At the Spring Creek site, stream water and air temperatures were measured. The streambed temperature was not measured. During the field test, the stream water at this site was muddy and deep. The temperature device was not operable for mea-suring streambed temperature. We measured the hydraulic head of the streambed and it was lower than the stream stage, indicating a losing condition. For the three study sites in the eastern Platte River (the sites near Clarks, Duncan and North Bend), we used the results of two groundwater flow models (Wang, 2008; Chen and Ou, 2013) to determine the gaining conditions. Wang (2008) and Chen and Ou (2013) modeled the hydrologic interactions between the Platte River and the aquifer and calculated the baseflow the Platte River received from the aquifer for a period longer than 50 yr.
2.3 Permeameter tests for the streambeds
In this study, an in situ permeameter test method was used to determine the vertical hydraulic conductivityKv of the
top layer of streambed at each site. This in situ method used open-ended tubes to measure the declining rate of water in-side the tube when the water passed through the streambed. This in situ permeameter test is a cost effective method and can be conveniently operated in river channels to deter-mineKvvalues of streambeds while the sedimentary
struc-tures of the tested sediments are very little disturbed. The in situ permeameter test procedures are well documented by Chen (2004) and Genereux et al. (2008). For most of the study sites, 8 to 12 in situ permeameter tests were conducted to determine theKvvalues of the top layer of streambed.
2.4 Sediment coring
We used a Geoprobe direct-push machine to collect sediment cores from the study sites. The Geoprobe direct-push ma-chine has two functions. The first function is that it can gener-ate an electrical conductivity (EC) log of sediments. The EC
values of silt and clay layers are one or two times greater than the EC values of sand and gravel layers due to their difference in mineral composition. Therefore, an EC log can provide the vertical pattern of hydrostratigraphic units very well. During EC logging, a probe was pushed through sediments without the need of a borehole. Thus, this EC logging procedure had a small disturbance to the sediments surrounding the probe. A laptop computer was connected to the Geoprobe system during the logging process and displayed the EC log of the tested streambed on site. The EC logs clearly show the in-terbedded patterns of coarse sediments (medium-coarse sand and gravel) and fine sediments (fine sand and silt/clay).
The second function is that the Geoprobe generates contin-ual sequences of sediment cores. Unconsolidated sediments were sampled into a 1.5 m long tube when the sampler was driven through the streambeds. The coring tube was trans-parent. After the core was brought to the ground surface, the lithological patterns of the streambed sediments were exam-ined at test sites and were cross-checked with the patterns of EC logs. At the study sites, the Geoprobe machine got into the river channel when the access was permitted. Otherwise, coring was conducted at the river banks. At each test site, the first core was collected for the depth of∼0–1.5 m; the
second core was collected from the depth of∼1.5–3 m.
Re-peating the sampling procedure gave a continual sequence of sediment cores. At each test site, an EC log was produced before sediment coring. The EC logging spot and the coring spot were about one meter apart. Chen et al. (2008) provided details of using Geoprobe for EC logging and sediment cor-ing. The sediment cores from the Wood River, Spring Creek, and Clear Creek sites were collected from the bank, about 1 m from the waterline at these test sites. The sediment cores from the other five sites were collected from the river chan-nel. These cores were transported back to the laboratory for conducting falling-head permeameter tests. The in-lab per-meameter test method determinedKv values of these
sed-iment cores from each of the study sites. During the test, the sediments were not repacked and the original sedimen-tary structure was preserved. The in-lab permeameter test method for determining theKvvalues of sediment cores was
described by Chen et al. (2008). After theK values of the cores were determined,Kprofiles with depth were plotted.
3 Results
3.1 Temperature and EC values in stream water and groundwater
The sediment temperatures for four study sites and stream water temperatures for five study sites are shown in Table 1. The sediment temperature was 16◦C in Clear Creek,
mea-sured in August 2011, whereas the stream water tempera-ture was 22.3◦C (see Table 1). The regional groundwater
X. Chen et al.: Gaining and losing stream reaches have opposite hydraulic distribution patterns 2573
Table 1.Temperatures and EC values collected from five study sites.
Test Temperature◦C EC µs cm−1
site Streambed Stream Air Stream Ground sediments water water water Clear Creek 16 22.3 28.5 637 312 Spring Creek NA 22.9 26.5 979 NA Lost Creek 25.5 25.4 31.5 976 384 Wood River 23.6 24 33.1 1360 546 Platte River 26.8 28.9 34.5 824 356 north channel
temperature in Clear Creek was close to the ground water temperature. Thus, Clear Creek was determined to be a gain-ing stream. The sediment temperatures in Wood River, Platte River north channel, and Lost Creek were greater than 20◦C
and close to the stream water temperature (Table 1). They were determined to be losing streams.
The Multi-Parameter Testr 35 was also used to mea-sure the electrical conductivity of the stream water at these study sites. The EC values of stream water were higher than those of groundwater at the four study sites (Ta-ble 1). The EC values in stream water ranged from 637 to 1360 µs cm−1, whereas those in groundwater ranged from
312 to 546 µs cm−1 (see Table 1). The EC value of the
stream water for the Clear Creek site (in a gaining reach) was 637 µs cm−1, and it was lower compared to the EC values of
824–1360 µs cm−1for the four sites in losing reaches.
3.2 Kvfor the top layer of streambeds in losing streams
Streambeds in losing stream reaches often have higher con-tents of fine-grained materials (silt/clay and fine sand) that fill the interstices of coarse-grained sediments (medium-coarse sand and gravel). This can lead to poorly sorted sediments and lower hydraulic conductivities. Visual examination of the sediments reveals the mixed nature of sand/gravel and fine-grained materials. At the Wood River site and the Platte River north channel site, patches of fine-grained sediments, as well as poorly sorted sand and gravel, were observed. These lower permeability silt/clay and fine-sand lenses exist in the chan-nel surface but have not formed a continuous clogging layer. The mixture of the fine-grained sediments with the coarse sediments (medium sand, coarse sand and gravel) is reflected by a wide range of streambed hydraulic conductivities. For example, at the Wood River test site, ten in situ permeame-ter tests were conducted. Four tests encounpermeame-tered silt/clay and fine sand and theirKvvalues are smaller than 0.6 m d−1. The
other six tests were conducted in medium-coarse sand and gravel, and theirKvvalues ranged from 1.4 to 17.1 m d−1,
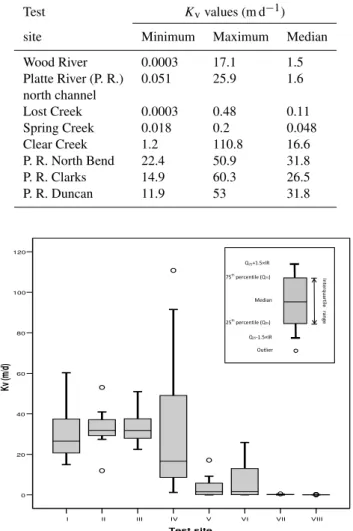
indicating permeable sediments. Table 2 lists the minimum, maximum, and medianKvvalues for the study site. Figure 2
is the box plot showing the distribution of theKvvalues. The
Kvvalues fall in six orders of magnitude.
Table 2.Maximum, minimum, and median values ofKvfrom the
in situ permeameter tests.
Test Kvvalues (m d−1)
site Minimum Maximum Median
Wood River 0.0003 17.1 1.5
Platte River (P. R.) 0.051 25.9 1.6
north channel
Lost Creek 0.0003 0.48 0.11
Spring Creek 0.018 0.2 0.048
Clear Creek 1.2 110.8 16.6
P. R. North Bend 22.4 50.9 31.8
P. R. Clarks 14.9 60.3 26.5
P. R. Duncan 11.9 53 31.8
I II III IV V VI VII VIII Test site
0 20 40 60 80 100 120
Kv (
m/d)
Q75+1.5×IR 75th percentile (Q
75)
25th percentile (Q 25) Median
Q25-1.5×IR Outlier
In
te
rquar
til
e
ran
ge
Fig. 2. Box plot to show the Kv distribution for the eight test
sites. The label on the horizontal axis is designated as follows: I = Platte Clarks, II = Platte Duncan, III = Platte River-North Bend, IV = Clear Creek; V = Wood River, VI = Platte River north channel, VII = Lost Creek, VIII = Spring Creek.
At the Platte River north channel site, five of ten tests en-countered a mixture of fine-grained and coarse-grained sedi-ments and hadKvvalues from 0.05 to 0.56 m d−1. The other
five tests gaveKvvalues from 2.5 to 25.9 m d−1, indicating
high permeability sediments (sand and gravel). TheKv
val-ues fall in four orders of magnitude. The minimum, maxi-mum and medianKvvalues are listed in Table 2. The
dis-tribution of theKvfrom this site is similar to the pattern for
was sieved for grain size analysis. This sample contained 21.2 % fine sand and 1.8 % silt/clay; the rest was medium to coarse sand and gravel. The content of fine particles in this sample was higher than that for samples from the Platte River in the gaining sites (see the results in Sect. 3.3).
The streambeds at the other two sites of losing streams in south-central Nebraska (Lost Creek and Spring Creek) were nearly fully clogged. When the channel is fully silted, a layer of fine-grained sediments covers the channel surface. TheKv
values determined from 10 in situ permeameter tests in Lost Creek ranged from 0.0003 to 0.48 m d−1with a median of
0.12 m d−1. A sediment sample was taken from the spot of a
permeameter test in Lost Creek, and the sample was sieved for grain size analysis. This sample consisted of 56.8 % fine sand and 4 % silt/clay. A sample from another test point con-tained 85.8 % fine sand and 5.5 % silt/clay. This large amount of fine-grained sediments was consistent with the lower per-meability of this streambed.
At the Spring Creek site, the Kv values ranged from
0.018 to 0.2 m d−1, with a median value of 0.048 m d−1
(Ta-ble 2). Generally, whenKvvalues are smaller than 0.1 m d−1,
sediments are not very permeable. At the Wood River and the Platte River north channel sites, 11Kvvalues are greater than
1 m d−1; at the Lost Creek and Spring Creek sites, all of the
Kvvalues are smaller than 1 m d−1. The distribution patterns
ofKvfor the Lost Creek and Spring Creek sites are similar
to each other (see Fig. 2), but differ from the pattern ofKv
for the other two losing stream sites.
3.3 Kvfor the top layer of streambeds in gaining
streams
In contrast, the gaining stream reaches have well sorted and clean sand and gravel in the top layer of streambeds with very small amounts of silt and clay (<1 %). According to Dong et al. (2012), the weight percentage of silt and clay parti-cles (<0.0625 mm) in 14 sediment samples from the Clear Creek site ranged from 0.1 to 1.9 % with an average of 0.6 %. These types of sediments often have hydraulic conductivity values greater than 1 m d−1. For example, in Clear Creek,
theKvvalues determined from 12 in situ permeameter tests
in the streambed in 2010 ranged from 1.2 to 110.7 m d−1
with a median of 16.6 m d−1. At the site to the west of North
Bend, a total of 48 in situ permeameter tests were conducted in 2008 in a 6 by 8 grid with grid spacing of 1.5 m. The
Kv ranged from 22.5 to 50.9 m d−1, with an average value
of 33.3 m d−1 (a median value of 31.8 m d−1). None of the Kvvalues were smaller than 1 m d−1. Eleven in situ
perme-ameter tests were conducted in the Platte River at the Clarks site, and Fig. 2 shows the distribution of these Kv values.
TheKvvalues ranged from 14.9 to 61.3 m d−1 with an
av-erage of 31.3 m d−1. A sediment sample was collected
af-ter each of the 11 permeameaf-ter tests was conducted. Sieving analysis results indicated that the sediments contained trace amounts of silt and clay (<0.2 %) and a small amount of
fine sand ranging from 1.4 to 12.4 % with an average of 6 %. The rest of these sediment samples consisted of medium and coarse sand and some gravel. Fifteen in situ permeameter tests were conducted in the Platte River near Duncan. The
Kvvalues ranged from 11.9 to 53.0 m d−1with an average of
33.0 m d−1. Figure 2 shows the distribution of theseK
v
val-ues. Sieving analysis of the sediment samples from the 15 test spots indicated that the streambed contained fine sand rang-ing from 2.1 to 12.1 % with an average of 4.9 % and had trace amounts of silt and clay (compared to 22.2 % fine sand and 1.8 % silt/clay for the sample in the Platte River north chan-nel site under losing conditions). The rest of these sediment samples contained medium and coarse sand and some gravel. As one can see from these measurements, theKv
measure-ments from the gaining streams had a very narrow range of distribution with high values. Note that the medianKvvalue
for the Platte River north site (losing condition) was only 1.6 m d−1. Comparing to the medianK
vvalues at the Lost
Creek and Spring Creek sites, the medianKv values in the
four gaining condition sites were greater by 3 to 4 orders of magnitude.
TheKvpatterns for the four gaining stream sites, as shown
in the box plot of Fig. 2, are very similar to each other, partic-ularly for the three sites from the Platte River (Clarks, Dun-can, and west of North Bend). TheKv patterns for the four
gaining stream sites differ very much from the patterns for the four losing stream sites.
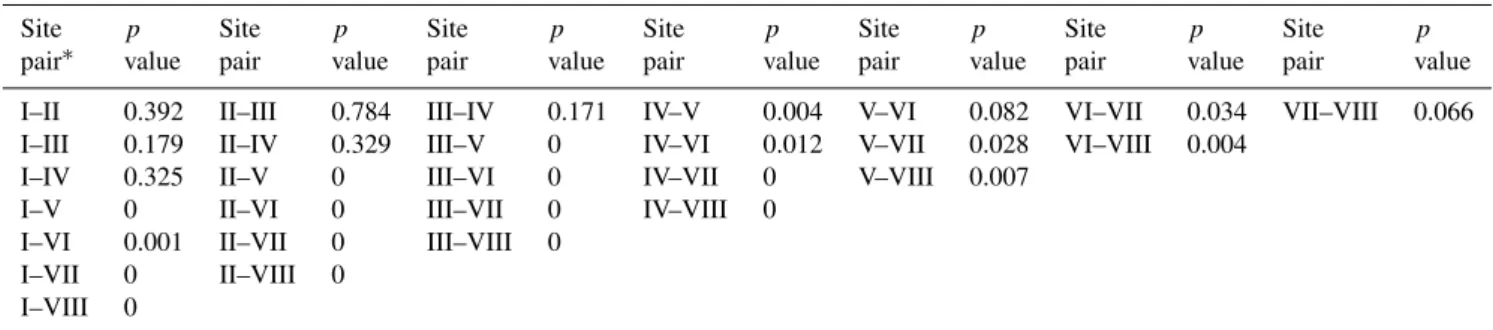
The Kruskal–Wallis test was used to determine whether the Kv values from any two test sites belong to the same
population. This analysis was performed using the statistical function in MATLAB. For this statistical analysis, the null hypothesis was that all samples were drawn from the same population, and the program returnedpvalues. If thepvalue was near zero, it rejected the hypothesis and indicated that at least the median value of one group ofKvvalues was
signifi-cantly different from the other. Whenp >0.05 (or at the con-fidence level of 95 %), it accepted the null hypothesis that the two sets ofKvvalues were drawn from the same population.
Thepvalues for the Kruskal–Wallis test are summarized in Table 3.
Thesep values indicate thatKv from any test site of the
gaining streams differ from Kv from any single site of the
losing streams. In the four gaining stream sites, theKv
val-ues were drawn from the same population. Among the four losing stream sites, theKv values from the Lost Creek and
Spring Creek sites were drawn from the same population; the
Kvvalues from the Wood River and Platte River north
chan-nel sites were drawn from the same population. However,Kv
values from the former two sites statistically differ from the
Kvvalues of the latter two sites. Although the four sites were
X. Chen et al.: Gaining and losing stream reaches have opposite hydraulic distribution patterns 2575
Table 3.pvalues from the Kruskal–Wallis test for comparison of the similarity ofKvvalues between two test sites. Whenpvalue is>0.05,
the similarity is statistically significant.
Site p Site p Site p Site p Site p Site p Site p
pair∗ value pair value pair value pair value pair value pair value pair value
I–II 0.392 II–III 0.784 III–IV 0.171 IV–V 0.004 V–VI 0.082 VI–VII 0.034 VII–VIII 0.066
I–III 0.179 II–IV 0.329 III–V 0 IV–VI 0.012 V–VII 0.028 VI–VIII 0.004
I–IV 0.325 II–V 0 III–VI 0 IV–VII 0 V–VIII 0.007
I–V 0 II–VI 0 III–VII 0 IV–VIII 0
I–VI 0.001 II–VII 0 III–VIII 0
I–VII 0 II–VIII 0
I–VIII 0
∗I = Platte River-Clarks, II = Platte River-Duncan, III = Platte River-North Bend, IV = Clear Creek; V = Wood River, VI = Platte River north channel, VII = Lost Creek, VIII = Spring
Creek.
Dt
h
(
)
0 1.5 3 4.5 6 7.5 9 10.5 12 13.5
0.00001
D
ep
th
(
m
)
1.5 3 4.5 6 7.5 9 10.5 12 13.5 15 16.5 18
0.001
Depth (m)
0.001
Kv(m/
Lost Creek
0.01 0.1
Kv(m/d
Wood Riv 0.1
d)
1 10 1
d)
ver
10
0 1.5 3 4.5 6 7.5 0
Depth (m)
100 1.5
3 4.5 6 7.5 9 10.5 12 13.5 0.0
Depth (m)
0.01 0.1
K
Platte Riv north chan
00010.001 0.0
K
Sp
1 10
Kv(m/d)
ver nnel
1 0.1 1
K
v(m/d)
pring Creek
0 100
10 100
Fig. 3.Distribution ofKvwith depth in losing streams for four study
sites in the Platte River north channel, Wood River, Spring Creek, and Lost Creek of south-central Nebraska.
3.4 Kvprofiles for losing streams
Kv determined from each sediment core generated by the
Geoprobe was plotted vs. depth. Thus, oneKv profile was
produced for each test site. Figure 3 shows theKvprofiles
for the four losing stream sites in south-central Nebraska. All of theKvprofiles show an increasing trend with depth
(Fig. 3). In Lost Creek, the streambed sediment at the depth interval of∼0–1.5 m has a lowKvvalue of 0.00008 m d−1,
and theKvvalues increase to 0.0012 and 0.09 m d−1 in the
next two depth intervals. The fiveKvvalues below the depth
of 4.5 m fluctuate in a constant range, and they do not show
an increasing or decreasing trend. We interpret that the filtra-tion of fine particles reached a depth of about 4.5 m in this small creek. The surface water width across Lost Creek was about 2.7 m in July 2011 during the field work, and the wa-ter depth was only 15 cm. These cores were taken from the channel.
At the Platte River north channel site, the fiveKv values
show an increasing trend with the depth. These five cores were taken from the unconsolidated sediments. The sedi-ments beneath the depth of 7.5 m are an aquitard that is ex-tensively distributed in this region and separates the uncon-solidated Quaternary sediments from the Tertiary Ogallala Group (Chen et al., 2008). Compared to Lost Creek, the over-allKv values in the Platte River are much greater, but the
decreasing trend is the same at the two sites.
For the Wood River and Spring Creek sites, the Geoprobe coring was conducted on the river banks. The river banks were about 1 to 1.5 m above the water. Thus, the first sedi-ment cores at the two sites were collected from unsaturated bank material, and theKvvalues for the two cores were not
included for the analysis. The twoKvprofiles at the Wood
River and Spring Creek sites show increasing trends. For the Wood River site, an increasing trend is shown for the depth of 1.5 to 16.5 m. The channel width and water depth were 6.9 and 16 cm, respectively. An increasing trend ofKvwith
depth is also clear at the Spring Creek site (Fig. 3). The chan-nel width and water depth were 4.6 and 74 cm, respectively.
For each of the four test sites, theKv values for the top
five sediment cores already indicate a decreasing trend with depth. Table 4 summarizes the minimum, maximum, and me-dian Kv values for the top five cores. The minimum and
median values for the Wood River, Lost Creek and Spring Creek sites are all smaller than 0.5 m d−1, indicating
low-permeability sediments. The minimum and median values from the Platte River north channel site are much higher. This suggests that in permeable streambeds, a decreasing trend of
Kvwith depth can still form when the stream is under losing
Depth (m) 1.5 3 4.5 6 7.5 9 10.5 0.1 Depth (m) 0 1.5 3 4.5 6 7.5 9 0.001 0 Depth (m ) 1
Kv(m/d
Cl
0.01 0.1
Kv(m/
10 10
d)
lear Creek
1 10 10
/d) Duncan 00 0 1.5 3 4.5 6 7.5 9 10.5 Depth (m) 00 1.5 3 4.5 6 7.5 9 10.5 12 Depth (m) 0 5 3 5 6 5 9 5 0.001 0.01 K 5 3 5 6 5 9 5 2 0.01 0.1 K 0.1 1
Kv(m/d)
Clark
1 10
Kv(m/d)
wes North 10 100 ks 0 100 st of h Bend
Fig. 4.Distribution ofKv with depth in gaining streams for four
study sites in eastern Nebraska. Three study sites were located in the Platte River; the other site was located in Clear Creek.
3.5 Kvprofile for gaining streams
In gaining streams, theKvprofiles show a decreasing trend
with depth (Fig. 4). The cores were taken from the middle of the Platte River at the Clarks and Duncan sites in 2005 when this segment of the Platte River was nearly drying up (Chen et al., 2008). For the site west of North Bend, cores were taken from exposed streambed in 2008; at the site of Clear Creek, cores were taken from a very flat bank. Thus, the first cores at the two sites were not plotted into theKv
profiles for this trend analysis. In this analysis, only cores taken under the water table were used. When the sediments are above the water table, the hydrodynamics of the losing or gaining process no longer has an impact on the exposed sediments.
At the Clear Creek site, the sixKvvalues for the depth of
∼1.5–9 m show a decreasing trend. TheKvwas 57.5 m d−1
for the ∼1.5–3 m depth; it decreased to 1.4 m d−1 at the
depth of 9 m. At the Clarks site on the Platte River, the eight
Kv values decreased from 26.5 m d−1 from the ∼0–1.5 m
depth to 0.01 m d−1at the depth of
∼9–10.5 m. At the
Dun-can site of the Platte River, the streambed sediment at∼0–
1.5 m depth had a highKvvalue of 61.4 m d−1; theKvvalue
became 0.3 m d−1at the 9 to 10.5 m depth. At the site of west
of North Bend, the decreasing trend ofKvis also clear. The
core for the∼3–4.5 m depth was missing at this site, and
itsKv value was not available. However, this did not affect
the determination of the decreasing trend ofKv. The sixKv
Table 4.Maximum, minimum, and median values ofKvfrom the
top five sediment cores at each test site.
Test Kvvalues (m d−1)
site Minimum Maximum Median
Wood River 0.001 1.3 0.34
Platte River (P. R.) 2.54 34.5 8.2
north channel
Lost Creek 0.00008 1.3 0.009
Spring Creek 0.0008 10 0.01
Clear Creek 5.6 57.5 19.3
P. R. North Bend 0.72 16.9 1.9
P. R. Clarks 0.01 26.6 5.6
P. R. Duncan 0.83 61.4 13.9
values decreased from 16.9 m d−1in the top to 0.4 m d−1in
the bottom of the profile. The minimum, maximum, and me-dian ofKv values for the top five cores are summarized in
Table 4.
4 Discussion
As discussed in the introduction section, physical, chemical, and biological processes are typically involved in streambed clogging processes. This study was not aimed at separating the three major clogging processes at the four study sites un-der losing conditions. We will mainly interpret Kv spatial
distribution patterns in losing streams and relate the patterns to filtration processes. The reducedKv in these four losing
study sites was probably the combined effects of the physi-cal, chemical and biological processes.
4.1 Hydrodynamic effects
X. Chen et al.: Gaining and losing stream reaches have opposite hydraulic distribution patterns 2577
for the clogging process. When the infiltrated water passes through the water–sediment interface and moves further into a depth, the concentration of suspended fine particles in the water reduces gradually. The degree of siltation due to the deposits of clay and colloids then decreases at a larger depth. This water infiltration process in losing segments produces streambeds that contain less fine materials at greater depth and causes less alteration of the originalKin the coarse sed-iments. Laboratory observation suggested that the fine parti-cle penetration is in a limited thickness (for example, less than 50 cm). Although our field investigation was not de-signed to detect the penetration depth of the clogging pro-cess, theKvpatterns from the study sites probably indirectly
indicate that the streambed hydraulic conductivity can be af-fected to the depth greater than 5 m. Lateral water filtration toward the stream banks can also clog the originally coarse sediments and form a low-permeability zone below the bank. The cores from the Spring Creek and Wood River sites were collected from the bank. The decreasing trend ofKvin the
sediments below the river bank at these two sites was be-lieved to be formed by lateral and downward infiltration pro-cesses under the losing conditions.
The magnitude ofKvvalues can reflect the clogging
de-gree of the streambed and the penetration depth of the fine particles into the streambed. Among the four test sites under losing conditions, the smallest Kv value of 0.00008 m d−1
occurred in the top layer of the streambed in Lost Creek whereas the relatively highKvvalue of 2.5 m d−1occurred in
the top layer of the Platte River north channel. According to the results of the in situ permeameter tests, we believe that the streambed at the Platte River north channel site and the Wood River site are under partially clogged conditions (or interme-diate clogging), whereas the Lost Creek and Spring Creek sites are reaching the completely clogged stage and the chan-nels at the two sites are covered by fine materials (silt and clay). In the intermediate stage, the streambed sediments are characterized by patchy distribution of silt/clay and fine-sand lenses and display a big spatial variation in streambedKv
val-ues. For example, in the Platte River north channel, the great-estKvvalue is about four orders of magnitude higher than
the smallestKvvalue in the upper layer of the streambed.
Under the completely clogged condition, the streambed sedi-ments are nearly fully covered by mostly low permeable sed-iments, e.g.,Kvvalues in Lost Creek streambed were mostly
(eight out of tenKvvalues) less than 1 m d−1, ranging from
0.00008 to 2.4 m d−1.
Additionally, we can see from theKvprofiles in Fig. 4 that
relatively largerKvvalues (greater than 1 m d−1) mostly
oc-cur at∼5–10 m depth in the losing streams. TheKvvalues
for the alluvial aquifer in the study area (Chen et al., 2010) ranged commonly from 1 to 10 m d−1. Therefore, we
specu-late that the maximum depth of clogging processes into the streambeds may be∼5–10 m. This depth is in accordance
with the modeling results of Chen (2007) that the infiltration depth of stream water in the streambed was about 8 m.
In gaining streams, the opposite Kv distribution pattern
can be attributed to the upward hydrodynamic condition: groundwater feeding the streambed by upward seepage. Un-der the upward flow conditions, fine particles that are strained between coarse particles, colloids, or algae become sus-pended, are lifted out of the streambed and then winnowed by the stream flow. With the disappearance of the fine parti-cles, the sediments in the upper layer of streambeds become more unconsolidated and permeable than those in the lower layer. This furthermore results in greaterKvvalues in the
up-per layers (Fig. 4). Genereux et al. (2008) suggested that ero-sion and deposition are two processes that alter the hydraulic conductivity of streambeds and lead to temporal variations of streambedK values. However, the effect of erosion and deposition processes is likely limited to the shallow part of streambeds, and it is not able to impact a large depth (for ex-ample, several meters) in small streams where stream flow rate is generally low.
4.2 Chemical effects through the deposition of the colloidal particles
The deposition of colloidal particles in a porous medium is relevant in siltation of streambeds (Packman et al., 2000a). Liu et al. (1995) reported that solution ionic strength influ-ences the dynamics of colloidal deposition and transport in heterogeneous porous media. A rise in ionic strength will be beneficial for the deposition of colloidal particles. The ionic strength of a solution can be expressed as (Eby, 2004)
I = 1
2
X
miz2i, (1)
wheremi is the moles per liter of ioniandziis the charge of ioni. Ionic strength is approximately proportional to electri-cal conductivity.
According to the field measurements, the electrical con-ductivity of water in streambed sediments is smaller than those in stream water at each site (Table 1). In gaining streams, when stream water is fed by groundwater with a low EC value, the EC value in stream water decreases in up-welling zones. Thus, the ionic strength is reduced. This de-crease can result in the inde-crease of the mobility of colloidal particles and prevent them from deposition in the channel surface. This furthermore contributes to the greaterKv
5 Conclusions
We investigated streambed hydraulic conductivity in losing streams and in gaining streams. We first measured streambed
Kv in the top layers of the channel sediments from eight
study sites, four sites under losing conditions and the other four sites under gaining conditions; we then determined the
Kvdistribution of the streambed in a vertical profile at each
test site.
We compared the hydraulic conductivity in the top lay-ers of streambeds. In gaining streams, the streambeds con-sisted mainly of sand and gravel and were very permeable. TheKvvalues were generally greater than 1 m d−1, and in
the range of 1 to 100 m d−1. The median K
v values from
the Platte River with gaining conditions were greater than 33 m d−1. However, the medianK
vvalue for the Platte River
for the losing condition was only about 1.5 m d−1. In the
los-ing streams, the streambed consisted mainly of fine sand, silt and clay if the channel was nearly fully silted, and consisted of poorly sorted sand and gravel which contained silt and clay lenses. The hydraulic conductivities were often smaller than 1 m d−1and could be as small as 0.001 m d−1. Statistical
analyses indicated that theKvvalues from the four sites
un-der losing stream conditions are significantly different from theKvvalues from the four sites under gaining stream
con-ditions. Among the four sites under losing stream conditions, theKvvalues from the Lost Creek and Spring Creek sites are
significantly different from theKvvalues from the other two
sites. This difference probably reflects that the clogging level in the former two sites differs from that in the latter two sites. The vertical Kv profiles show two opposite vertical
dis-tribution patterns between the two types of streams. In the losing streams, Kv increased downward from the channel
surface to depth of about 5 to 10 m. This pattern resulted from physical, chemical and biological clogging mecha-nisms. Fine-grained material likely deposited in the pores in the top layers of the streambed. Less fine-grained mate-rial became available when the water migrated further down-ward. In the gaining streams,Kvvalues showed a decreasing
trend. The upward flux suspended sediments, enhanced the pore spacing and elevated theKvvalues in the top layers of
the streambed. These mechanisms for elevatingKv became
less effective at a larger depth.
Original depositional environments controlled largely the framework of sediment materials and thus affected the over-all hydraulic conductivity of the sediments. However, post-depositional environments such as stream–groundwater ex-change can relocate fine materials, induce chemical and bio-logical processes, and eventually alter the original hydraulic conductivity. This post-depositional process has a very sig-nificant role in changing the magnitude ofKv, and the
alter-ation inKvcan reach several orders of magnitude.
Acknowledgements. The study was funded by the Central Platte, Tribasin, Upper Big Blue, and Lower Platte North Natural Re-sources Districts of Nebraska. The analysis was also partially supported by the National Natural Science Foundation of China (project no. 41072183). Matt Marxsen and Dan Sullivan oper-ated the Geoprobe for EC logging and sediment coring of the streambeds.
Edited by: M. Gooseff
References
Banzhaf, S., Krein, A., and Scheytt, T.: Investigative approaches to determine exchange processes in the hyporheic zone of a low permeability riverbank, Hydrogeol. J., 19, 591–601, doi:10.1007/s10040-011-0707-4, 2011.
Bouwer, H.: Artificial recharge of groundwater: hydrogeology and engineering, Hydrogeol. J., 10, 121–142, 2002.
Chen, X. H.: Streambed hydraulic conductivity for rivers in south-central Nebraska, J. Am. Water Resour. Assoc., 40, 561–574, 2004.
Chen, X. H.: Hydrologic connections of a stream-aquifer-vegetation zone in south-central Platte River valley, Nebraska, J. Hydrol., 333, 554–568, 2007.
Chen, X. H.: Depth-dependent hydraulic conductivity distribu-tion patterns of a streambed, Hydrol. Process., 25, 278–287, doi:10.1002/hyp.7844, 2011.
Chen, X. and Chen, X. H.: Stream water infiltration, bank stor-age, and storage zone changes due to stream-stage fluctuations, J. Hydrol., 280, 246–264, doi:10.1016/S0022-1694(03)00232-4, 2003.
Chen, X. H., Burbach, M., and Cheng, C.: Electrical and hydraulic vertical variability in channel sediments and its effects on stream-flow depletion due to groundwater extraction, J. Hydrol., 352, 250–266, 2008.
Chen, X. H., Song, J., and Wang, W.: Spatial variability of specific yield and vertical hydraulic conductivity in a highly permeable alluvial aquifer, J. Hydrol., 388, 379–388, doi:10.1016/j.jhydrol.2010.05.017, 2010.
Chen, X. and Ou, G.: Development of Groundwater Flow Model for the Lower Platte North Natural Resources District Area, Ne-braska, University of Nebraska-Lincoln, Lincoln, NE, USA, Un-published Report, p. 110, 2013.
Cui, Y. T., Wooster, J. K., Baker, P. F., Dusterhoff, S. R., Sklar, L. S., and Dietrich, W. E.: Theory of fine sediment infiltration into immobile gravel bed, J. Hydraul. Eng., 134, 1421–1429, 2008. Davis Jr., R. A.: Depositional systems-A Genetic Approach to
Sed-imentary Geology, Prentice-Hall, INC., Englewood Cliffs, New Jersey, p. 669, 1983.
Dong, W. H., Chen, X. H., Wang, Z. W., Ou, G. X., and Liu, C.: Comparison of vertical hydraulic conductivity in a streambed-sand bar system of a gaining stream, J. Hydrol., 450–451, 9–16, 2012.
Eby, G. N.: Principles of Environmental Geochemistry, Brooks/Cole – Thomson Learning, Pacific Grove, Califor-nia, p. 514, 2004.
X. Chen et al.: Gaining and losing stream reaches have opposite hydraulic distribution patterns 2579
Frostick, L. E., Lucas, P. M., and Reid, I.: The infiltration of fine matrices into coarse- grained alluvial sediments and its implica-tions for stratigraphical interpretation, J. Geol. Soc., 141, 955– 965, 1984.
Genereux, D. P., Leahy, S., Mitasova, H., Kennedy, C. D., and Cor-bett, D. R.: Spatial and temporal variability of streambed hy-draulic conductivity in West Bear Creek, North Carolina, USA, J. Hydrol., 358, 332–353, 2008.
Gerecht, K. E., Cardenas, M. B., Guswa, A. J., Sawyer, A. H., Nowinski, J. D., and Swanson, T. E.: Dynamics of hy-porheic flow and heat transport across a bed-to-bank contin-uum in a large regulated river, Water Resour. Res., 47, W03524, doi:10.1029/2010WR009794, 2011.
Gooseff, M. N., Anderson, J. K., Wondzell, S. M., LaNier, J., and Haggerty, R.: A modelling study of hyporheic exchange pattern and the sequence, size, and spacing of stream bedforms in moun-tain stream networks, Oregon, USA, Hydrol. Process., 20, 2443– 2457, 2006.
Gunkel, G. and Hoffmann, A.: Clogging processes in a bank filtra-tion system in the littoral zone of Lake Tegel (Germany), in: the Proceedings of 5th International Symposium on Management of Aquifer Recharge, 10–16 June 2005, Berlin, Germany, 599–604, 2006.
Hancock, P. J.: Human impacts on the stream–groundwater ex-change zone, Environ. Manage., 29, 763–781, 2002.
Hiscock, K. M. and Grischek, T.: Attenuation of groundwater pol-lution by bank filtration, J. Hydrol., 266, 139–144, 2002. Karwan, D. L. and Saiers, J. E.: Hyporheic exchange and
streambed filtration of suspended particles, Water Resour. Res., 48, W01519, doi:10.1029/2011WR011173, 2012.
Liu, D., Johnson, P. R., and Elimelech, M.: Colloid deposition dy-namics in flow through porous media: role of electrolyte concen-tration, Environ. Sci. Technol., 29, 2963–2973, 1995.
Packman, A. I., Brooks, N. H., and Morgan, J. J.: Kaolinite ex-change between a stream and streambed: Laboratory experiments and validation of a colloid transport model, Water Resour. Res., 36, 2363–2372, 2000a.
Packman, A. I., Brooks, N. H., and Morgan, J. J.: A physicochem-ical model for colloid exchange between a stream and a sand stream bed with bed forms, Water Resour. Res., 36, 2351–2361, 2000b.
Rehg, K. J., Packman, A. I., and Ren, J.: Effects of suspended sed-iment characteristics and bed sedsed-iment transport on streambed clogging, Hydrol. Process., 19, 413–427, 2005.
Ren, J. and Packman, A. I.: Effects of background water compo-sition on stream-subsurface exchange of submicron colloids, J. Environ. Eng., 128, 624–634, 2002.
Rosenberry, D. O. and Pitlick, J.: Effects of sediment transport and seepage direction on hydraulic properties at the sediment– water interface of hyporheic settings, J. Hydrol., 373, 377–391, doi:10.1016/j.jhydrol.2009.04.030, 2009a.
Rosenberry, D. O. and Pitlick, J.: Local-scale variability of seepage and hydraulic conductivity in a shallow gravel-bed river, Hydrol. Process., 23, 3306–3318, 2009b.
Schubert, J.: Hydraulic aspects of riverbank filtration-field studies, J. Hydrol., 266, 145–161, 2002.
Song, J. X., Chen, X. H., Cheng, C., Summerside, S., and Wen, F. J.: Effects of hyporheic processes on streambed vertical hydraulic conductivity in three rivers of Nebraska, Geophys. Res. Lett., 34, L07409, doi:10.1029/2007GL029254, 2007.
Silliman, S. E., Ramirez, J., and McCabe, R. L.: Quantifying down-flow through creek sediments using temperature time series: one-dimensional solution incorporating measured surface tempera-ture, J. Hydrol., 167, 99–119, 1995.
Stuyfzang, P. J., Juhasz-Holterman, M. H. A., and de Lange, W. J.: Riverbank filtration in the Netherlands: well fields, clogging and geochemical reactions, in: Riverbank Filtration Hydrology, Impacts on System Capacity and Water Quality, NATO Science Series IV, edited by: Hubbs, S. A., Springer, 119–153, 2006. Wang, D.: Impacts of Water Pumping on Base Flow Trends in
Selected Streams of Nebraska (Master’s Thesis), University of Nebraska-Lincoln, Lincoln, NE, USA, p. 222, 2008.