Mutation Generated the Background Primary-Structural
Heterogeneities along Vertebrate Chromosomes
Marcos A. Antezana1*, I. King Jordan2
1Department of Ecology and Evolution, University of Chicago, Chicago, Illinois, United States of America,2Georgia Institute of Technology, Atlanta, Georgia, United States of America
Abstract
The content of guanine+cytosine varies markedly along the chromosomes of homeotherms and great effort has been
devoted to studying this heterogeneity and its biological implications. Already before the DNA-sequencing era, however, it was established that the dinucleotides in the DNA of mammals in particular, and of most organisms in general, show striking over- and under-representations that cannot be explained by the base composition. Here we show that in the coding regions of vertebrates both GC content and codon occurrences are strongly correlated with such ‘‘motif preferences’’ even though we quantify the latter using an index that is not affected by the base composition, codon usage, and protein-sequence encoding. These correlations are likely to be the result of the long-term shaping of the primary structure of genic and non-genic DNA by a regime of mutation of which central features have been maintained by natural selection. We find indeed that these preferences are conserved in vertebrates even more rigidly than codon occurrences and we show that the occurrence-preference correlations are stronger in intronic and non-genic DNA, with the R2s reaching
99% when GC content is,0.5. The mutation regime appears to be characterized by rates that depend markedly on the bases present at the site preceding and at that following each mutating site, because when we estimate such rates of neighbor-base-dependent mutation (NBDM) from substitutions retrieved from alignments of coding, intronic, and non-genic mammalian DNA sorted and grouped by GC content, they suffice to simulate DNA sequences in which motif occurrences and preferences as well as the correlations of motif preferences with GC content and with motif occurrences, are very similar to the mammalian ones. The best fit, however, is obtained with NBDM regimes lacking strand effects, which indicates that over the long term NBDM switches strands in the germline as one would expect for effects due to loosely contained background transcription. Finally, we show that human coding regions are less mutable under the estimated NBDM regimes than under matched context-independent mutation and that this entails marked differences between the spectra of amino-acid mutations that either mutation regime should generate. In the Discussion we examine the mechanisms likely to underlie NBDM heterogeneity along chromosomes and propose that it reflects how the diversity and activity of lesion-bypass polymerases (LBPs) track the landscapes of scheduled and non-scheduled genome repair, replication, and transcription during the cell cycle. We conclude that the primary structure of vertebrate genic DNA at and below the trinucleotide level has been governed over the long term by highly conserved regimes of NBDM which should be under direct natural selection because they alter drastically missense-mutation rates and hence the somatic and the germline mutational loads. Therefore, the non-coding DNA of vertebrates may have been shaped by NBDM only epiphenomenally, with non-genic DNA being affected mainly when found in the proximity of genes.
Citation:Antezana MA, Jordan IK (2008) Highly Conserved Regimes of Neighbor-Base-Dependent Mutation Generated the Background Primary-Structural Heterogeneities along Vertebrate Chromosomes. PLoS ONE 3(5): e2145. doi:10.1371/journal.pone.0002145
Editor:Justin O. Borevitz, University of Chicago, United States of America
ReceivedSeptember 20, 2007;AcceptedMarch 17, 2008;PublishedMay 14, 2008
Copyright:ß2008 Antezana, Jordan. This is an open-access article distributed under the terms of the Creative Commons Attribution License, which permits unrestricted use, distribution, and reproduction in any medium, provided the original author and source are credited.
Funding:The authors have no support or funding to report.
Competing Interests:The authors have declared that no competing interests exist.
* E-mail: [email protected]
Introduction
In mammals and birds, the amino-acid composition of proteins and the relative occurrence of synonymous codons in coding regions covary strongly with the GC content of the chromosomal regions in which genes are embedded (see reviews by Bernardi [1,2]. However, upon closer examination GC content loses much of its explanatory appeal. Already Jukes and King [3], e.g., wondered why the occurrence of the amino acid Arginine in mammalian genes departs drastically from that expected given the GC content of genes; and more recently, Antezana and Kreitman [4] pointed out that explanations invoking GC content or G-vs.-C
content cannot account for the fact that from E.coli to yeast, Drosophila, and mammals, the most frequent synonymous codon in each 4fold-degenerate codon family is often the same despite its switching across families from G-ending to C-ending. Therefore explanations invoking GC content effects in particular, and base-composition effects in general, cannot account for important primary-structural features of mammalian and avian coding regions.
preferences for nucleotide motifs may explain the occurrence of several codons and the SC usage in the human and viral genes available then [5,6,7]. Nussinov’s work followed the discovery in the early 60 s that dinucleotide occurrences are often remarkably non-random in most genomes (tabulated by Setlov [8]. Nussinov introduced the use of randomizations of the placement of SCs along coding regions to estimate the statistical over-/under-representation across successive codons of di- and tri-nucleotide motifs, a randomization that does not allow the base composition, the amino acid content and sequence, and the SC usage to affect the estimates. Antezana and Kreitman [4], unfortunately unaware of Nussinov’s work, developed independently the same randomiza-tion and used it to show that inD.melanogasterthe motifs of the most common SCs are over-represented across codons relative to those of the rarest SCs. To the best of our knowledge, all related work between Nussinov’s and Antezana and Kreitman’s relied on motif preferences that could be influenced by base and codon composition as well as by the amino-acid composition and sequence of encoded proteins, despite the otherwise remarkable applied-mathematical sophistication deployed at times. Karlin and Mrazek [9], e.g., ‘‘predicted’’ whole-genome codon occurrences in humans on the basis of thewithin-codonoccurrence of 12_, _23, and 1_3 dinucleotides and of the base composition at each codon position, quantities that obviously can be affected strongly by protein encoding and mRNA translatability (123 being a codon with its three positions labelled by the numbers 1, 2, and 3).
Here we expand on Antezana and Kreitman’s explanation for the phylogenetically conserved alternation of G- and C-ending codons as most-frequent SC in 4fold-degenerate codon families, and show that in vertebrates in general across-codon trinucleotide preferences correlate positively, linearly, and strongly with the whole-genome occurrence of SCs, of non-stop codons in general and, less markedly, with that of encoded amino acids, and we also show that these preferences are very similar across vertebrate genomes, to the point of being almost identical in mammals andGallus. Furthermore, we show that the GC content of non-genic, intronic, and coding DNA correlates positively, linearly, and with astounding 94%+R2s with the balance between the motif preferences for TA-rich motifs and those for GC-rich ones. This correlation –which was observed in the coding DNA of every warm- and cold-blooded vertebrate we could examine– indicates that the forces behind motif preferences vary drastically along chromosomes, generating GC content heterogene-ity as a side effect (for neither motif preferences nor this motif-preference-derived GCvsAT ‘‘balance’’ can be influenced by base composition).
We then show that the trinucleotide preferences, the preference-occurrence correlations, and the trinucleotide preference-occurrences them-selves, as well as the correlation between GC content and the GCvsAT balance must be to a great extent the product of mutation rates that depend strongly on the bases present at the site preceding and the site following each mutating site. Indeed i) we find very similar motif preferences in non-genic and intronic DNA, which indicates strongly that motif preferences are the product of mutation pressure and genetic drift shaping coding and non-coding DNA alike; and ii) we recreate to a great extent the native occurrences and preferences, the native occurrence-preference correlations, and the native correlations between GC content and the GCvsAT balance, by bringing DNA sequences to equilibrium under regimes of neighbor-base-dependent mutation (NBDM) that we estimate from substitutions retrieved from alignments of non-genic, intronic, and coding mammalian DNA that were sorted and grouped by GC content.
Finally, and perhaps most importantly in terms of ultimate molecular-evolutionary causation, we show computationally that
these empirically estimated regimes of NBDM generate in mammalian coding regions a spectrum of non-synonymous point mutations that is qualitatively and quantitatively drastically different from that which their matched –but counterfactual– mutation regimes lacking context-dependence would generate. Therefore NBDM may actually be a major determinant of individual fitness in vertebrates because it may reduce markedly the somatic and germline mutational loads entailed by non-synonymous point mutations, where the rigid phylogenetic conservation of motif over-/under-representations in genic DNA across cold- and warm-blooded vertebrates alike indicates that NBDM is also rigidly conserved in vertebrates and that load challenges due to non-synonymous mutations may be very similar.
Materials and Methods
Coding-region data
We relied primarily on vertebrate coding-region sequences (CDSs) available from the ENSEMBL website. The CDSs of the sea squirt Ciona intestinalis were downloaded from the DOE Joint Genome Institute’s website. All results with the human CDSs from ENSEMBL were confirmed i) in a dataset of 13,000 human genes for which transcripts are known (kindly provided by A. Urrutia), and ii) in a dataset of 12,717 human CDSs with known mouse homologues [10]. We also took advantage of a dataset with 2,165 aligned homologous coding regions from human, mouse, and rat [11]. TheDrosophila melanogasterCDSs were also from ENSEMBL and theDrosophila pseudoobscuraCDSs were downloaded from the FLYBASE website. In some plots we included results for 90 ribosomal-protein genes which were also retrieved from ENSEMBL
Codon occurrences
‘‘Whole-genome’’ codon frequencies were calculated by dividing the number of times each codon appears in all genes in a genome by the total number of codons in all genes in the same genome, excluding stop-codons. Whole-genome SC frequencies were com-puted by dividing the total number of each synonymous codon by the total number of codons belonging to the same SC family (the three 6fold-degenerate families were analyzed both as single families and by separating each family into a 2fold-degenerate subfamily and a 4fold-degenerate subfamily). Whole-genome amino acid frequen-cies were computed by dividing the total number of codons for each amino acid by the total number of all codons.
Base-composition predictions of occurrences
In several instances we compared empirical motif and codon occurrences to predictions derived from base composition. We mainly focussed on predictions that assume a single base composition that we estimated numerically by checking every possible base composition (with granularity 0.001) as to its ability to minimize the sum of the absolute values of the differences between predicted and observed occurrences. We did not use occurrence predictions that assume a different base composition at the 1st-, 2nd-, and 3rd-codon position, predictions that albeit attractive in terms of fitting potential are biologically absurd since they require a mechanism that lets DNA sequences mutate differently at the three codon positions.
Non-genic DNA
We took advantage of 4,677 alignments covering a total of 9.78Mb of human, chimp, and baboon non-coding DNA curated by Julien Meunier [12]. These sequences contain no exons from known gene and therefore are likely to consist mainly of non-genic DNA. For this reason we will take the liberty of referring to them
as ‘‘non-genic’’. Runs of three or more identical trinucleotides were ignored. We also used the whole-genome dinucleotide proportions tabulated in Setlov [8] that had been measured until that time by several workers.
Intronic DNA
We used a dataset of 53,792 segments of human introns that was curated and kindly provided by Fyodor Kondrashov to IKJ [13]. And we also used a dataset of aligned intron segments from humans, chimp, and macaque covering all chromosomes except for the X and the Y. This dataset was generated by IKJ as follows: Homologous intronic regions from human, chimpanzee, and macaque were identified in the multiple-sequence alignments of sixteen vertebrate genome assemblies to the human genome reference sequence hg18 (NCBI build 36.1) provided by the UCSC Genome Browser (http://genome.ucsc.edu/ [14,15]. The whole-genome multiple-sequence alignments were assembled using the Multiz tool [16]. Intron coordinates were taken from the Known Genes track of the UCSC Table Browser, which stores the most reliable gene-model data from the Uniprot and Refseq databases. As it was the case for non-genic DNA, runs of three or more identical trinucleotides were ignored.
Estimation of across-codon motif preferences in a single gene
The across-codon over-/under-representation of (‘‘preference for’’) each nucleotide motif in a given coding region was quantified by comparing the number of appearances of the motif in the two non-coding frames of the gene (i.e., its ‘‘count’’, e.g., GC|A+G|CA, where ‘‘|’’ is the codon boundary) to the distribution of the same count in 1000 sequences of the gene in which the gene’s codons were placed randomly and without replacement at any location in the original sequence at which the amino acid they encode is encoded. The motif preferences obtained from this randomization of the location of confamilial SCs are therefore independent from, and unaffected by, those properties of the coding region that are kept constant during the randomization, i.e., the base, codon, and amino acid composi-tions, as well as the encoded amino acid sequence. Therefore, the motif preferences we measure cannot be generated by mononu-cleotide-level effects like GC content, etc., although they can produce patterns that can be misinterpreted as having been caused by mononucleotide-level forces. Note, however, that the over-/ under-representations can be made less marked by mutation processes lacking neighbor-base-dependence (we thank R.R. Hudson for pointing this out).
The motif-preference indexthat we use is an empirical Z value, i.e., the signed difference between the observed count and the average count; the whole divided by the standard deviation of the count, where both the average and the standard deviation are estimated over the same 1000 randomized sequences mentioned above. This index has an expected value of 0.00 when averaged over many coding regions with randomized SC positioning, i.e., every motif has an expected across-codon preference of 0.00 when confamilial synonymous codons appear at random locations along an analyzed sequence (see below). In a previous paper [4], MAA used thep-value of the observed motif’s count as the motif’s over-/ under-representation score, but meanwhile it became clear to us that this index loses resolving power whenp-values become very large or very small (i.e., close to 1.0 or 0.0). As indices we also tried aChivalue as well as theZvalue that one can obtain from the p-value of each motif if one assumes that the p-p-value comes from a Z random variable that is N(0,1) normally distributed; but these alternative indices delivered slightly less satisfactory results.
Estimation of motif preferences in non-coding DNA Motif preferences in non-coding DNA were also expressed as Z values but were estimated by shuffling sites randomly along each sequence rather than by randomizing SC locations. This generates for each native non-coding sequence a set of joint empirical null distributions that controls for effects due to discreteness and for the positive and negative correlations between the over-/under-representations of many motifs in each individual sequence, effects that can mar simultaneous ‘‘analytical’’ estimations of multiple motif preferences in a single sequence.
Estimation of average motif preferences over many sequences
From each genome and for each di- and tri-nucleotide motif we calculated a ‘‘whole-genome’’ index of across-codon preference. The ‘‘whole-genome’’ preference for a motif is simply the average of the preference for that motif in each gene, over all genes in a dataset. We confirmed that the null expectation of the whole-genome across-codon preference for each motif is 0.00 by randomizing the placement of SCs in each gene in the human dataset before estimating each gene’s motif preferences and then using these randomized preferences to estimate a new set of average preferences. Such average preferences and null expecta-tions were also estimated for motif preferences derived from native and site-randomizedintronic and non-genic DNA. In such a non-genic sequence (and in a large concatenated one) motif preferences as we measure them are not independent from motifs occurrences –unlike the across-codon motif preferences and codon occurrences of a single coding region– but when the preferences from multiple sequences are averaged they too have an expectation 0.00 under the null hypothesis.
Correlations between codon occurrences and motif preferences
Correlations of GC content with ‘‘GCvsAT pressures’’ derived from motif preferences
We correlated the average 1st-, 2nd-, and 3rd-position GC content, as well as the 1st+2nd+3rd-position GC content of the aforementioned vertebrate coding regions, to heuristic GC-content ‘‘pressures’’ derived from trinucleotide- or dinucleotide-motif preferences. To this end, for each of the aforementioned groups of GC-sorted sequences, we calculate an average pressure towards the GC content(s) of interest. For instance, the pressure for 3rd-position GC is simply the sum of a given group’s average preferences for the trinucleotide motifs ending in CorG, minus that of the preferences for the trinucleotides ending in TorA. Along the same lines, the 1st-position GCvsAT pressure is the sum of the preferences for the trinucleotides starting with CorG minus the sum for the trinucleotides starting with TorA; the 2nd-position GCvsAT pressure is the sum of the preferences for trinucleotides with CorG in their second base minus that of the preferences for trinucleotides with TorA in their second base; and the 1st+2nd+3rd-position ‘‘total’’ GCvsAT pressure is the sum of every trinucleotide-motif preference after multiplying the prefer-ences by 3.0 when the trinucleotide of concern has three CorGs, by 1.0 if it has two CorGs and one TorA, by21.0 if it has one CorG and two TorAs, or by 23.0 if it has three TorAs. Trinucleotide-level pressures were divided by 96, the maximal value the GC123 GCvsAT pressure can assume. The dinucleo-tide-level GCvsAT pressure was simply the sum of each average dinucleotide preference multiplied by 2.0 if the dinucleotide has two CorGs, by22.0 if it has two TorAs, and by 0.0 otherwise. Dinucleotide-level GCvsAT pressures were divided by 16.
We will show below that these GCvsAT pressures correlate with astounding 95%+R2s with the actual GC content of mammalian, avian, and teleostean coding regions (and up to 99.9% in simulated data) but not at all when SC positions are randomized before motif-preference estimation. However, we are desolate to confess that we do not know the mathematical reasons for the felicitous behavior of these heuristic GCvsAT pressures. We did, however, try to dissect non-parametrically the contribution of specific motifs or pairs thereof to these correlations by performing systematic one- and two-motif jack-knifings of the R2values, but we could not find any motif or motif pairs whose exclusion sank the correlations strongly (see Results). For intronic and non-genic DNAonly total GCvsAT pressures were estimated.
Simulations to generate motif over- and under-representations
We wrote a program to simulate the action of neighbor-base-dependent mutation (NBDM) in DNA sequences. In the program, the probability of a base mutating towards one of the other bases is dependent not only on the departure base and the arrival base, but also on the bases at the site preceding and at that following the site of interest. The user provides therefore a matrix with 6464 rates
(the ‘‘no change’’ rate is ignored; i.e., tTt to tTt tCt tAt tGt; tTc to tTc tCc tAc tGc;… gGg to gTg gCg gAg gGg). We used this program to explore the relationship between across-codon motif preferences and actual di- and tri-nucleotide occurrences after NBDM has hit multiple times every site in a sequence. To avoid concatenation of adjacent mutation events the program first chooses a site randomly along the whole sequence and then mutates it according to the three applicable rates in the 6464
matrix (we thank R.R. Hudson for this additional precaution). The whole is repeated until each site is hit a user-defined number of times. For the results shown below, we hit each site at least 10 times.
Additionally, to study how amino-acid selection may blur the relationship between motif preferences and codon occurrences, we added to the simulation a mutation sieve that accepts or rejects each generated mutation according to a user-provided matrix with 64664 codon-change acceptabilities. One such 64664 accept-ability matrix was derived from the Grantham matrix [17] as follows: The acceptability of a replacement from amino acidito amino acid j was equal to 1.02Grantham(i,j )/[1.1*max(Gran-tham)], where Grantham(i,j) and max(Grantham) are the Gran-tham distance between amino acidsiandjand the largest distance in the Grantham matrix, respectively. The conversion gives a maximum acceptability of 1.02 min(Grantham)/[1.1*Max(Gran-tham)], where min(Grantham) and max(Grantham) are the smallest and the largest distances in the Grantham matrix; and the multiplication by 1.1 avoids giving 0.0 acceptability to replacements involving the two amino acids separated by the largest Grantham distance. Synonymous changes were given acceptability 1.0. The matrix was generated and kindly provided by Hua Tang. We obtained comparable results with acceptability matrices derived from the EX and the Blosum100 distance matrices [18,19]. The EX and the Blosum100 acceptability matrices were kindly provided by Arlin Stoltzfuss and are described in Yampolsky and Stoltzfuss [18].
Estimation of neighbor-base-dependent substitution rates
We estimated 6464 substitution/mutation matrices from the substitutions inferrable from the aforementioned alignments of non-genic, intronic, and coding DNA, with the baboon non-genic sequences, the macaque intronic sequences, and the human CDSs being used as outgroup, respectively. A substitution or mutation traced to a branch leading to a non-outgroup sequence was scored only if the outgroup base was found in the other non-outgroup sequence and if, at the same time, the outgroup bases at the two surrounding sites were also found in the non-outgroup sequence displaying the derived base. This excluded contiguous changes in the same lineage. We will use these NBDM rates to explore the relationship between motif preferences and occurrences and to look for large differences between the patterns generated by them and by the matched context-independent mutation regimes, and therefore it appears safe to disregard the subtle biases that may arise from ignoring adjacent substitutions. Such 6464 matrices were also estimated for subsets of the alignments sorted according to the GC content of the outgroup sequence. This sorting by GC content by no means guarantees a pooling of substitutions that respects the whole gamut of similarities and differences that may relate and distinguish the various regimes of NBDM active within a genome. It would be indeed very surprising if GC content turned out to be the best summary statistic for sorting, if there is one. For this reason each estimated GC-specific matrix must be ‘‘blunted’’ to some extent by the fact that its estimation relied on pooled substitutions that were generated by heterogeneous mutation regimes. The number of substitutions/mutations used to estimate each matrix will be given when presenting the results.
Results
Relationship between codon occurrences and trinucleotide-motif preferences
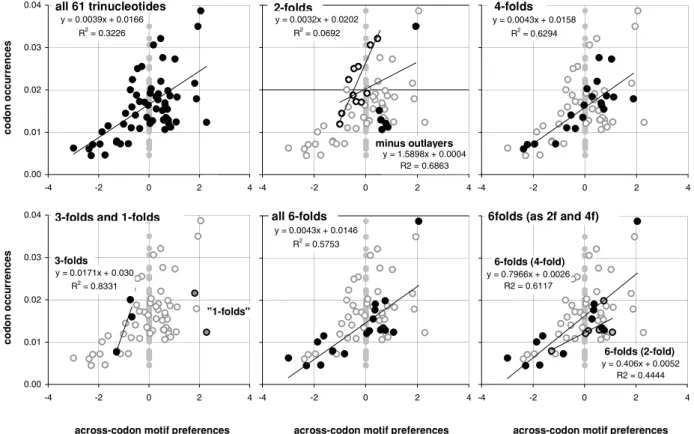
In Figure 1 we plot the average across-codon preferences for the trinucleotide motifs of the 61 sense (non-stop) codons against the occurrence frequencies of the 61 sense codons in 33,860 human coding regions (CDSs). Identical results were obtained with the CDSs with known mouse homologues or known transcripts (not shown).
The occurrence-preference R2value is about 32%. The correlation disappears when the CDSs’ synonymous-codon (SC) location is randomized before estimating each CDS’s motifs preferences (vertical gray points). In the surrounding plots in the same figure, we highlight the points of the trinucleotides belonging to 2-, 3-, 4-, and 6-fold SC families and the two codons for non-degenerately encoded amino acids, using as faded background the other points. The R2values are about 7, 83, 63, and 58%, respectively (and 44 and 61% for the 2-and 4-fold subfamilies of the 6-folds).
These occurrence-preference R2values are large and point to a dependence of whole-genome codon occurrences from the forces responsible for the over-/under-representations of across-codon trinucleotide motifs (since such motif preferences cannot be influenced by standard in-frame in-frame features; see methods). Note that removing the codons for Gln, His, and Cys, i.e., the six codons for three of the nine 2fold amino acids, increases the 2fold occurrence-preference R2tenfold from to 7 to 69%. These three amino acids are special biochemically, and is tempting to speculate that selection is behind their ‘‘below-expectation’’ occurrence (see simulation results below). We will refer to this subgroup of 2fold motifs/codons as the ‘‘2f -3aas’’ group.
Evolutionary conservation of the occurrence-preference relationship
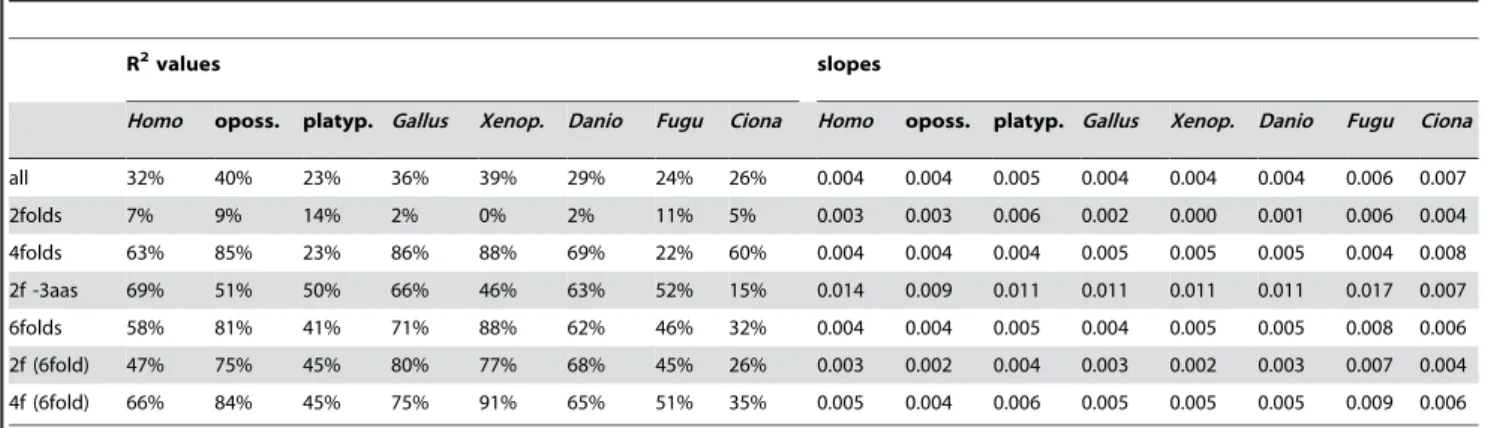
In Table 1 we present the corresponding occurrence-preference R2s and slopes (left, right) forHomo, the opossum, the platypus,
Gallus,Xenopus,Danio,Fugu, andCiona(the patterns forMus,Rattus, and Canisare very similar toHomo’s unless otherwise noted). In general the trends are similar to those in Figure 1, with opossum, Gallus, andXenopusshowing the highest ‘‘all-motifs’’ R2s and with platypus,Fugu, andCionashowing the lowest ones. The slopes are all positive and very similar across taxa if one excepts the 0.000 slope (and 0% R2) for Xenopus’ 2folds. The motif groups with strongest correlations are the 4folds and 6folds. Note that the platypus R2s tend to be similar toFugu’s as those of mammals and Gallusare quite similar too (which may be convergence).
Table 2 lists the R2s and slopes for between-genome comparisons of codon occurrences (left) and of motif preferences (right). It shows that the evolutionary conservation of the occurrence-preference correlations is due to the conservation of both codon occurrences and motif preferences across species. Most R2s in Table 2 are indeed very high except for the occurrence-occurrence comparisons involving Ciona. However, the occur-rence-occurrence R2s for vertebrates vs. Ciona are much lower than those, e.g., for vertebrates vs.Drosophila(and the preference-preference R2s for vertebrates vs. Drosophila are above 45%; neither is shown) so thatCionaappears to be exceptional. Note also that the 97%+ preference-preference R2s forGallusvs.Homoare clearly higher that the corresponding occurrence-occurrence R2s (a result that also holds for Gallus vs. Mus, Rattus, or Canis; not shown). Among motif subgroups the occurrences and preferences of 6folds appear to be the most conserved.
Figure 1. Human codon occurrences and trinucleotide-motif preferences.On the top left are the total occurrences of the 61 non-stop codons in 33,860 human coding regions (CDSs; vertical axis) plotted against the average across-codon over-/under-representation of (‘‘preference for’’) the corresponding 61 trinucleotide motifs in the same CDSs (horizontal axis). The average preference for a motif is the average over all CDSs of the Z value for the motif’s 23I1+3I12 ‘‘off-frame’’ count in each CDS, where the set of 61 Z values of each CDS is estimated using 10,000 randomizations of the locations of its synonymous codons (SCs; see M&Ms). Grey dots are for ‘‘null’’ motifs preferences obtained by randomizing each CDS’ SC locations before estimating each CDS’ motif preferences and averaging over CDSs. The other plots highlight motif groups defined by the genetic code’s degeneracy. In the 2-folds plot (top middle) the ‘‘minus outlayers’’ R2and slope are for the ‘‘3f -3aas’’ group created by excluding the
Therefore, motif preferences appear to be more phylogeneti-cally conserved than codon occurrences during evolution, with occurrences being especially divergent inCiona(and in D.melano-gaster; 0.4% R2 vs. Homo; not shown). Concededly, motif preferences could be the result of only a few major mutational mechanisms that selection could preserve more easily over evolutionary time than say 64 independent processes or 64 independent codon occurrences, but realizing this does not make the preferences, their structuring consequences for the genome, and the possible functional implications of them and/or of what generates them, any less conserved. In Figure 2, we plot the motif preferences ofHomoagainst those of the opossum andGallus(both 97% R2) as well as the corresponding plots for codon occurrences (83 and 89% R2). Note that the preference-preference R2s of
homeotherms vs. Xenopus are also ,97% but Xenopus’ motif
preferences are less extreme (i.e., the slope is not 1.0).
Synonymous-codon usage and the occurrence-preference relationship
To evaluate occurrence-preference correlations without direct effects due to selection on amino-acid usage, we show in Table 3 the occurrence-preference R2s and slopes for each individual 3-, 4-, and 6-fold family of trinucleotide motifs (and for the 4fold ‘‘subfamilies’’ of each 6fold family) as well as occurrence-preference slopes for each 2fold family or subfamily (but no R2s since these are always 100% with only two points). All chordate 3-, 4-, and 6-fold slopes are positive except for Arg4 (negative but very close to zero), and the corresponding R2s are mostly very high in homeotherms and moderate to high in the other chordates. Not surprisingly given the occurrence-preference results with all the 61 motifs, Gallus and XenopusR2s are highest. The slopes for 2fold families are mostly positive, except for His ones which are mainly negative; andXenopus 2fold slopes are often negative. Therefore for 3-, 4-, and 6-folds, the relative occurrences of codons within SC families are mostly very congruent with the corresponding motif preferences.
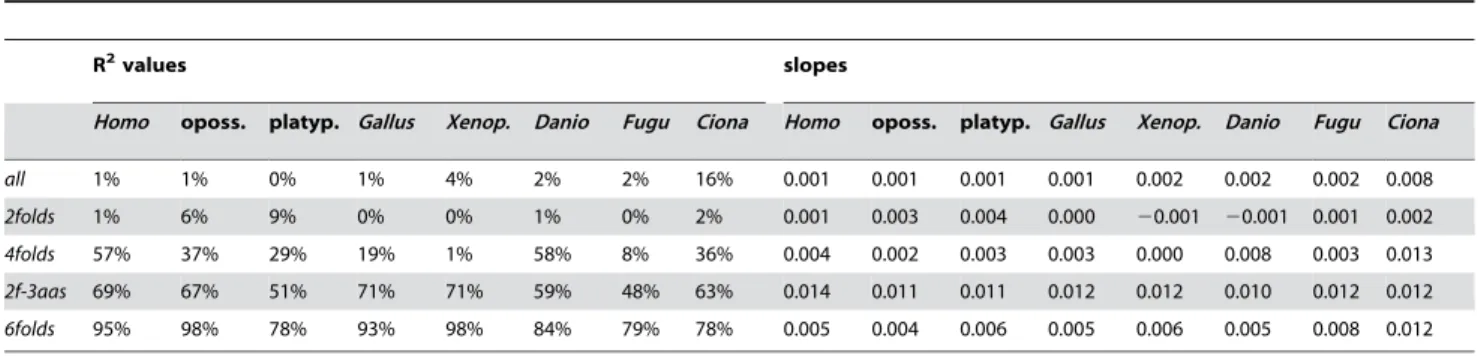
Amino acid composition and the occurrence-preference relationship
In Table 4 we show occurrence-preference R2and slopes for the twenty amino acids together and for the various motif subgroups. In Homo there is only a 1% R2 and a very small slope for the correlation of the whole-genome occurrences of the twenty amino acids with the twenty corresponding sums of motifs preferences. When the 4- and 6-fold-degenerately encoded amino acids and the corresponding motif sums are examined separately, however, HomoR2s are 57 and 95%, respectively (and 69% for the 2f-3aas
group) and the slopes are much higher. Also across species do the 4fold, 2f-3aas, and 6fold groups have high R2s and slopes, with the 6folds of homeotherms, Gallus, and Xenopus showing very high 95%+values, and platypus behaving unlike mammals (which the platypus patterns do also in the previous tables and figures). The high occurrence-preference R2s for these three groups indicate that motif preferences affect the whole-genome occurrence of encoded amino acids, i.e., not only that of codons, with the occurrences of the 6-fold-degenerate amino acids Leu, Ser, and Arg being especially correlated with the three corresponding sums of six motif preferences each.
Table 5 shows that the twenty amino-acid occurrences and the twenty corresponding sums of preferences are quite conserved across species and that the most conserved sums are those of 2folds and 6folds, their R2s averaging 96%+ within vertebrates and 86%+ in chordates. The 99%+ occurrence-occurrence R2s for 6folds in chordates is simply astonishing given that the R2s for the corresponding eighteen individual-codon frequencies (rather than for the three sums) is very low at times (e.g., about 10% inCiona -vertebrate comparisons), indicating that the whole-proteome 3-term ratio Leu/Ser/Arg is rigidly conserved during evolution even when the whole-genome occurrences of the corresponding eighteen 6fold codons differ drastically across genomes. The correlations of the three sums of 6fold-motif preferences show a similar if weaker trend, when compared to those for the eighteen individual preferences. For instance the Ciona-vertebrate prefer-ence-preference R2s average ,32% for the eighteen preferences
(Table 2) but,94% for the three sums of preferences in Table 5,
indicating that the motif preferences for 6fold motifs may be also tuned to deliver similar supervenient pooled results.
Statistical issues raised by the occurrence-preference relationship
The results present so far allow one to evaluate more specifically which statistical concerns are raised by the nature of our datasets, analyses, and conclusions; and which ones may be of lesser concern. This is why we chose to discuss this issue here before continuing with the presentation of results, rather than in the Materials and Methods.
Whole-genome codon frequencies are based on the whole sampling universe so that a sampling variance is counterfactual and negligible anyway given that i) most datasets contain 12,000 genes or more, i.e., millions of codons, and that ii) each ‘‘average motif preference’’ is based on tens of thousands of individual-gene motif preferences. Furthermore, the two human datasets of genes with known transcripts or known mouse homologues comprise
Table 1.R2s and slopes of the correlation between codon occurrences and motif preferences.
R2values slopes
Homo oposs. platyp. Gallus Xenop. Danio Fugu Ciona Homo oposs. platyp. Gallus Xenop. Danio Fugu Ciona
all 32% 40% 23% 36% 39% 29% 24% 26% 0.004 0.004 0.005 0.004 0.004 0.004 0.006 0.007
2folds 7% 9% 14% 2% 0% 2% 11% 5% 0.003 0.003 0.006 0.002 0.000 0.001 0.006 0.004
4folds 63% 85% 23% 86% 88% 69% 22% 60% 0.004 0.004 0.004 0.005 0.005 0.005 0.004 0.008
2f -3aas 69% 51% 50% 66% 46% 63% 52% 15% 0.014 0.009 0.011 0.011 0.011 0.011 0.017 0.007
6folds 58% 81% 41% 71% 88% 62% 46% 32% 0.004 0.004 0.005 0.004 0.005 0.005 0.008 0.006
2f (6fold) 47% 75% 45% 80% 77% 68% 45% 26% 0.003 0.002 0.004 0.003 0.002 0.003 0.007 0.004
4f (6fold) 66% 84% 45% 75% 91% 65% 51% 35% 0.005 0.004 0.006 0.005 0.005 0.005 0.009 0.006
doi:10.1371/journal.pone.0002145.t001
Table 2.R2s and slopes of the correlations between codon occurrences or motif preferences.
whole-genome codon frequencies preferences for across-codon trinucleotides
Homo oposs. platyp. Gallus Xenop. Danio Fugu Ciona Homo oposs. platyp. Gallus Xenop. Danio Fugu Ciona
all 61 codons Homo 0.834 0.954 0.899 0.667 0.909 1.008 0.270 1.077 0.660 0.976 0.836 0.864 0.558 0.288
oposs. 83% 0.891 0.995 0.842 0.977 0.888 0.574 97% 0.605 0.877 0.759 0.779 0.504 0.269
platyp. 92% 68% 0.823 0.578 0.844 1.043 0.173 91% 91% 1.340 1.145 1.213 0.806 0.402
Gallus 89% 91% 73% 0.798 0.990 0.950 0.513 97% 93% 88% 0.840 0.885 0.562 0.314
Xenop. 67% 91% 50% 88% 1.068 0.867 0.815 97% 95% 87% 96% 1.014 0.646 0.376
Danio 87% 84% 74% 94% 79% 0.988 0.450 86% 83% 82% 89% 86% 0.630 0.327
Fugu 85% 55% 90% 69% 41% 78% 0.095 87% 84% 87% 87% 84% 96% 0.481
Ciona 9% 35% 4% 30% 55% 24% 1% 37% 39% 35% 43% 46% 41% 37%
2folds Homo 0.797 0.927 0.903 0.584 0.939 0.973 0.188 0.947 0.673 1.049 0.809 1.110 0.689 0.293
oposs. 83% 0.924 1.019 0.768 0.978 0.802 0.510 91% 0.679 0.996 0.758 1.056 0.665 0.292
platyp. 96% 73% 0.925 0.571 0.973 1.084 0.170 81% 81% 1.242 0.921 1.365 0.886 0.408
Gallus 94% 91% 88% 0.701 0.991 0.922 0.385 98% 86% 77% 0.769 1.016 0.626 0.310
Xenop. 68% 90% 59% 85% 1.145 0.817 0.835 94% 81% 68% 95% 1.261 0.783 0.396
Danio 93% 77% 90% 90% 69% 1.004 0.254 89% 79% 75% 84% 80% 0.629 0.210
Fugu 77% 40% 86% 60% 27% 78% 20.074 84% 76% 77% 77% 75% 97% 0.308
Ciona 5% 27% 3% 17% 47% 8% 1% 22% 21% 24% 28% 28% 16% 14%
4folds Homo 0.806 0.920 0.708 0.575 0.683 0.846 0.032 1.058 0.632 0.931 0.825 0.764 0.503 0.262
oposs. 77% 0.725 0.863 0.799 0.838 0.736 0.345 98% 0.597 0.853 0.770 0.708 0.470 0.251
platyp. 79% 42% 0.441 0.310 0.447 0.825 20.229 94% 95% 1.355 1.226 1.133 0.775 0.404
Gallus 66% 83% 27% 0.865 0.954 0.747 0.525 95% 91% 86% 0.858 0.837 0.529 0.306
Xenop. 52% 84% 16% 89% 0.967 0.629 0.711 96% 96% 91% 95% 0.929 0.593 0.361
Danio 61% 78% 28% 90% 78% 0.803 0.525 80% 78% 75% 88% 83% 0.629 0.394
Fugu 83% 53% 85% 49% 29% 58% 20.039 81% 81% 83% 82% 80% 93% 0.558
Ciona 0% 14% 8% 29% 44% 29% 0% 33% 34% 33% 41% 44% 54% 46%
2f -3aas Homo 0.807 0.901 0.844 0.508 0.897 0.942 0.155 1.088 0.965 1.074 0.698 1.011 0.637 0.540
oposs. 78% 0.812 0.923 0.710 0.827 0.597 0.555 86% 0.749 0.819 0.495 0.781 0.489 0.376
platyp. 94% 64% 0.853 0.461 0.939 1.115 0.096 90% 75% 1.003 0.658 1.027 0.669 0.535
Gallus 91% 91% 80% 0.688 0.969 0.849 0.446 98% 78% 87% 0.653 0.923 0.580 0.556
Xenop. 53% 88% 38% 77% 0.959 0.454 1.008 89% 62% 81% 92% 1.277 0.815 0.840
Danio 89% 64% 85% 82% 49% 1.036 0.186 77% 64% 82% 76% 67% 0.672 0.392
Fugu 66% 22% 80% 42% 7% 72% 20.186 65% 53% 74% 64% 58% 96% 0.533
Ciona 3% 30% 1% 18% 57% 4% 5% 36% 24% 36% 45% 47% 25% 22%
6folds Homo 1.965 2.426 1.857 2.104 1.746 0.052 0.525 1.011 0.985 1.028 0.947 0.659 0.293 0.182
oposs. 82% 1.239 0.949 1.075 0.870 0.045 0.248 98% 0.971 1.012 0.935 0.649 0.283 0.171
platyp. 96% 73% 0.752 0.844 0.690 0.041 0.207 91% 91% 1.040 0.962 0.668 0.298 0.196
Gallus 95% 91% 85% 1.132 0.868 0.095 0.247 98% 97% 91% 0.910 0.632 0.306 0.189
Xenop. 72% 93% 59% 87% 0.755 0.078 0.210 99% 98% 90% 98% 0.685 0.290 0.170
Danio 92% 87% 81% 97% 83% 20.008 0.309 91% 89% 88% 90% 90% 0.396 0.249
Fugu 95% 68% 96% 86% 58% 86% 20.082 92% 91% 92% 91% 91% 97% 0.567
Ciona 1% 17% 0% 8% 30% 8% 0% 31% 31% 25% 37% 35% 33% 30%
2f (6folds) Homo 0.561 0.996 0.835 0.320 0.744 1.283 20.569 1.138 0.780 1.124 0.770 0.987 0.628 0.413
oposs. 60% 1.048 1.031 0.595 1.148 1.247 20.155 94% 0.648 0.892 0.644 0.825 0.523 0.355
platyp. 95% 55% 0.804 0.296 0.671 1.295 20.547 96% 92% 1.368 0.943 1.247 0.777 0.449
Gallus 95% 76% 93% 0.449 0.931 1.421 20.429 94% 82% 88% 0.666 0.799 0.500 0.426
Xenop. 45% 82% 40% 65% 1.633 1.327 0.676 95% 92% 90% 96% 1.203 0.742 0.665
Danio 75% 93% 64% 86% 82% 1.133 20.224 97% 94% 98% 86% 90% 0.627 0.356
Fugu 88% 43% 93% 79% 21% 51% 20.594 95% 91% 92% 81% 83% 95% 0.458
whole-genome codon frequencies preferences for across-codon trinucleotides
Homo oposs. platyp. Gallus Xenop. Danio Fugu Ciona Homo oposs. platyp. Gallus Xenop. Danio Fugu Ciona
4f (6folds) Homo 0.737 1.008 0.914 0.681 0.889 1.153 0.125 1.090 0.691 0.988 0.830 0.883 0.576 0.184
oposs. 86% 1.134 1.130 0.940 1.089 1.279 0.323 99% 0.633 0.900 0.754 0.799 0.522 0.168
platyp. 96% 76% 0.840 0.599 0.812 1.123 0.056 90% 91% 1.305 1.089 1.184 0.790 0.225
Gallus 96% 93% 86% 0.782 0.979 1.195 0.222 99% 99% 91% 0.834 0.893 0.585 0.193
Xenop. 79% 95% 65% 91% 1.127 1.263 0.393 99% 98% 90% 98% 1.066 0.694 0.227
Danio 93% 88% 83% 99% 88% 1.214 0.224 90% 89% 86% 91% 91% 0.640 0.215
Fugu 96% 74% 96% 89% 67% 90% 0.066 92% 91% 91% 93% 93% 98% 0.326
Ciona 6% 26% 1% 17% 36% 17% 2% 32% 32% 25% 35% 34% 38% 36%
doi:10.1371/journal.pone.0002145.t002 Table 2.cont.
Figure 2. The conservation of codon occurrences and trinucleotide-motif preferences in homeotherm vertebrates. Plots of the preferences for across-codon trinucleotides inHomovs. opossum orGallus(left and right, top) and of whole-genome codon occurrences inHomovs. opossum orGallus(left and right, bottom).Homo’s values are on the horizontal axis.
doi:10.1371/journal.pone.0002145.g002
,12,000 genes each and provide therefore a de facto 30%
jackknifing for the conclusions drawn from the 33,860-gene human dataset; and non-surprisingly the results are identical (see also below). The evolutionary variance, on the other hand, could be a problem but this possibility is ‘‘academic’’ at least within mammals given that i) the various mammalian codon occurrences correlate with each other with R2s close to 90% (98% among placentals) and ii) that the preferences for across-codon motifs are
highly correlated not only within mammals but also between the latter, Gallus, and Xenopus (98%) despite extensive 3rd-position divergence between lineages (the bases at 3rd-positions determine motif preferences). Therefore neither codon counts nor motif preferences have a sampling or an evolutionary variance that could lead to spurious patterning by chance so that their conservation or divergence must reflect deterministic effects (see, e.g., the sections below on GC content ‘‘effects’’).
Table 3.Occurrence-preference R2s and slopes within degeneracy-defined trinucleotide families.
4folds 6 folds 3fold
Leu4 Val Ser4 Pro Thr Ala Arg4 Gly Leu Ser Arg Ile
R2s
Homo 0.869 0.994 0.789 0.684 0.861 0.606 0.166 0.611 0.774 0.762 0.496 0.833
oposs. 0.960 0.994 0.871 0.904 0.941 0.910 0.062 0.977 0.870 0.856 0.838 1.000
platyp. 0.653 0.879 0.440 0.024 0.183 0.250 0.242 0.485 0.630 0.430 0.467 0.621
Gallus 0.876 0.974 0.887 0.949 0.989 0.971 0.100 0.962 0.743 0.897 0.850 0.895
Xenop. 0.923 0.929 0.895 0.972 0.983 0.990 0.309 0.865 0.817 0.901 0.923 0.601
Danio 0.786 0.828 0.740 0.790 0.950 0.784 0.050 0.973 0.763 0.693 0.784 0.932
Fugu 0.816 0.813 0.385 0.227 0.177 0.226 0.207 0.163 0.768 0.330 0.600 0.858
Ciona 0.296 0.694 0.437 0.605 0.629 0.833 0.719 0.928 0.263 0.338 0.666 0.031
slopes Homo 0.0107 0.0092 0.0037 0.0028 0.0035 0.0049 0.0021 0.0077 0.0086 0.0041 0.0016 0.0171
oposs. 0.0065 0.0066 0.0041 0.0037 0.0039 0.0052 20.0008 0.0080 0.0053 0.0042 0.0024 0.0114
platyp. 0.0160 0.0145 0.0031 0.0008 0.0030 0.0052 0.0028 0.0081 0.0127 0.0036 0.0024 0.0149
Gallus 0.0093 0.0070 0.0038 0.0036 0.0036 0.0052 0.0007 0.0062 0.0069 0.0040 0.0025 0.0099
Xenop. 0.0068 0.0059 0.0052 0.0043 0.0050 0.0055 0.0010 0.0085 0.0055 0.0052 0.0037 0.0066
Danio 0.0087 0.0090 0.0034 0.0032 0.0035 0.0047 0.0004 0.0112 0.0076 0.0035 0.0022 0.0096
Fugu 0.0198 0.0180 0.0035 0.0016 0.0028 0.0048 0.0023 0.0040 0.0173 0.0042 0.0032 0.0222
Ciona 0.0030 0.0062 0.0113 0.0067 0.0071 0.0127 0.0167 0.0152 0.0034 0.0102 0.0174 0.0022
2folds
(R2= 1) Phe
Leu2 Tyr His Gln Asn Lys Asp Glu Cys Ser2 Arg2
slopes Homo 0.010 0.003 0.033 20.012 0.016 20.013 0.009 0.013 0.025 0.010 0.012 0.000
oposs. 0.000 0.003 20.030 0.004 0.014 0.019 0.000 20.016 20.005 0.023 0.003 0.003
platyp. 0.029 0.005 20.379 20.019 0.027 20.104 0.008 0.078 0.017 0.030 0.017 0.000
Gallus 20.011 0.002 0.015 20.010 0.015 0.114 0.003 20.132 0.011 0.003 0.006 0.002
Xenop. 0.200 0.002 0.013 0.003 0.010 20.046 20.011 20.251 20.014 0.131 0.004 0.004
Danio 0.001 0.003 0.028 20.009 0.012 0.010 20.002 0.004 0.016 0.004 0.008 0.004
Fugu 20.048 0.006 0.104 20.057 0.022 0.032 0.070 0.052 0.033 20.006 0.028 20.005
Ciona 20.038 0.001 0.052 20.017 0.012 0.000 20.023 0.027 0.022 0.025 20.029 0.014
doi:10.1371/journal.pone.0002145.t003
Table 4.Occurrence-preference R2s and slopes after pooling values according to encoded amino acid.
R2values slopes
Homo oposs. platyp. Gallus Xenop. Danio Fugu Ciona Homo oposs. platyp. Gallus Xenop. Danio Fugu Ciona
all 1% 1% 0% 1% 4% 2% 2% 16% 0.001 0.001 0.001 0.001 0.002 0.002 0.002 0.008
2folds 1% 6% 9% 0% 0% 1% 0% 2% 0.001 0.003 0.004 0.000 20.001 20.001 0.001 0.002
4folds 57% 37% 29% 19% 1% 58% 8% 36% 0.004 0.002 0.003 0.003 0.000 0.008 0.003 0.013
2f-3aas 69% 67% 51% 71% 71% 59% 48% 63% 0.014 0.011 0.011 0.012 0.012 0.010 0.012 0.012
6folds 95% 98% 78% 93% 98% 84% 79% 78% 0.005 0.004 0.006 0.005 0.006 0.005 0.008 0.012
The independence between individual codon frequencies is quite high since there are 61 codons (and the results are identical if one uses total codon counts instead of frequencies). However, many across-codon motif preferences are instead strongly correlated with one another. It is unclear to us whether this non-independence could compromise our analyses and
conclu-sions at least as far as the relationship between codon occurrences and across-codon motif preferences is concerned. On the contrary, it is reasonable to argue that because no plotted point has substantial estimation error on either axis, i.e., because no point has a real chance of appearing in a spot very different from the one it actually occupies in a plot, across-codon preferences can
Table 5.R2s and slopes of the correlations between amino-acid occurrences or between corresponding sums of preferences.
whole-genome amino acid occurrences sums of corresponding motif preferences
Homo oposs. platyp. Gallus Xenop. Danio Fugu Ciona Homo oposs. platyp. Gallus Xenop. Danio Fugu Ciona
all 20 amino acids
Homo 0.918 0.988 0.938 0.878 0.918 0.950 0.741 1.097 0.642 1.000 0.888 0.810 0.496 0.351
oposs. 98% 1.055 1.011 0.960 0.991 1.011 0.836 97% 0.579 0.875 0.788 0.705 0.436 0.313
platyp. 99% 98% 0.946 0.894 0.928 0.962 0.768 89% 89% 1.356 1.206 1.143 0.735 0.485
Gallus 98% 98% 98% 0.940 0.981 0.996 0.821 97% 92% 83% 0.869 0.819 0.487 0.360
Xenop. 94% 97% 96% 97% 1.018 1.039 0.894 98% 95% 83% 96% 0.884 0.533 0.409
Danio 97% 97% 97% 99% 97% 1.013 0.842 85% 80% 78% 89% 82% 0.595 0.415
Fugu 98% 96% 99% 97% 96% 97% 0.800 86% 83% 88% 86% 81% 96% 0.666
Ciona 77% 85% 82% 86% 92% 87% 83% 66% 65% 58% 71% 72% 71% 68%
2folds Homo 0.918 0.911 0.968 0.717 0.948 0.801 0.557 0.946 0.666 1.071 0.838 1.118 0.688 0.435
oposs. 97% 0.972 1.034 0.780 1.002 0.840 0.641 92% 0.674 1.033 0.792 1.082 0.680 0.407
platyp. 99% 97% 1.062 0.796 1.041 0.876 0.642 80% 80% 1.263 0.947 1.377 0.900 0.568
Gallus 98% 97% 99% 0.751 0.981 0.820 0.617 99% 89% 76% 0.788 1.019 0.625 0.413
Xenop. 93% 96% 97% 98% 1.269 1.051 0.876 95% 82% 67% 97% 1.217 0.746 0.517
Danio 97% 94% 99% 99% 96% 0.838 0.619 93% 85% 78% 89% 81% 0.611 0.337
Fugu 98% 93% 98% 98% 93% 99% 0.694 92% 87% 87% 88% 80% 97% 0.560
Ciona 61% 70% 68% 71% 83% 70% 62% 82% 70% 78% 86% 86% 66% 70%
4folds Homo 0.458 0.851 0.610 0.156 0.244 0.547 20.957 1.129 0.981 0.590 0.765 20.006 0.222 20.268
oposs. 63% 1.309 0.756 0.341 0.348 0.851 21.201 87% 0.869 0.333 0.566 20.042 0.221 20.163
platyp. 89% 70% 0.720 0.224 0.393 0.711 20.873 83% 96% 0.339 0.620 0.025 0.301 20.212
Gallus 45% 23% 51% 0.409 0.772 0.762 0.064 66% 31% 25% 0.925 20.007 0.043 20.353
Xenop. 13% 21% 22% 76% 1.707 1.427 1.264 96% 77% 73% 74% 0.013 0.255 20.329
Danio 10% 7% 21% 81% 87% 0.804 0.766 0% 2% 0% 0% 0% 0.575 20.458
Fugu 54% 43% 74% 87% 67% 71% 20.159 29% 42% 62% 1% 24% 32% 20.506
Ciona 49% 26% 33% 0% 16% 19% 1% 57% 31% 41% 52% 52% 27% 34%
2f -3aas Homo 0.931 0.874 0.917 0.643 0.881 0.765 0.421 1.057 0.953 1.111 0.741 1.043 0.678 0.615
Oposs. 96% 0.912 0.958 0.695 0.906 0.777 0.512 84% 0.749 0.857 0.537 0.857 0.563 0.416
Platyp. 99% 97% 1.043 0.740 1.002 0.871 0.504 90% 74% 1.040 0.695 1.054 0.712 0.611
Gallus 99% 98% 99% 0.711 0.960 0.829 0.496 99% 79% 88% 0.673 0.927 0.600 0.562
Xenop. 93% 99% 96% 97% 1.292 1.104 0.784 93% 65% 83% 95% 1.231 0.801 0.852
Danio 98% 93% 98% 99% 93% 0.867 0.496 89% 79% 92% 87% 73% 0.665 0.505
Fugu 98% 91% 98% 97% 90% 99% 0.524 83% 76% 93% 80% 68% 98% 0.746
Ciona 46% 61% 51% 54% 71% 50% 43% 85% 51% 84% 88% 96% 70% 69%
6folds Homo 1.007 0.963 1.064 1.092 0.986 0.927 0.831 1.116 0.632 1.037 0.881 0.779 0.449 0.264
Oposs. 100% 0.950 1.054 1.087 0.981 0.920 0.826 100% 0.565 0.928 0.790 0.694 0.400 0.235
Platyp. 100% 99% 1.102 1.127 1.017 0.957 0.858 95% 95% 1.589 1.333 1.253 0.726 0.429
Gallus 100% 100% 100% 1.028 0.928 0.872 0.782 100% 99% 98% 0.846 0.763 0.441 0.259
Xenop. 99% 100% 98% 99% 0.903 0.846 0.760 100% 100% 96% 100% 0.886 0.511 0.300
Danio 99% 100% 98% 99% 100% 0.937 0.841 92% 91% 99% 95% 92% 0.580 0.344
Fugu 100% 100% 99% 100% 100% 100% 0.897 91% 90% 99% 94% 91% 100% 0.593
Ciona 99% 100% 99% 100% 100% 100% 100% 89% 88% 98% 93% 89% 100% 100%
doi:10.1371/journal.pone.0002145.t005
therefore be used to predict genomic codon occurrences, leaving the explanation of the remaining ‘‘variance’’ to unknown effects to be incorporated later. A related and possibly more serious problem is the presence of wrongly diagnosed genes in the datasets. Below, we dealt with this by comparing the full-genome results fromHomo andMuswith results obtained using the two sets of 12.277 genes that are homologous in the two species. Another issue, but concerning biological interpretation, is the extent to which the sequence of each individual gene is shaped by the forces behind motif preferences; in this paper we focus on whole-genome and large-group trends and make no attempt at addressing this issue.
The occurrence-preference relationship as a function of coding-region GC content
Since GC content can vary markedly along chromosomes [1], we show in Figure 3 how the correlation between codon occurrences and trinucleotide motif preferences reacts to increas-ing GC content in human codincreas-ing regions. The 33,860 human genes were sorted by increasing GC content at their third codon positions (GC3) and separated into thirteen groups having equal number of sequences, in order to calculate occurrence-preference R2s within each group as it was done with the whole-genome dataset to generate Figure 1. Almost without exception the R2s change smoothly with increasing GC3, with the peak R2for all 61 motifs being 43% at 0.55 GC3 and those for 2folds, 2f-3aas, 4folds, and 6folds being 18, 73, 90, and 85% at 0.67, 0.55, 0.51, and 0.47 GC3, respectively. The corresponding plot of the slopes vs. GC3 in the top right of the same figure, shows that only the slopes of 2folds and especially those of 2f-3aas react strongly to GC3. The occurrence-preference plots for the GC3 values that deliver the highest R2s show that the various relationships are similar to the whole-genome ones in Figure 1. All in all, the monotonic reaction of the R2s to GC3 indicates that the whole-genome patterns presented above are indeed ‘‘noisy’’ but in a biologically structured way.
In Figures 4 and 5 we show how occurrence-preference R2s and slopes change with GC3 in the other vertebrate genomes. The R2 patterns are remarkably similar across homeotherm vertebrates. The jagged opossum patterns may be due to the inclusion of falsely diagnosed (or newly recruited) genes in the dataset we used. Indeed similar irregularities were also seen withMusandCanis, but in the Mus case disappeared when using genes with known transcripts or known human homologues (neither is shown; occurrence-preference R2s in non-coding DNA are almost 100% at 0.5 GC and react more strongly to GC changes, see below). Also here platypus’ patterns seem fish-like to some extent. An interesting pattern is that the all-motifs and the 6fold lines cross above 0.7 GC3 in homeotherms (including Mus and Canis, not shown) but clearly below 0.7 in poikilotherms.DanioR2patterns are more homeotherm-like thanFugu’s (which were relegated to the background). Note that the 2f-3aas R2s from high-GC rodent genes (in all rodent datasets) are much higher than those from the other vertebrates expect the opossum and may indicate a difference in genome-wide amino-acid selection (see also below). Also the slopes’ reaction to GC3 in Figure 5 is remarkably similar across vertebrates albeit less strikingly so than the R2s; and also here are the patterns obtained with known-homologueRattusand Mus genes clearly smoother than those from the whole-genome dataset. Remarkably,Danio’s slopes are homeotherm-like in many respects unlikeFugu’s which, like its R2s, are patterned unlike those of the other vertebrates. Finally, it is hard to believe that the highest-GCXenopusgroup may not be anomalous since it delivers R2s and slopes unlike those of any vertebrate.
Coding-region GC and the balance between the preferences for GC-rich and GC-poor motifs
As mentioned in the Introduction and in the Materials and Methods, we found that GC content and motifs preferences are correlated strongly, positively, and linearly. In Figure 6 we plot the GC content at the three codon positions for each of the aforementioned thirteen groups of GC-sorted human genes against the corresponding GCvsAT pressures (see Materials and Methods) derived from the various preferences for the trinucleo-tide motifs in the same groups. The R2for 3rd-position GC content
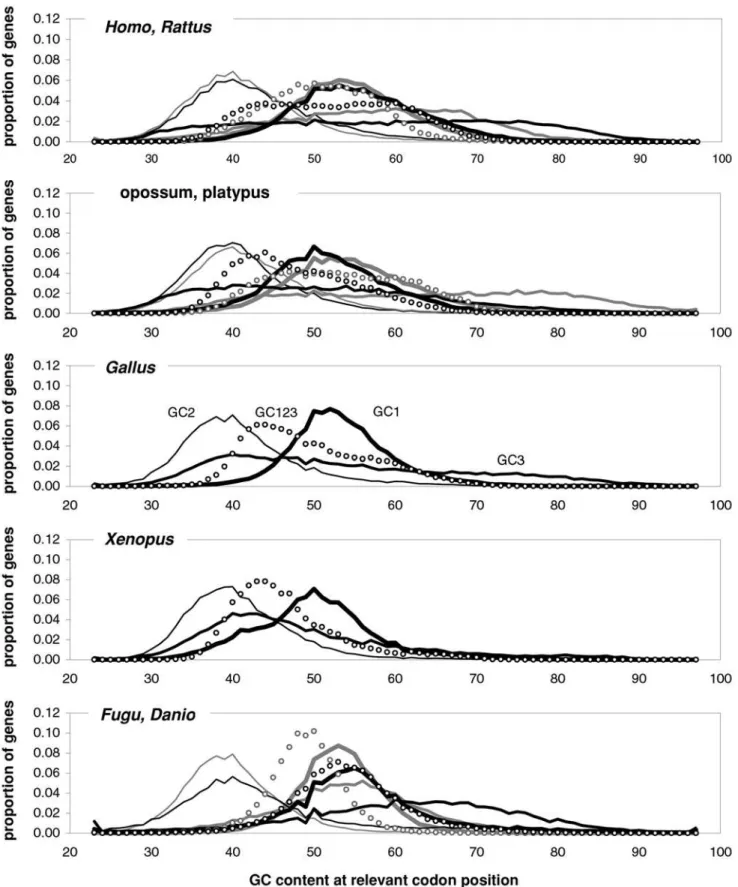
is 98% (99% excluding the group with highest GC) and those for total, 1st-position, and 2nd-position GC are 98, 92, and 88%. The plotted horizontal ‘‘null’’ relationship was obtained by randomiz-ing the SC location of each gene before motif-preference estimation, which leaves GC content unchanged but randomizes each gene’s motif preferences, resulting in identical, zero-valued GC pressures in each of the thirteen groups. In Figure 7 we present the other vertebrates’ plots of GC123 vs. the total GC pressure. The R2s are again striking, falling below 95% only in Fugu (90%). When using the GC pressure derived from dinucleotide preferences and genes sorted by GC3, the R2 is 98% (Fig. 8). Remarkably, for the human case no exclusion of individual di- or tri-nucleotide preferences –or of pairs thereof– from the GC-pressure sums lowers the R2below 89%, with CC, AA, CTT, CCC, CAA delivering the top reductions (not shown). Figure 7 shows indirectly that the GC3 excursion is quite similar across vertebrates, indicating that the GC content of vertebrate genes and their proximities may be quite similar (since GC3 is well-known to be highly correlated to the GC content of the genomic regions surrounding genes [1]). This motivated Figure 9 that shows the distribution of the various GC contents in vertebrate coding regions. Remarkably,XenopusGC distributions are very homeotherm-like although its GC3 distribution lacks mass, but not presences, when GC3 is low (consistent withFugu’s lack of ‘‘junk’’ DNA which tends to be AT-rich).Danio’s GC3 mass tends to be in the middle of the homeotherm range (and looks like the homeotherm GC123). In general, GC3 excursions are not very different across vertebrates although the low-GC tails tend to be thicker in homeotherms. Note also that the bimodality of human GC123 is almost identical inCanisand that the same applies to GC1, GC2, and GC3 (not shown; hence GC content cannot be what makes us human). Finally, note that in all vertebrates GC123 tends to fall between 0.37 and 0.70.
mutational intensities in gene-rich DNA is very likely to be unaffected by distantly located ‘‘junk’’ DNA in the same or other chromosomes, or the lack thereof, exactly as indicated by the similarity of the distributions of genic vertebrate GC content shown in Figure 9 (although newly inserted junk DNA can disrupt transiently the compaction of a region’s chromatin and hence also
the local DNA metabolism; see Holmquist and Ashley [20] and citations therein).
The main message implied by the strikingly linear relationship between the GCvsAT pressures and GC content evident in Figures 7 and 8 is, however, that changes in a highly amorphous summary statistic like GC content –which one would be tempted Figure 3. Codon occurrences vs. trinucleotide-motif preferences as a function of GC content.At the top are plotted the R2s and the
slopes of the correlations between codon occurrences and corresponding motif preferences for given values of 3rd-position GC content (GC3). The
other plots show the situation at the GC3 values delivering peak R2s for, clockwise, 2 fold, 2fold-3aas, 4fold, and 6fold codons/motifs (i.e., 0.67, 0.55, 0.46, and 0.51 GC3; the GC3 delivering the peak all-motifs R2coincides with that of 2folds-3aas; see also Figure 1). The 33,860 human coding regions
were sorted according to 3rd-position GC content and subdivided into 13 groups of equal size. doi:10.1371/journal.pone.0002145.g003
to consider as ‘‘a good place to start’’ because of its simplicity– could be generated by forces acting in a non-uniform way on more complex entities like individual nucleotide motifs whose joint occurrence can by chance end up being concerted in a way that allows the summary statistic to behave in an appealing way, prompting unjustified efforts to find a mechanistically simple force that can explain the summary statistic’s ‘‘simple’’ dynamics and
hindering thereby the identification of the actual underlying forces. In other words, Occam’s razor could be misleading in this case.
Coding-region GC and changes in the strength of motif-preferences
The strong correlations between the preference-derived GCvsAT pressure and GC content presented above prompted Figure 4. Occurrence-vs.-preference R2s in vertebrates as a function of GC3.The R2s of the correlation between codon occurrences and
corresponding off-frame-motif preferences for increasing GC3 values in the genomes ofRattus, opossum, platypus,Gallus,Xenopus, andDanio. In the Rattusplot theHomopatterns from Fig. 3 are used as background andFugu’sare in the background in theDanioplot.
us to examine additional correlations of GC content with other summary statistics that can be derived from motif preferences (strand asymmetries are shown further below). In Figure 10 we plot the summary statistic that gave the strongest relationship, i.e., the sum of the preferences for over-represented tri- or di-nucleotides (left, right). This sum gives very high 63 and 90%
R2s with GC3, respectively (while the sum of the absolute values of every motif preference gives relatively lower 54 and 84% R2s). These high R2s are, however, not as high as those connecting preference-based GC pressures to GC content. Note furthermore that the two slopes are almost identical for tri- and di-nucleotide over-representations, perhaps indicating comparable levels on Figure 5. Occurrence-preference slopes in vertebrates as a function of GC3.The slopes of the correlation between codon occurrences and corresponding motif preferences for increasing GC3 values in the genomes ofRattus, opossum, platypus,Gallus,Xenopus,Danio, andFugu. In the Rattusplot theHomopatterns from Fig. 3 are used as background andFugu’s are in the background in theDanioplot.
doi:10.1371/journal.pone.0002145.g005
non-randomness in tri- and di-nucleotide preferences (as observed, albeit not as cleanly, when comparing the slopes of the correlations of preference-derived GC pressures with GC content).
A important indication given by Figures 7 to 10 concerns the validity of the conclusion that the forces behind motifs preferences may shape vertebrate-DNA primary structure only or mainly when GC content is intermediate, simply because occurrence-preference correlations are highest when GC content is interme-diate. Figures 6–8 and 10 show instead that preference-derived summary statistics correlate with GC content over the whole range of GC contents shown, although they are fully independent from GC content. Therefore the processes that generate motif-preference heterogeneities could very well determine GC-content
intermediate-GC DNA are stronger than those active in lower- or higher-GC DNA, at least as far as the extremeness of the individual preferences reflects the strength of these forces. Below, however, we will show that NBDM affects strongly the quality and quantity of the amino-acid replacements that point mutations generate so that it may not be a coincidence that occurrence-preference correlations are highest when GC content is interme-diate, since that is the GC of most genes.
Individual trinucleotide occurrences and preferences as a function of GC content
The results above using groups of CDSs sorted by GC motivated us to study how individual codon frequencies and trinucleotide motif preferences change with increasing GC3 (Fig. 11 and 12). Additionally, to gain a better understanding of motif preferences we present in Figure 13 the departure of each
individual codon occurrence from that expected given the base composition which fits best the codon occurrences in each GC3-sorted group (i.e., that minimizing the sum of the every absolute difference between an observed and a predicted codon frequency, with granularity 0.001). The lowest occurrences are those of trinucleotides containing CG and TA dinucleotides; furthermore their reaction to changing GC3 is quite restricted. Another remarkable trend is that all T- and A-ending codons decrease in frequency with GC3, CGT being the only exception (always low), which contrasts clearly with the often large differences among the increases of C- and G-ending codons. Of the latter the G-ending codons are those with most variable behavior while C-ending ones increase monotonically with higher GC3 almost without excep-tion. The most extreme increases in occurrence in response to higher GC3 are those of CTG, GCC, and GTG, and the largest decreases are those of AAA and GAA. Note that these results for plain codon occurrences, and similar ones below for dinucleotides, Figure 7. Vertebrate GC3 vs. GC3-pressures derived from motif preferences.The correlation between coding-region GC content (GC123) and the corresponding GCvsAT pressure derived from motif preferences. Clockwise from the top left are results for opossum andRattus(+), platypus, GallusandXenopus(+), andFuguandDanio(+). The thick gray lines are for human genes. See also Methods and the previous figure.
doi:10.1371/journal.pone.0002145.g007
suffice to conclude that neither GC content nor base composition can possibly account for the occurrence of individual codons in groups comprising many coding regions (where the fact that the contrasted groups contain many genes makes it hard to invoke constraints arising from the need of individual genes to encode peculiar proteins).
The reactions to GC3 of the occurrences of single trinucleotides are not accompanied by corresponding reactions by motif preferences. Indeed most motif preferences change only subtly with GC3, especially for high GC3 values (see below the situation at the dinucleotide level). This lack of reaction is surprising given how remarkably linearly the preference-derived GCvsAT pres-sures relate to GC content (see above). In contrast, the reaction to GC3 of the departure of the occurrences from their base-composition expectations is often similar to the corresponding reactions of the occurrences of single trinucleotides, even though 17 out of 61 occurrences change linearly with GC3 without concurrent changes in occurrence departure from expectation (Fig. 13). Note also the almost total lack of congruence between the way in which preferences react to GC3 and how occurrences depart from their base-composition expectations. This, together with the similar observation for dinucleotides at the end of the next section, shows that the randomization of SC location delivers motif preferences that are neither related circularly to motif occurrences nor replaceable in an obvious way by the departure of motif occurrences from their base-composition expectations.
Individual dinucleotide occurrences and preferences as a function of GC content
Changes in the occurrences of, and in the preferences for, across-codon dinucleotides as a function of GC3 are shown in Figure 14. In general the occurrence of motifs beginning with TorA decreases with increasing GC3 while that of those beginning in CorG increases, which is consistent with these being 3rd-position TorAs and CorGs. Remarkably and almost without exception, when looking at pairs of dinucleotides ending in TorA or CvsG but sharing the first nucleotide, when a dinucleotide is less
preferred than its partner, its occurrence is always lower than that of its partner across all GC3 groups. As it was the case for trinucleotides, occurrence changes are not clearly mirrored by similar changes in preferences, which is surprising given that, as it was the case for trinucleotides, the GCvsAT pressure derived from dinucleotides preferences showed a remarkably linear increase with GC3 (see Fig. 8). However, occurrence changes with GC3 are mirrored by changes in the departure of the occurrences from their corresponding base-composition expectations although not always as smoothly or with similar steepness. Note again the lack of correlation that we mentioned above, between the reaction to GC3 of motif preferences and that of occurrence departures from expectation.
Strand asymmetries of occurrences and preferences as a function of GC content
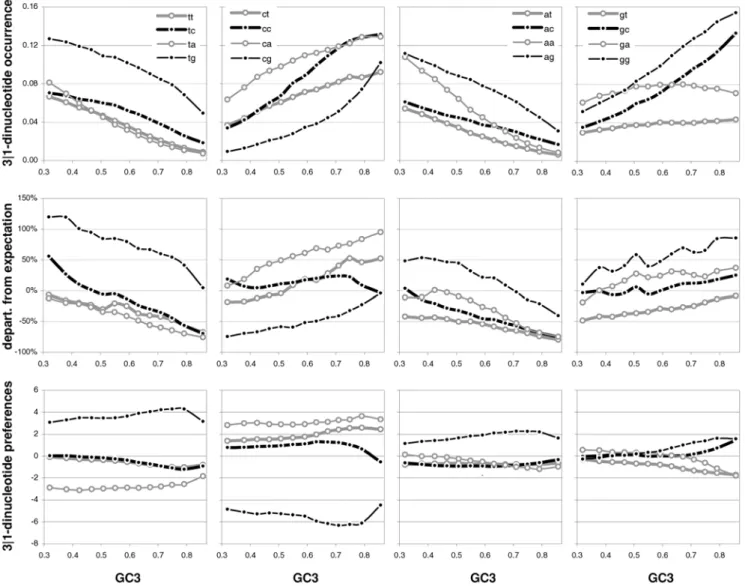
Since transcription is well known to be mutagenic (see Discussion) and since transcription is a strand-specific process, we decided to present in Figure 15 the total strand asymmetries of coding-region base composition as well as those of the occurrences of and the preferences for dinucleotides and trinucleotides/codons. As index of total strand asymmetry we use the sum of the absolute value of the difference between the occurrences or preferences of complementary bases, dinucleotides, or trinucleotides (codons), over all such complementary pairs. Base-occurrence asymmetry decreases with GC3 and is strongest at the first codon position when GC3 is lowest. Note that these are GC-neutral base composition reactions to GC3 that are nonetheless quite marked for four of the six pairs of complementary bases at the three codon positions, with 3rd-position TvsA and 2nd-position CvsG being least reactive and 3rd-position TvsA showing also the least asymmetry. The occurrence asymmetries of 3|1 dinucleotides and codons peak at highest and lowest GC3 with a minimum at intermediate GC3. The departures from base-composition pre-dictions are large and must be due to natural selection and/or NBDM. The asymmetries shown by the 90 ribosomal-protein genes are clearly noisier but appear to be higher overall, suggesting that we have to do with an effect due to transcription-associated mutation and/or repair, one which is weakest when GC3 is intermediate even when transcription is maximally high (as it is the case for ribosomal-protein genes). In the middle and the bottom left plots of Figure 15 we present the total asymmetries of the motif preferences of complementary across-codon dinucleotides or trinucleotides. These asymmetries are also structured, being lower at intermediate GC3 and higher especially at high GC3, albeit the patterns are not symmetrical, shifted as they are towards an inflection point at about 0.7 GC3. The preference asymmetries from the 90 ribosomal-protein genes are again much noisier and seem higher, although the dinucleotide asymmetries in the two groups of lowest GC3 are weaker than in non-ribosomal genes. The fourth point from the left appears to be an inflection point for some ribosomal asymmetries but more data is needed to corroborate this observation.
In Figure 16 we show the individual asymmetries of the occurrences of, and of the preferences for, complementary across-codon dinucleotides. In general, 3-position GorC (i.e., when the first base in a 3|1 dinucleotide is a G or a C) dominates the reaction of the asymmetries to changing GC3, but there are clear differences even when one ‘‘controls’’ for this variable (e.g., TGvsCA sinks more quickly with increasing GC3 than does ACvsGT). Note again the striking dissimilarities between prefer-ence asymmetries and the asymmetries of the differprefer-ence between observed occurrences and base composition expectations. The trends shown by the asymmetries of individual pairs of Figure 8. Vertebrate 3rd-position GC content and
Figure 9. Coding-region GC content in vertebrates.The distribution of the GC content at the three codon positions in vertebrate genes. Thickest black line: first-position GC content (GC1); 2nd-thickest black line: GC2; thin black line: GC3; circles: GC123. Lighter lines and circles are for
Rattus, platypus, andDanio, respectively. doi:10.1371/journal.pone.0002145.g009
complementary trinucleotides are even harder to interpret than those of dinucleotides but are included for completeness in Figure 17. In general, therefore, there is no obvious relationship between preference asymmetries and occurrence asymmetries or between preference asymmetries and those shown by the departures of the occurrences from base-composition expectations. In Figure 18 we show total occurrence asymmetries for the vertebrates considered so far. The general trends are like those shown by human genes if one exceptsFugu’s flat 1st-position base occurrence asymmetries which are always high (also found in Canis, not shown). A noteworthy trend is that the curves appear conserved across species despite spotty absences of certain GC3-defined groups. Trinucleotide inflection-minima lean generally towards lower GC3 so that the near symmetry of the human pattern is not typical. The comparative picture for motif-preference asymmetries in Figure 19 shows similar patterns for homeotherms and poikilotherms, the main between-group differ-ence being the lower-GC3 inflection points of poikilotherms.
Motif occurrences and preferences in intronic and non-genic DNA
Since primary-structural patterns in non-coding DNA are likely to be due to mutation pressure and genetic drift, we plot coding-region di- and tri-nucleotide occurrences and preferences against those in intronic and non-genic DNA (Figure 20 and Figure 21). Figure 20 shows that the preference R2s are much higher than the occurrence R2s ranging from 73 to 80%, indicating that similar forces structure intronic and coding-region motif preferences. Note also that both the dinucleotide occurrences tabulated by Setlov [8] and the motif preferences inferrable from these occurrences are highly correlated to the corresponding intronic values, indicating that these 1970s data provided already very accurate information about whole-genome motif preferences. In Figure 21 we plot coding-region and intronic dinucleotide and trinucleotide
occur-rences and prefeoccur-rences against those in non-genic DNA. Coding-vs.-nongenic occurrence R2s are low but preference R2s are quite high especially for dinucleotides (94% vs. 84%). Intronic-vs.-nongenic occurrence and preference R2s are high and become very high when one excludes outlayer base runs. For instance, the trinucleotide preference-preference R2 becomes 97% if one excludes TTT, AAA, CCC, and GGG, indicating that coding-region and intronic motif preferences are structured by the same forces underlying the motif preferences of non-genic DNA, i.e., of most of the genome. The dinucleotide occurrences and prefer-ences in Setlov’s data [8] are also very correlated to those in the non-genic DNA dataset, with the occurrence R2 reaching 96% when one excludes TT and AA. This is another clear indication that these 1970s data contained very useful information on whole-genome motif preferences.
Occurrence-preference relationships in non-genic and intronic DNA as a function of GC content
The plots in Figure 22 show the GC-content reaction of trinucleotide occurrence-preference R2s in intronic and non-genic
DNA. Peak occurrence-preference R2s of 97%+ are observed when GC is about 0.5 in intronic and non-genic DNA. These R2 values, however, can be quite low in either type of non-coding DNA, demonstrating again that occurrence-preference R2s do not need to be always high. The plots in the middle for 0.5 GC show that every one of the 64 trinucleotides falls on the regression line without exception, and that the main differences between the reactions to GC of non-genic and intronic occurrence-preference R2s are that the nongenic values for 4folds and 6folds sink more slowly with lower GC than the intronic ones and that the 2fold and 2f-3aas non-genic values sink much faster than the intronic ones. These differences make it remarkable that the non-genic and intronic all-motifs trends be nonetheless very similar (e.g., both have an,0.2 R2at 0.3 GC; see also simulation results below). The
Figure 10. The non-randomness of motif preferences as a function of GC content.The correlation between GC3 in human genes and the sum of all theover-representations of tri- or dinucleotide motifs (left, right). The gray lines are the patterns from the null human data set. Note that using the sum of the absolute value ofeverymotif preference delivers lower R2s of 53.6 and 84.3%.