SPATIO-TEMPORAL DISTRIBUTION AND TARGET SPECIES IN A LONGLINE
FISHERY OFF THE SOUTHEASTERN COAST OF BRAZIL
Bruno L. Mourato1, 2*, Carlos A. Arfelli3, Alberto F. Amorim3, Humberto G. Hazin1, Felipe C. Carvalho4 and Fábio H. V. Hazin1
1Universidade Federal Rural de Pernambuco (UFRPE)
Departamento de Pesca e Aqüicultura Laboratório de Oceanografia Pesqueira
(Rua Dom Manoel de Medeiros, s/n, Dois Irmãos, 52171-900, Recife, PE, Brasil)
2
Universidade Federal de Pernambuco (UFPE) Departamento de Oceanografia
Bolsista do Conselho Nacional de Desenvolvimento Científico e Tecnológico (CNPq) (Cidade Universitária, 50670-901, Recife, PE, Brasil)
3
Instituto de Pesca/APTA/SAA/SP
(Av. Bartolomeu Gusmão 192, 11030-906 Santos, SP, Brasil)
4
University of Florida
Program of Fisheries and Aquatic Sciences, School of Forest Resources and Conservation (7922 NW 71st, Gainesville, FL 32653, USA)
*Corresponding author: [email protected]
A
B S T R A C TIn the present study, a cluster analysis, in relation to the species composition of the catches, was used to classify 6,486 fishing sets by a longline fleet based in São Paulo State, Brazil, from 1998 to 2006. Based on the proportions of 12 species and three broader species groups, three clusters were identified: C1: other fishes; C2: blue shark; C3: swordfish. Results indicated that the fleet targeted mainly blue shark and swordfish and also showed that the blue shark importance in this fishery has been growing progressively trough the years. Offshore areas were exploited mainly in the first and fourth quarters (from 2001 mainly), while the fishing effort was more concentrated near the continental shelf break, during the second and third quarters (for the whole period). The longline fishery based in Sao Paulo State changed fishing strategy to target different species which produced important changes in catch-per-unit-effort (CPUE) of the main species caught. Cluster analysis seems to have appropriately identified these changes over time, which is an important information, often missing in logbooks.
R
E S U M ONo presente estudo, uma análise de agrupamento foi utilizada para classificar 6.486 lances feitos pela frota espinheleira sediada no Estado de São Paulo, Brasil, de 1998 até 2006, em relação à composição das espécies presentes nas capturas. Baseado nas proporções de doze espécies e três grupos de espécies, três agrupamentos foram identificados: C1: outros peixes; C2: tubarão-azul; C3: espadarte. Os resultados indicaram que ao longo do período estudado, a frota direcionou suas capturas principalmente para o tubarão-azul e para o espadarte, além de terem evidenciado que a importância do tubarão-azul nessa pescaria tem crescido progressivamente ao longo dos anos. Áreas mais afastadas da costa foram exploradas principalmente no primeiro e quarto trimestres (em especial a partir de 2001), enquanto que um esforço de pesca mais concentrado perto da quebra da plataforma continental foi observado durante o segundo e terceiro trimestres (para todo o período estudado). A frota espinheleira sediada em São Paulo mudou a estratégia de pesca para diferentes espécies-alvo, o que produziu importantes mudanças nas principais espécies capturadas por esforço de pesca (CPUE). A análise de agrupamento parece ter identificado apropriadamente essas alterações ao longo do tempo, em relação às quais não há, em geral, qualquer informação nos mapas de bordo.
I
NTRODUCTIONThe tuna longline fishery in Brazil began in the early 1950s (MORAES, 1962), with the operation of chartered Japanese longliners based in Recife, Pernambuco State. A few years later, in 1958, Japanese chartered longliners began to operate also from the city of Santos, Sao Paulo State, fishing until 1961 (LIMA; WISE, 1963). In 1965/1966, a Brazilian company started a tuna longline fishery off southeast Brazil with two boats (ARFELLI; AMORIM, 1988). The fleet increased gradually up to 20 boats in 1998, then dropped to 14 vessels, in 2000 (AMORIM et al., 2002). At the beginning of the fishery, the national longliners based in Sao Paulo were equipped with a Japanese-type longline, targeting mainly tunas, which accounted for more than 50% of the total catch. From 1981 to 1994, however, sharks became the main target species, attaining 59% of the total catch in 1993. Since 1994, the Sao Paulo fleet has been operating with surface monofilament longlines, in order primarily to catch swordfish, although also achieving good catches of blue shark.
The targeting strategy of a given fishery is determined by a complex interaction of various factors, including environmental constraints, stock availability, market variability and advances in fishing technologies and methods (SALAS; GAERTNER, 2004). For that reason, the longline fleet based in Sao Paulo has changed target species through time. The targeting strategy, however, is one of the most important factors affecting CPUE (HE et al., 1997). Recently, clustering methods (e.g. cluster analysis) have been applied to fishing data, in order to determine the targeting strategy. These methods categorize fishing effort based on the proportion of several species in the catch, as a way to detect changes in targeting strategy (WU; YEH, 2001; ALEMANY; ÁLVAREZ, 2003; HAZIN et al., 2007a; HAZIN et al., 2007b). The aim of the present study was to categorize longline sets made by the Sao Paulo longline fleet using cluster analysis, from 1998 to 2006, as a way to characterize the target species, allowing for a subsequent generation of standardized CPUE series, essential information for most stock assessments.
M
ATERIAL ANDM
ETHODSThe data used in the present study were obtained from the logbooks of longliners based in Sao Paulo State (Santos city), made available by the Laboratório de Referência em Controle Estatístico da Produção Pesqueira Marinha do Instituto de Pesca / SAA / SP, through the ProPesq® system. Logbook data included a total of 6 486 sets, from 1998 through 2006, and contained vessel identification, fishing
location, starting and retrieval time of the longline sets, number of hooks deployed and the number of fish caught by species. The database included a total of 15 species or group of species (Table 1).
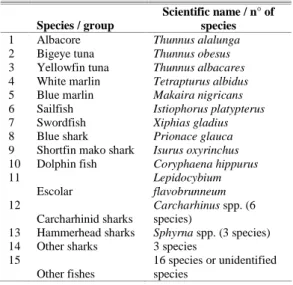
Table 1. Species or species groups caught by the Sao Paulo longline fleet between 1998 and 2006 used in the cluster analysis.
Species / group
Scientific name / n° of species
1 Albacore Thunnus alalunga 2 Bigeye tuna Thunnus obesus 3 Yellowfin tuna Thunnus albacares 4 White marlin Tetrapturus albidus 5 Blue marlin Makaira nigricans 6 Sailfish Istiophorus platypterus 7 Swordfish Xiphias gladius 8 Blue shark Prionace glauca 9 Shortfin mako shark Isurus oxyrinchus 10 Dolphin fish Coryphaena hippurus 11 Escolar Lepidocybium flavobrunneum 12 Carcharhinid sharks
Carcharhinus spp. (6 species)
13 Hammerhead sharks Sphyrna spp. (3 species) 14 Other sharks 3 species
15
Other fishes
16 species or unidentified species
cluster and compared among clusters. In order to evaluate the fleet dynamics in relation to the main fishing grounds, maps of the spatial distribution of the longline sets were created for each year and quarter. The fishing area was divided into five sub-areas as follows: 1: < 20°S; 2: 20°- 30°S / west of 40°W; 3: >30°S / west of 40°W; 4: 20°- 30°S / east of 40°W; and 5: >30°S / east of 40°W (Fig. 1).
Fig. 1. Distribution of fishing sets of the São Paulo longline fleet between 1998 and 2006 (n= 6,486) and division of fishing ground of the São Paulo longline fleet into 5 sub-areas. Sub-area 1: < 20°S; 2: 20°- 30°S / west of 40°W; 3: >30°S / west of 40°W; 4: 20°- 30°S / east of 40°W; and 5: >30°S / east of 40°W. The lines along the coast represent 1000 and 3000 m depth contours.
These sub-areas were divided based on the difference in oceanographic conditions. Sub-areas 1
and 2 are under the major influence of the Brazil current with warm waters. Sub-area 1 is rarely visited by the fleet in contrast with sub-area 2 that is the main fishing ground for this fleet. Sub-area 3 is characterized by the presence of a seasonal convergence zone between the Brazil Current and the Malvinas/Falkland Current (GARCIA, 1997). Sub-area 4 includes several shallow seamounts and oceanic islands, which are part of the Victoria-Trindade ridge. In sub-area 5 there is the Rio Grande Rise, a large seismic ridge located between the Mid-Atlantic Ridge and the Brazilian continental shelf, approximately 600 nautical miles off the southern Brazilian coast. Furthermore, sub-areas 2 and 3 are closer to shore, in contrast with sub-areas 4 and 5, further offshore. Box-plot distributions were illustrated by cluster of the fishing effort by the depth (m) of fishing location (obtained from the National Geophysical Data Center ETOPO5- Earth Topography), latitude and longitude at the beginning of each set; and soaking time (h) of the longline. Finally, the proportion of fishing sets by cluster, year, quarter, and sub-areas were presented.
R
ESULTSThe spatial distribution of the longline sets (Fig. 1) shows that the Sao Paulo fleet operated over a wide area of the southern Atlantic Ocean, ranging from approximately 12° to 37°S and from 18° to 51°W. Although the quarterly number of sets fluctuated markedly along the entire period, ranging from 56, in the first quarter of 2006, to 373, in the third quarter of 1999, the quarterly mean number of hooks per set varied little, ranging from 1 001, in the first quarter of 2000, to 1 150, in the first quarter of 2006 (Table 2).
Table 2. Number of fishing sets and mean number of hooks deployed per set of the Sao Paulo longline fleet between 1998 and 2006 by quarter and year.
Quarter 1 2 3 4 Total
Year Number
of sets
Hooks/ set
Number of sets
Hooks/ set
Number of sets
Hooks/ set
Number of sets
Hooks/ set
Number of sets
Hooks/ set
1998 142 1054 272 1086 326 1071 338 1108 1078 1084
1999 272 1082 284 1085 373 1050 221 1057 1150 1067
2000 180 1001 280 1038 275 1036 288 1081 1023 1043
2001 187 1101 169 1060 221 1042 206 1084 783 1071
2002 143 1130 176 1124 136 1091 98 1137 553 1120
2003 206 1096 145 1091 108 1062 98 1113 557 1091
2004 114 1112 177 1112 200 1119 133 1114 624 1115
2005 97 1145 113 1138 124 1089 123 1092 457 1114
2006 56 1150 82 1125 64 1078 59 1100 261 1113
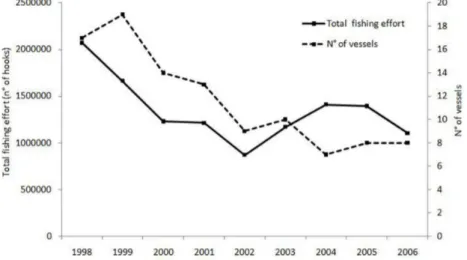
The total fishing effort (number of hooks) as well as the number of vessels presented a decreasing trend during the study period (Fig. 2).
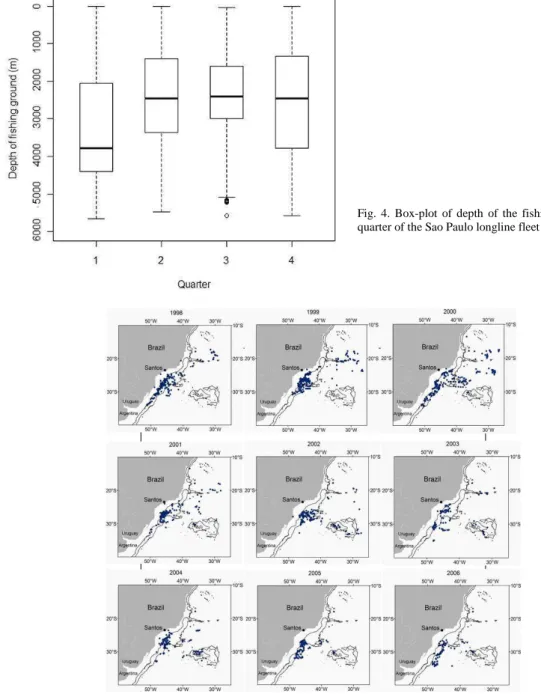
For the whole period of study, the Sao Paulo longline fleet operated mainly in offshore areas, during the first quarter of the year (Fig. 3), especially near the
Vitoria-Trindade seamount (close to 20°S/30°W). Since 2002 the fishermen have been operating more to the southeast, near the Rio Grande Rise (30°30’S/35°W) (Fig. 3). The mean depth of the location of fishing sets during this quarter was 3 800 m (Fig. 4).
Fig. 2. Annual number of vessels and total fishing effort of São Paulo longline fleet, between 1998 and 2006.
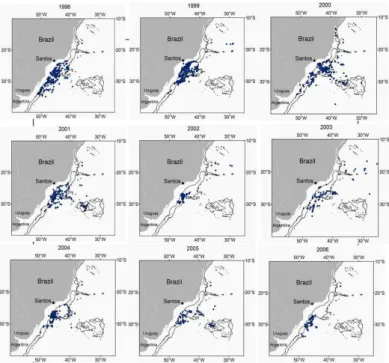
In the second quarter, the majority of fishing sets were distributed closer to the continental shelf break of Brazil, although some fishing took place in offshore areas (Fig. 5). The average depth of the fishing location of the sets made in this quarter was 2 500 m (Fig. 4).
The distribution of the fishing effort during the third quarter was similar to that of the second, with the majority of the sets being located near the shelf break (Fig. 6), which resulted in a similar mean depth (2 500 m) as in the second quarter.
Fig. 5. Spatial and temporal distribution of fishing sets of the Sao Paulo longline fleet during the second quarter (1998-2006). The lines along the coast represent 1000 and 3000 m depth contours.
During the fourth quarter, most of the fishing sets were also distributed near the shelf break, until 2001. Thereafter most of the fishing sets were
located near the Rio Grande Rise (Fig. 7). The average depth of the fishing sets was similar to those of the second and third quarters (2 500 m, Fig. 4).
Fig. 6. Spatial and temporal distribution of fishing sets of the São Paulo longline fleet during the third quarter (1998-2006). The lines along the coast represent 1000 and 3000 m depth contours.
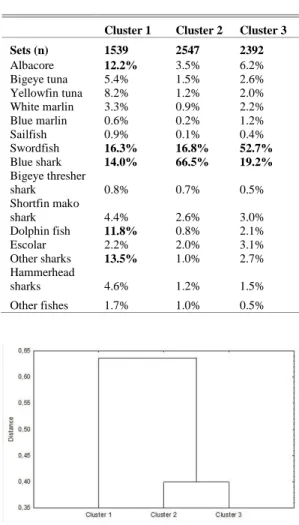
The cluster analyses resulted in the separation of the 6 486 sets into three different clusters (Table 3). Cluster 1, defined as "other fishes", was characterized by a multi-species targeting strategy, with relatively high catches of swordfish (16.3%), blue shark (14.0%), albacore (12.2%), carcharhinid sharks (13.5%) and dolphin fish (11.8%). Cluster 2 clearly grouped sets targeting blue shark (66.5%), although it also had a high percentage of swordfish (16.8%). Cluster 3 included those sets that primarily targeted swordfish (52.7%), although blue shark frequency was also high (19.2%). Based on the euclidean distance between cluster centroids, clusters 2 and 3 were closely related and well separated from cluster 1 (Fig. 8).
Table 3. Distribution of longline sets of the Sao Paulo longline fleet between 1998 and 2006 by cluster and species or species group (values over 10% are in bold).
Cluster 1 Cluster 2 Cluster 3
Sets (n) 1539 2547 2392
Albacore 12.2% 3.5% 6.2%
Bigeye tuna 5.4% 1.5% 2.6%
Yellowfin tuna 8.2% 1.2% 2.0%
White marlin 3.3% 0.9% 2.2%
Blue marlin 0.6% 0.2% 1.2%
Sailfish 0.9% 0.1% 0.4%
Swordfish 16.3% 16.8% 52.7%
Blue shark 14.0% 66.5% 19.2%
Bigeye thresher
shark 0.8% 0.7% 0.5%
Shortfin mako
shark 4.4% 2.6% 3.0%
Dolphin fish 11.8% 0.8% 2.1%
Escolar 2.2% 2.0% 3.1%
Other sharks 13.5% 1.0% 2.7% Hammerhead
sharks 4.6% 1.2% 1.5%
Other fishes 1.7% 1.0% 0.5%
Fig. 8- Dendrogram of three clusters of longline sets from the Sao Paulo longline fleet showing Euclidian distance between clusters.
The depths of the fishing locations of cluster 1 were much shallower (mean less than 2 000 m) than those of clusters 2 and 3, which had a mean value close to 3 000 m (Fig. 9). The mean soaking time, though, was not much different between clusters, fluctuating around 20 hours (Fig. 10).
Fig. 9. Box-plot of depth of the fishing ground, by cluster of the Sao Paulo longline fleet (1998-2006).
Fig. 10. Box-plot of soaking time of longline gear by cluster of the Sao Paulo longline fleet (1998-2006).
1999 and decreased thereafter. Finally, the blue shark cluster (2) increased continuously, since 1999, accounting for more than 70% in 2006 (Fig. 11A). The distribution of sets by quarter was also different for each cluster. Sets targeting blue shark were more frequent during the first and second quarters, while sets targeting swordfish were most common during winter months (third quarter). The frequency of sets included in cluster 1 was higher during the fourth quarter (Fig. 11B). The frequency of the swordfish cluster was highest (more than 50%) in sub-area 1, located in the northernmost part of the study area, from 10o to 20oS latitude, decreasing southeastward to a minimum of about 5%, in sub-area 5. The blue shark cluster showed an opposite behavior, with a frequency of less than 10% in area 1, increasing gradually to more than 90%, in sub-area 5. Cluster 1 was most common in sub-areas 1 and 3 (Fig. 11C). It is apparent that over the years there was a gradual change of preferred fishing grounds, from sub-areas 1 and 2, more visited in the earlier part of the studied period, to sub-areas 3 to 5, in more recent years, indicating a southeastward movement of the fleet (Fig. 11D).
D
ISCUSSIONThe change in the spatial distribution of fishing effort with time from 1998 to 2006, combined
with the variation in the proportion of each cluster by sub-area, explains the gradual change of cluster predominance throughout the period, from cluster 1, in 1998, then cluster 3, in 1999, and finally cluster 2, in the most recent years. It is also clear that the seasonal and spatial variation of set distribution of each cluster was largely determined by the seasonal availability of the target species, mainly swordfish and blue shark, which is directly related to their migratory movements and probably associated with oceanographic currents, such as the seasonal displacement of the Subtropical Convergence Zone (SCZ), off the Brazilian coast (MOURATO et al., 2008a; HAZIN; ERZINI, 2008; CARVALHO et al., 2011). The SCZ results from the convergence of the Brazil Current (warm water and nutrient poor) (SILVEIRA et al., 2000) and the Malvinas Current (cold water and nutrient rich) (GARCIA, 1997). The mixture of these water masses promotes an increase of phytoplankton biomass and a subsequent increase of the availability of prey such as squids, for both target species (ZAVALA-CAMIN, 1982; SANTOS; HAIMOVICI, 2001). The influence of the north portion of the SCZ, however, is most pronounced close to the southern coast of Brazil (OLSON et al., 1988), during the second and third quarters, which might explain the higher catches of swordfish, in sub-area 2, during the third quarter (MOURATO et al., 2007; HAZIN; ERZINI, 2008).
A proper identification of the spatial and temporal variation in the distribution of fishing effort is a key factor, not only to adequately compensate for its influence when standardizing CPUE, prior to its use in stock assessments (MAUNDER; PUNT, 2004), but also in the design of effective conservation and management measures (SALAS; GAERTNER, 2004). Such distribution evidently reflects fishermen’s behavior, which may strongly influence the apparent abundance of the species caught and due to, sometimes subtle, changes in targeting strategy. Ultimately, the movements of fishing fleets are determined by a multitude of factors, including distribution and availability of the target species, market value, operational costs (distance to fishing grounds), management regulations and environmental oscillations (WILLEN, 1979; HILBORN, 1985; LANE, 1988; HILBORN; WALTERS, 1992; GAERTNER et al., 1998; GAERTNER et al., 1999; WILLEN et al., 2002; SALAS; GAERTNER, 2004). Of these, the target species is certainly the most important one. The targeting strategy in any fishery tends to vary due to market changes, introduction of new fishing technologies and fish processing methods and equipment. Changes in targeting strategy may take place over time, from trip to trip, or even during a single trip, depending on market condition and the relative abundance of the primary target species. These changes directly influence catchability and consequently the estimation of the relative abundance of any given species in the fishery (RICKER, 1975).
The present results show that the Sao Paulo longline fleet has been targeting basically two species: the blue shark and the swordfish. The interest in blue shark catches has been primarily due to the increased demand for their fins, for export, and for their meat in local markets, while swordfish has been targeted due to its high price on international markets. The results also show that the importance of blue shark in this fishery has been growing progressively over time. The cluster analysis based on catch composition seems to have appropriately identified changes in the targeting strategy of the Sao Paulo fleet, which is important information, not often available in logbooks.
When critical aspects of fishing strategy are unknown, cluster methods have been used in other fisheries as an effective method to identify different targeting strategies (GAERTNER et al., 1998; HE et al., 1997; WU; YEH, 2001). Hazin et al. (2007a) employed a cluster analysis to characterize the fishing effort of the entire Brazilian longline fleet, in order to account for the targeting strategy in the standardization of CPUE series (e.g. swordfish, HAZIN et al., 2007b). This quantitative method is necessary, especially in multispecies fisheries because commercial fisheries data do not often provide enough information on fishing behavior and operations. Catch
composition is an end-product of fishing and contains valuable information on fishing operations for the identification of targeting strategies. The main advantage of such methods, instead of using the percentage of a single species as an expression of the targeting strategy, relies on the fact that they take the composition of all species in each set into consideration, thus providing a more reliable estimate of targeting.
The present study elucidated two aspects that assist in the understanding of the changes in targeting strategies and the spatio-temporal distribution of the fishing effort of the longline fleet based in Sao Paulo, Brazil. The first one is that in a fishery where no information about targeting strategy is available, the cluster analysis based on catch composition may provide a useful tool to classify the individual fishing sets in relation to the target species, allowing a subsequent generation of standardized CPUE series (e.g. MOURATO et al., 2008b; HAZIN et al., 2008, CARVALHO et al., 2010), an essential information for most stock assessment models. The second is the change in the spatio-temporal distribution of the fishing effort, combined with the variation of the proportion of each cluster by sub-area, indicating that the blue shark’s importance in this fishery has been growing progressively over time, mainly in offshore areas and in the first and fourth quarters of the year.
A
CKNOWLEDGEMENTSThe authors wish to thank to Marcelo R. Souza for the data processing and the Laboratório de Referência em Controle Estatístico da Produção Pesqueira Marinha do Instituto de Pesca/ SAA/ SP. The authors thank the anonymous referees for their constructive comments that helped to improve the manuscript. The present study was made possible by funding from the Secretaria Especial de Aqüicultura e Pesca da Presidência da Republica do Brasil (SEAP).
R
EFERENCESALEMANY, F.; ÁLVAREZ, F. Determination of effective fishing effort on hake, Merluccius merluccius, in mediterranean trawl fishery. Sci. Mar., v.67, p. 491-499, 2002.
AMORIM, A. F.; ARFELLI, C. A.; FAGUNDES, L. Pelagic elasmobranchs caught by longliners off southern Brazil during 1974-97: An overview. Mar. Fresh. Res., v. 49, n. 7, p. 621-632, 1998.
AMORIM, A. F.; ARFELLI, C. A.; BACILIERI, S. Shark data from Santos longliners fishery off southern Brazil (1971-2000). Col. Vol. Sci. Pap., ICCAT, v. 54, n. 4, p. 1341-1348, 2002.
ARFELLI, C. A.; AMORIM, A. F. Description of the Brazilian swordfish fishery in Santos. Col. Vol. Sci.
CARVALHO, F.; MURIE, D.; HAZIN, F. H. V.; HAZIN, H.; LEITE-MOURATO, B.; TRAVASSOS, P.; BURGESS, G. Catch rates and size composition of blue sharks (Prionace glauca) caught by the Brazilian pelagic longline fleet in the southwestern Atlantic Ocean. Aquat. Living Resour, 23: 373–385, 2010.
CARVALHO, F.; MURIE, D.; HAZIN, F. H.V.; HAZIN, H.; LEITE-MOURATO, B.; BURGESS, G. Spatial predictions of blue shark CPUE and catch probability of juveniles in the Southwest Atlantic. ICES J. Mar. Sci. 68(5): 901-910, 2011, GARCIA, C. A. E. Hydrographic Characteristics. In: SEELIGER, U.; ODEBRECHT, C.; CASTELLO, J. P. (Ed.). Subtropical Convergence
environments. The coast and sea in the southwestern
Atlantic. Germany: Springer, 1997. 308 p.
GAERTNER, D.; GAERTNER, J. C.; MARCANO, J.; PAGAVINO, M. Multivariate analysis of relationships between tuna catches and fishing strategies. Application to the Venezuelan purse seiners in the Caribbean Sea. ICCAT Tuna symposium, Col. Vol. Sci. Pap., ICCAT, v. 50, p. 628-636, 1998.
GAERTNER, D.; PAGAVINO, M.; MARCANO, J. Influence of fisher’s behaviour on the catchability of surface tuna school in the Venezuelan purse-seine fishery in the Caribbean Sea. Can. J. Fish. Aquat. Sci., v. 56, p. 394-406, 1999.
HAZIN, H. G.; ERZINI, K. Assessing swordfish distribution in the South Atlantic based on spatial predictions. Fish.
Res., v. 90, p. 45-55, 2008.
HAZIN, H. G.; HAZIN, F. H. V.; TRAVASSOS, P.; CARVALHO, F. C.; ERZINI, K. Fishing strategy and target species of the Brazilian tuna longline fishery, from 1978 to 2005, inferred from cluster analysis. Col. Vol.
Sci. Pap., ICCAT, v. 60, n. 6, p. 2029-2038, 2007a.
HAZIN, H. G.; HAZIN, F. H. V.; TRAVASSOS, P.; CARVALHO, F. C.; ERZINI, K. Standardization of swordfish CPUE series caught by Brazilian longliners in the Atlantic Ocean, by GLM, using the targeting strategy inferred by cluster analysis. Col. Vol. Sci. Pap., ICCAT, v. 60, n.6, p. 2039-2047, 2007b.
HAZIN, H. G.; MOURATO, B. L.; AMORIM, A. F.; ARFELLI, C. A.; HAZIN, F. H. V. Standardized CPUE of swordfish (Xiphias gladius) caught by tuna longliners operating off southern Brazil (1998-2006). Col. Vol. Sci.
Pap., ICCAT, v. 62, n. 4, p. 1175-1181, 2008.
HE, X.; BIGELOW, K. A.; BOGGS, C. H. Cluster analysis of longline sets and fishing strategies within the Hawaii-based fishery. Fish. Res., v. 31, p. 147-158, 1997. HILBORN, R. Fleet and dynamics individual variation: why
do some fishermen catch all the fish. Can. J. Fish.
Aquat. Sci., v. 42, p. 2-13, 1985.
HILBORN, R.; WALTERS, C. J. Quantitative Fisheries
Stock Assessment: Choice, Dynamics and Uncertainty,
1st ed. New York: Chapman and Hall, 1992.
JOHNSON, R. A.; WICHERN, D. W. Applied Multivariate
Statistical Analysis. 1st ed. Upper Saddle River, N.J.:
Prentice-Hall, 1988.
LANE, D. E. Investment decision making by fishermen. Can.
J. Fish. Aquat. Sci., v. 45, p. 782-796, 1988.
LIMA, F. R., WISE, J. P. A first examination of the abundance and distribution of yellowfin and albacore tuna in western tropical Atlantic 1957-61. Report of
FAO Fish. Rep., v. 3, n.6, p. 1515 - 1521, 1963.
MAUNDER, M. N.; PUNT, A. E. Standardizing catch and effort data: a review of recent approaches. Fish. Res., v. 70, p. 141-159, 2004.
MORAES, M. N. Development of the tuna fishery of Brazil and preliminary analysis of the first three years data.
Arq. Est. Biol. Mar. Univ. Ceará, Fortaleza, v. 2, n. 2,
p. 35 - 57, 1962.
MOURATO, B. L.; ANDRADE, H. A.; AMORIM, A. F.; ARFELLI, C. A. Standardized catch rate of swordfish (Xiphias gladius) caught by Santos longliners off southern Brazil (1971-2005). Col. Vol. Sci. Pap.,
ICCAT, v. 60, n. 6, p.1943-1952, 2007.
MOURATO, B. L.; AMORIM, A. F.; ARFELLI, C. A.; HAZIN, F. H. V.; HAZIN, H. G.; CARVALHO, F. C. Influence of environmental, spatial and temporal factors on blue shark, Prionace glauca, catch rate in the southwestern Atlantic ocean. Arq. Ciênc. Mar., v. 41, n. 2, p. 34-46, 2008a.
MOURATO, B. L.; HAZIN, H. G.; AMORIM, A. F.; ARFELLI, C. A.; HAZIN, F. H. V. Standardized CPUE of blue shark caught by São Paulo tuna longliners operating off southern Brazil (1998-2006). Col. Vol. Sci.
Pap., ICCAT., v. 62, n. 5, p. 1602-1609, 2008b.
OLSON, D. B.; PODESTÁ, G. P.; EVANS, R. H.; BROWN, O. B. Temporal variations in the separations of Brazil and Malvinas Currents. Deep Sea Res., v. 35, p. 1971-1990, 1988.
RICKER, W. E. Computation and interpretation of biological statistics of fish populations. Bull. Fish. Res. Bd. Can., n. 191, 382 p, 1975.
SALAS, S.; GAERTNER, D. The behavior dynamics of fishers: management implications. Fish. Fish., v. 5, p. 153-167, 2004.
SANTOS, R. A; HAIMOVICI, M. Cephalopods in the trophic relations off southern Brazil. Bull. Mar. Sci., v. 71, n. 2, p. 753-770, 2002.
SILVEIRA, I. C. A.; SCHMIDT, A. C. K.; CAMPOS, E. D. J.; GODOI, S. S.; IKEDA, Y. A Corrente do Brasil ao largo da costa leste brasileira. Rev. Bras. Oceanogr., v. 48, n. 2, p. 171-183, 2000.
WARD, J. H. Hierarchical grouping to optimize an objective function. J. Am. Stat. Assoc.,v. 58, p. 236-244, 1963. WILEN, J. E. Fisherman behavior and the design of efficient
fisheries regulation programs. J. Fish. Res. Board Can., v. 36, p. 855-858, 1979.
WILEN, J. E.; SMITH, M. D.; LOCKWOOD, D.; BOTSFORD, F. W. Avoiding surprises: incorporating fisherman behavior into management models. Bull. Mar.
Sci., v. 70, p. 553-575, 2002.
WU, C. L.; YEH, S. Y. Demarcation of operating areas and fishing strategies for Taiwanese longline fisheries in South Atlantic Ocean. Col. Vol. Sci. Pap., ICCAT, v. 52, p. 1933-1947, 2001.
ZAVALA-CAMIN, L. A. Distribución vertical y estacional de túnidos y otras especies pelágicas en el sudeste y sur del Brasil, obtenida por medio de contenido estomacal. Col. Vol. Sci. Pap., ICCAT, v. 17, n. 2, p. 439-443, 1982.