Artigo
*e-mail: [email protected]
BIOSORPTION AND REMOVAL OF CHROMIUM FROM WATER BY USING MORINGA SEED CAKE (Moringa
oleifera Lam.)
Ana Paula Meneghel*, Affonso Celso Gonçalves Jr., Leonardo Strey, Fernanda Rubio, Daniel Schwantes and Juliana Casarin
Centro de Ciências Agrárias, Universidade Estadual do Oeste do Paraná, Rua Pernambuco 1777, 85960-000 Marechal Cândido Rondon – PR, Brasil
Recebido em 14/11/12; aceito em 13/5/13; publicado na web em 17/7/13
This study evaluated the adsorption capacity of chromium from contaminated aqueous solutions by using Moringa oleifera Lam. seeds. Parameters such as solution pH, adsorbent mass, contact time between solution and adsorbent, isotherms, thermodynamic, kinetics, and desorption were evaluated. The maximum adsorption capacity (Qm) calculated to be 3.191 mg g−1 for the biosorbent. Activated carbon was used for comparison purposes in addition to the biosorbent. The best it was obtained by the Langmuir model for both adsorbents. The average desorption value indicated that both the biosorbent and activated carbon have a strong interaction with the metal. The results showed that the biosorbent has advantages owing to its low cost and eficiency in Cr3+ removal from contaminated waters.
Keywords: natural adsorbent; waters; desorption.
INTRODUCTION
Moringa, the only genus belonging to the Moringaceae family, consists of fourteen species; Moringa oleifera Lam. is the most widely known and used worldwide.1 In Brazil, the plant was introduced for
ornamental purposes and later came to be cultivated for its medicinal and industrial importance and high nutritional value. Moreover, oil extracted from moringa seeds is used in biodiesel production.2
Aside from these attractive features, the plant has an additional role: a byproduct known as moringa cake, obtained after oil is ex-tracted from the seeds, is used wastewater treatment.3
The use of alternative materials in retaining or removing pollu-tants from aqueous systems has been studied to lower the expenses of materials and to reduce the treatment of some wastes and conta-minated solutions.4
Activities such as electroplating and industries that process ma-terials such as leather, cement, steel, and fertilizer are responsible for releasing toxic heavy metals that can cause severe damages to human health and the environment.5 One such pollutant, chromium, and its
compounds persist in the environment in oxidization states of Cr3 +
and the more toxic Cr6+. 6,7
Although the trivalent form is less toxic, Cr3+ can be extremely
dangerous in higher concentrations. Moreover, this element is non--biodegradable in living tissues and is a known carcinogen.8,9
Many physical and chemical methods have been developed to remove heavy metals from solution such as ion exchange, chemical precipitation, and membrane separation; however, many of these process are expensive, have low selectivity and result in incomplete removal of pollutants.10
Adsorption has emerged as a very eficient process considered effective in removing heavy metals from contaminated aqueous solutions.11
For this technique, the most commonly used material is activated carbon, which is highly eficient in various situations.12 However, its
high cost often makes this material unfeasible for practical usage.5
For this reason, various low-cost adsorbents have gained
increasing attention. In particular, agroindustrial wastes are inexpen-sive and are easily purchased. These materials often do not require chemical or physical modiication for highly eficient pollutant re-moval even at low concentrations.13
The aim of this study was evaluate adsorption behavior in the removal of Cr3+ from a contaminated aqueous solution by using a
cake of moringa seeds under varied conditions of solution pH, ad-sorbent mass, contact time, and temperature of the system and the desorption process.
MATERIAL AND METHODS
Material
The moringa seeds were collected in the city of Uberlandia, MG, Brazil, and the fortiied solutions were prepared from salts of chromium chloride (CrCl3, Vetec, 97%) and distilled and deionized
water. The primary fortiied solution (stock) had a concentration of 1000 mg L−1.
All experiments and Cr3+ content determinations were conducted
at the Laboratory of Environmental and Instrumental Chemistry, lo-cated at Center of Agricultural Sciences, State University of Western Parana, Marechal Candido Rondon, PR, Brazil. Analyses by infrared spectroscopy (IR) and scanning electron microscopy (SEM) were performed by the Department of Chemistry, State University of Londrina, Londrina, PR, Brazil.
Cr3+ content determination was performed by atomic absorption
spectrometry, lame mode (FAAS),14 by using GBC 932 AA
equip-ment (Victoria, Australia) with chromium hollow cathode and deute-rium lamps for background correction operated under the conditions recommended by the manufacturer.
Preparation and characterization of adsorbent material
seed cake was obtained, and the material was dried at 70 ± 2 °C for 24 h to complete solvent evaporation. The biosorbent was sieved (14 mesh - Bertel) to standardize the particles; no chemical treatment was applied to the moringa seed cake.
Adsorbent characterization is important for understanding the behavior of the metal removal mechanism from the solid surface16
and for qualitative assessment of the main functional groups res-ponsible for the metal binding. IR studies were performed by using a spectrometer Infrared Spectrophotometer Shimadzu FTIR-8300 Fourier Transform in the region of 400-4000 cm−1 with
resolu-tion of 4 cm−1. The spectra were obtained by transmittance with
KBr pellets.
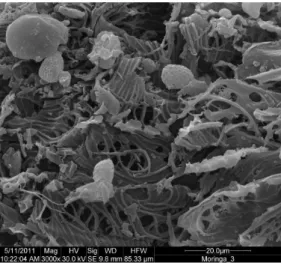
Through SEM, the surface morphology of the material was assessed under an FEI Quanta 200 microscope operating at 30 kV. The samples were deposited on a double-sided carbon tape attached to a sample platform and were subsequently coated with gold, using a sputter coater Baltec Scutter SCD 050, to a thickness of approxi-mately 30 nm.
In addition to the aforementioned tests, point of zero change (pHPZC) analysis was performed by adding 50 mg of biosorbent
in 50 mL of aqueous potassium chloride (KCl, Vetec, 99%) to 0.05-0.5 mol L−1 with initial pH values of 2.0–9.0 were adjusted
to 0,1 mol L−1 with hydrochloric acid solutions (HCl, Vetec, 37%)
and sodium hydroxide (NaOH, Vetec, 99%). After 24 h in contact at 200 rpm, the inal pH values of the system were obtained to produce a graph of the initial pH variation depending on the inal pH for each KCl concentration; the point at which pH variation was not observed corresponded to pHPZC.17
Studies of adsorption depending on the pH and adsorbent mass
The optimal conditions for adsorption were veriied by increa-sing the amounts of adsorbent material from 200 to 1200 mg under various pH conditions of 5.0, 6.0, and 7.0, according to the normal pH range of natural waters; these values were adjusted to 0.1 mol L−1
with solutions HCl (Vetec, 37%) or NaOH (Vetec, 99%). In this step, temperature, stirring speed, and contact time of the system were kept constant at 25 °C, 200 rpm, and 90 min, respectively.
The adsorbent material and 50 mL of aqueous solution fortiied with metal at 10 mg L−1 were placed in 125 mL Erlenmeyer lasks.
After 90 min, 10 mL aliquots were removed from this solution and were centrifuged at 3000 rpm (629.77 g) in a centrifuge (Biosystems HT-81C) for 5 min, and determination of Cr3+ concentration in the
solution was performed through FAAS.14
The amount of metal adsorbed on the balance was determined by using Equation 1:
Qeq = (C0 – Ceq)/mV, (1)
where Qeq is the amount of ions adsorbed in the equilibrium (mg g−1),
C0 is the metal initial concentration in the solution (mg L−1), Ceq is the
remaining concentration of the metal in the solution (mg L−1), V is
the volume of solution (L), and m is the mass of adsorbent used (g). The percentage of metal removed was calculated according to Equation 2:
%R = 100 – (Ceq/C0 . 100), (2)
where % R is the percentage of metal removal from solution by the moringa seeds cake, Ceq is the remaining concentration of the metal
in the solution (mg L−1), and C
0 is the initial concentration of metal
in the solution (mg L−1).
Studies of adsorption depending on contact time with adsorbent
For kinetic studies, the conditions were the same as those used for pH and mass. 400 mg of biosorbent was placed in 125 mL Erlenmeyer lasks containing a 50 mL of solution with metal at 10 mg L−1, and pH was adjusted to 5.0. Stirring speed and temperature
were kept constant at 200 rpm and 25 °C, respectively. Aliquots of 10 mL were taken from each lask in 20-min intervals for 3 h. After centrifugation (HT-81C Biosystems) at 3000 rpm (629.77 g) for 5 min, the Cr3+ concentration in the solution was determined
by FAAS.14
Pseudo-irst order, pseudo-second order, Elovich, and intraparticle diffusion kinetic models were used to analyze the data and to evaluate the predominant mechanism in the process.
Adsorption isotherms
Adsorption isotherms were obtained on the basis on optimal conditions observed in the previous experiments. Aliquots of 50 mL of solution containing 10–90 mg L−1 of the metal under pH 5.0
were placed in 125 mL Erlenmeyer lasks with 400 mg of adsorbent and stirred for one period of 120 min at 200 rpm. Subsequently, aliquots were removed and centrifuged (81C-HT Biosystems) at 3000 rpm (629.77 g) for 5 min to determine the metal concentra-tion in soluconcentra-tion by FAAS.14 Mathematical models of Langmuir,
Freundlich, and Dubinin–Radushkevich were used to interpret the experimental data.
Thermodynamics of adsorption
The inluence of temperature was evaluated in a Dubnoff bath (Nova Técnica, NT232) for ive conditions including 25, 35, 45, 55 and 65 °C with a system of 50 mL of fortiied solution at pH 5 with 50 mg L−1 metal concentration and 400 mg of adsorbent. The
system was maintained under stirring at 200 rpm for 120 min. After centrifugation of the aliquots, the Cr3+ concentration in the solution
was determined by FAAS.14
Desorption
The adsorbent material used in the isotherms was separated from the aqueous solution by iltration, washed with distilled and deionized water, and dried in oven at 60 ± 2 °C for 24 h. The mass of biosorbent obtained was placed in contact with 50 mL of HCl (Vetec, 37%) at 0.1 mol L−1 and stirred at 200 rpm at 25 °C for 120
min. After this step, the metal concentration in the solution was de-termined by FAAS, and the desorption percentage was calculated by Equation 3:
D = (Ceq(des.)/Ceq(ads.)) 100, (3)
where Ceq(des) (mg L−1) and Ceq(ads) (mg L−1) are the Cr3+
concentra-tion desorbed by moringa cake and that adsorbed at equilibrium, respectively.
Comparison with activated carbon
For comparison purposes, synthetic powdered activated carbon, which is a commercial adsorbent widely used for removing pollu-tants from wastewater,12 was employed under the same conditions
RESULTS AND DISCUSSION
Adsorbent characterization
Infrared spectroscopy studies were performed to qualitatively assess the main functional groups responsible for binding with chromium.
This method of analysis provides information about the functional groups that may be present in the structure of the adsorbents.18 As
shown in Figure 1 the adsorbent material showed the following bands: 3328, 2929, 1656, 1535 , 1421, 1234, and 1058 cm−1.
A strong and broad band at 328 cm−1 was observed that may be
attributed to the vibration stretching of the O–H bond of hydroxyl groups present in carbohydrates, fatty acids, proteins, units of lignin, cellulose, and absorbed water.19-21 A contribution in this region for
the vibration stretching of the N–H bond of amide groups may be related to the protein content in the moringa seeds.22 The band at
2929 cm−1 characterizes the stretching vibration of the C–H bond
of alkane groups.18 The bands at 1656–1421 cm−1 may be attributed
to the vibration stretching of C–O bond of amides and carboxylic groups; that at 1234 cm−1 can be associated with C–O stretching into
phenols.21 The band at 1058 cm−1, also ascribed to the stretching C–O,
suggests the presence of lignin, which includes compounds such as carboxyl groups that provide adsorption sites for the metal ions.23
Thus, the adsorption of metals by agricultural waste or industrial byproducts can be attributed to the presence of functional groups of lignin, proteins, carbohydrates, and phenolic compounds that contain carboxyl groups, hydroxyls, phosphates and aminos. Pagnanelli24 has
demonstrated that these groups have the ability to unite heavy metals to form complexes with ions in solution.
SEM analysis revealed that the biosorbent has a ibrous surface with spongy areas and an irregular and heterogeneous structure (Figure 2).
Such a structure facilitates the adsorption process, allowing for the conclusion that the material has a morphological proile suitable for retention of metal species.22
Figure 3 shows a graph developed for studying pHPZC for seed
cakes of M. oleifera Lam.
The results indicated a value of approximately 4.4 for moringa seed cake, (Figure 3); thus, in the case of heavy metals, cation ad-sorption is favored for pH levels with higher values than the pHPZC .25
pH dependency and adsorbent mass
The pH levels of the solution inluenced the adsorption properties, interfering at the biosorbent surface, and the behavior of the ionic
forms of the Cr3+ solution. As previously determined, the adsorption
of cations is favored for pH values higher than pHPZC.
Figure 4 shows that the highest rate of metal removal was achieved at pH 5.0. A smaller degree of removal at pH levels of 6.0 and 7.0 can be explained by the fact that the mobility of some elements may be reduced, which can lead to precipitation of insoluble forms26 at
pH values close to neutral. When low pH values are present, H+ and
Cr3+ ions compete for the active sites of adsorption.27
The high eficiency of Cr3+ removal at pH 5.0 indicates that in
the treatment of efluents with various pH ranges, a higher eficiency Figure 1. Infrared spectra of M. oleifera Lam. byproduct
Figure 2. Image by scanning electron microscopy (SEM) of the adsorbent material under 3,000 magnification
Figure 3. Plot of zero charge point (pHPZC) of M. oleifera Lam seeds cake
Figure 4. Effect of the adsorbent mass and solution pH on Cr3+ removal (C 0:
may not be achieved. However, even under such circumstances, lower adsorption rates of this metal will occur.
In addition, these results may be conirmed by the property of the adsorbent pHPZC, as previously mentioned.
Negligible changes in ion removal were observed when more than 400 mg of adsorbent was used; therefore, this amount was considered optimal for the conditions studied.
Witek–Krowiak10 reported that the number of active sites available
for biosorption depends on the mass of adsorbent used. In this case, for values above 400 mg, a decrease in the adsorbed amount can occur because of reductions in total surface area and therefore in the number of vacant sites available for the process due to agglomerate formation.
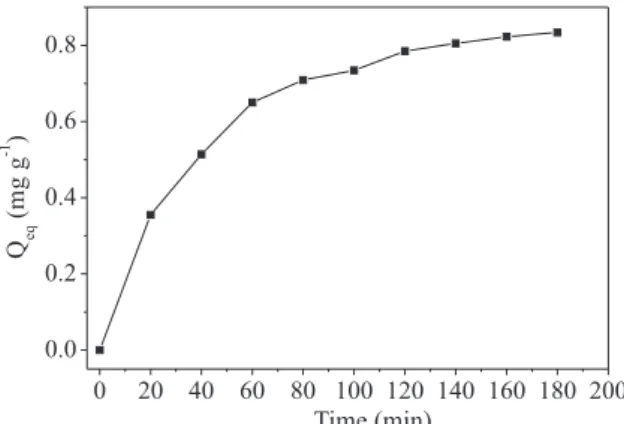
Influence of contact time
Figure 5 illustrates the amount of Cr3+ removed during the contact
time with the adsorbent.
The rate of removal increased gradually to reach equilibrium at 120 min of contact between the adsorbent and the aqueous solu-tion. The contact time required for the system to reach equilibrium depended on the nature of the biosorbent and amount of available adsorption sites.
To evaluate the kinetic mechanism controlling the biosorption process, the models of pseudo-irst order, pseudo-second order, Elovich, and intraparticle diffusion were applied.21
According to Liu and Liu,28 the pseudo-irst order model, also
known as the Lagergren Equation, is represented in its linear form by Equation 4:
log(Qeq – Qt) = log Qeq – (K1/2.303)t, (4)
where, Qeq and Qt is the amount adsorbed in the equilibrium and
a particular time (mg g−1), respectively, and K
1 is the constant for
pseudo-irst order (min−1). Q
eq and K1 values were calculated from
the graph of log (Qeq – Qt) by time.
The pseudo-second order model29 is expressed in the linear form
by Equation 5:
t/Qt = 1/K2Qeq2 + 1/Qeq, (5)
where K2 is the constant of pseudo-second order (g mg−1 min−1). The
values of K2 and Qeq were calculated from the graph of t/Qt by time.
The Elovich equation represented by Equation 6 is appropriate for systems with heterogeneous adsorption surfaces:
Qeq = A + B lnt, (6)
where A and B are constants; A represents the initial velocity of chemisorption and B is related to the extent of surface coverage and chemisorption activation energy.10 In addition, the intraparticle
diffusion mathematical model was employed:
Qeq = Kid t1/2 + Ci, (7)
where kid (g mol−1 min−1/2) is the constant of intraparticle diffusion
speed and Ci is related to thickness or resistance of the boundary layer
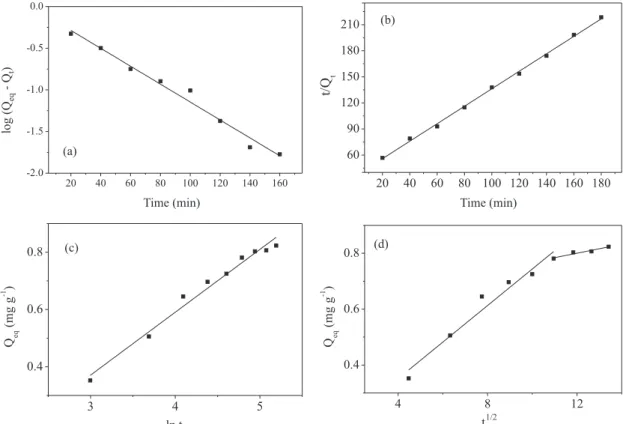
in the adsorption process.30The obtained graphics and the values of
pseudo-irst order, pseudo-second order, Elovich, and intraparticle diffusion models are illustrated in Figure 6 and in Table 1.
The graphs for the intraparticle diffusion model (6d) initially indicate that the adsorption process is controlled by more than one step; the irst portion of the line suggests diffusion by macropores, and the second suggests diffusion by mesopores and micropores of adsorbent.31 However, the R2 values for this mathematical model,
shown in Table 1 to be 0.954 and 0.914, indicate that this kinetic model does not effectively explain the observed adsorption process.
Table 1 shows the parameters set by the models studied. For the pseudo-irst order model, the values of Qeq (exp.) and
Qeq (calc.) did not approach each other even though the coeficient
of determination (R2) is considered satisfactory; thus, the best it
was obtained for the pseudo-second order model. The agreement between the high R2 value and the proximity between Q
eq (exp.) and
Qeq (calc.) suggests that the adsorption process has the characteristic
of chemisorption as a limiting step.29
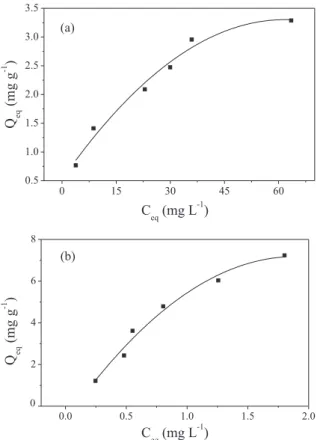
Adsorption isotherms
The distribution of ions between the solution and biosorbent describes the balance mechanism and can be expressed by one or more isotherm models to provide information about the nature of the adsorption process and the maximum capacity of the sorption material.26 The adsorption isotherms of the moringa seeds cake and
of activated carbon are illustrated in Figure 7.
The equilibrium isotherms show favorable behavior, indicating that the adsorption capacity increased with increasing solution con-centration. Adsorption data were adjusted according to mathematical models of Langmuir, Freundlich, and Dubinin–Radushkevich.
The mathematical model of Langmuir considers that the adsorbent has a deined number of active sites, each of which retains only one molecule of adsorbate. In this model, the adsorption energy does not dependent on the amount of material adsorbed, and adsorbed species do not react with each other; adsorption is restricted to the mono-layer.32 The linear expression of the model is given by Equation 8:
Ceq/Qeq = 1/Qmb + Ceq/Qm, (8)
where Ceq is the equilibrium metal concentration in the solution
(mg L−1), Q
eq the amount adsorbed at equilibrium per unit mass of
adsorbent (mg g−1), Q
m is the maximum adsorption capacity (mg g−1),
and b is the biosorption constant related to adsorbent–adsorbate interaction forces (mg L−1).
The essential feature of the isotherm can be expressed by the constant (dimensionless) known as the equilibrium parameter (RL),
expressed by Equation 9:
RL = 1/(1 + bC0), (9)
where C0 the highest initial concentration (mg L−1) and b the Langmuir
constant. If 0<RL<1, adsorption is considered favorable.33
The model proposed by Freundlich considers that the adsorption Figure 5. Amount of Cr3+ removed during contact time (C
0: 10 mg L −1; 400
of a given substance occurs in multiple layers and is therefore useful for describing adsorption in highly heterogeneous surfaces.34 The
linear expression of the model is expressed by Equation 10:
logQeq = logKf + (1/n)logCeq, (10)
where Kf is the Freundlich constant (mg L−1) and n (dimensionless)
indicates adsorption intensity, which is related to the heterogeneity of the adsorbent surface.35
The mathematical model of Dubinin–Radushkevich is based on the heterogeneity of the adsorbent surface. This model is widely used for differentiation of a process of physical or chemical nature5 and is
represented by Equation 11:
ln Qeq = ln Qd – Bde2, (11)
where Qeq is the amount of adsorbed metal per unit mass of
adsor-bent (g mol−1), Q
d is the adsorption capacity (mol L−1), and Bd is a
coeficient related to the sorption energy (mol2 J−2 ). is the Polanyi
potential (ε = RT ln (1 + 1/Ceq), in which R is the universal gas
constant (kJ mol−1 K−1), T is temperature (Kelvin), and C eq is the
equilibrium concentration in liquid phase (L mol−1).
The sorption energy (E (kJ mol−1)) is calculated by Equation 12:
(12) The parameters obtained by linearization according the mathe-matical models studied are shown in Table 2.
The coeficients of determination (R2) indicate that the adsorbents
show similarity among the models studied. That of Langmuir most effectively described the adsorption data for both materials such that the process occurred in the monolayer with sorption energy equiva-lent to all active sites.36 Moreover, the value of R
L indicates that the
adsorption was favorable in the concentration range studied for the materials prepared.37
The maximum adsorption capacity (Qm) calculated and estimated
was 3.191 mg Cr3+ per g of moringa seed cake, and the b value (or K L)
was 0.089 mg L−1. The activated carbon showed a maximum adsorption
capacity of 12.048 mg g−1, which, given its high cost, is an unfeasible
material for certain locations or treatments in larger quantities. The parameter n (Table 2) resulted in a value of 2.121 for moringa seed cake and 2.218 for activated carbon, suggesting that the metal Figure 6. Models of (a) pseudo-first order, (b) pseudo-second order, (c) Elovich, and (d) intraparticle diffusion for Cr3+ adsorption by moringa seeds cake
Table 1. Kinetic parameters obtained by studying Cr3+ adsorption on the seeds cake of M. oleifera Lam
Pseudo-first order Qeq (exp.) (mg g−1) Pseudo-second order
K1 (min−1) −0.025 0.824 K2 (g mg−1 min −1) 0.039
Qeq (cal.) (mg g−1) 0.995 Qeq (cal.) (mg g−1) 0.848
R2 0.979 R2 0.998
Elovich Intraparticle diffusion
A −0.288 Kt1 (mg g−1min−1/2) 0.065 Kt2(mg g−1min−1/2) 0.016
B 0.219 Ci1 (mg g−1) 0.090 Ci2 (mg g−1) 0.609
adsorption process on the adsorbent occurred favorably once when the n value was between 1 and 10. This result indicates adsorption of ions on the relatively strong biosorbent surface and suggests the presence of high energetic sites occupied irst by metals.10
The average sorption energy (E) obtained through the mathe-matical model of Dubinin–Radushkevich differentiates a process of chemical or physical nature.13 Values of E between 1 and 8 kJ mol−1
indicates physical adsorption; those higher than 8 kJ mol−1 indicate
that the process has a chemical nature.38 The values obtained in this
experiment were 10.000 kJ mol−1 for the biosorbent and 13.948 kJ
mol−1 for the activated carbon; therefore, the type of Cr3+ adsorption
on the adsorbent materials was likely chemisorption.
Thermodynamic parameters
The state of a solid–liquid system can be set by thermodynamic parameters.39 The Gibbs free energy (∆G), enthalpy (∆H), and entropy
(∆S) were calculated from Equations 13 and 14:
∆G = –RT lnK
d, (13)
ln Kd = ∆S/R – ∆H/RT, (14)
where Kd is the ratio between Qeq and Ceq, R is the universal gas
constant (8.314 J mol−1 K−1), and T is the temperature used in the
experiment (Kelvin). By means of the linear plot of ln Kd
depend-ing on the 1/T (where T is the temperature in Kelvin), the values of ∆H and ∆S can be estimated. The obtained line equation shows
a slope coeficient corresponding to ∆H/R and a linear coeficient
corresponding to ∆S /R.40
The increase in temperature caused an increase of the amount adsorbed at equilibrium, thus indicating an endothermic process.37
The values of thermodynamic parameters obtained for the adsorp-tion process at various temperatures are shown in Table 3.
Although positive ∆G values are indicated, it can be noted that
increases in temperature cause slight decreases of these values; hence, a tendency toward negative values can be observed. Farooq26
demonstrated that a decrease in ∆G values with increasing
tempera-ture results in an increase in process spontaneity.
Positive ∆H values conirm the endothermic nature of the
pro-cess37 and indicate increased randomness in the solid–solution
inter-face, which may occur because of the substitution of water molecules previously adsorbed by Cr3+ ions.13
Although an enthalpy value of less than 40 kJ mol−1 characterizes
a process of physical adsorption,41 the other observed parameters
such as the value of E and the best it obtained by the pseudo-second model conirm a chemical nature.
Desorption
Reversibility of the adsorption process, known as desorption, corresponds to the removal of metal binding sites on the surface of the adsorbent whereby H+ ions are expected to replace cations adsorbed
by the ion exchange mechanism.17 This process gains importance
when the employed adsorbent material has high costs relative to the lower costs generated by the process. Depending on the characteristics presented by the material, its reuse it can be ensured in other cycles of adsorptive process.42
The data obtained from the adsorption isotherms indicate an average Cr3+ removal percentage of 40.48%, of which approximately
16.43% was desorbed. For activated carbon, the average percentage of adsorption was 96.47%, of which approximately 4.33% was desorbed, indicating the occurrence of a strong interaction between the metal and adsorbent. Therefore, ion removal was dificult, which corrobo-rates the results of pseudo-second order model and the values of the Table 2. Parameters of the mathematical models of Langmuir, Freundlich,
and Dubinin-Radushkevich for Cr3+ adsorption on M. oleifera Lam. seeds cake and activated carbon
Parameters Adsorbent
M. oleifera Lam. Activated carbon
Langmuir
Qm (mg g−1) 3.191 12.048
b ou KL (L mg−1) 0.089 0.814
RL 0.120 0.013
R2 0.993 1.000
Freundlich
Kf (L mg−1) 0.457 5.162
n 2.121 2.218
R2 0.953 0.955
Dubinin-Radushkevich
Qd (mol g−1) 2.0 e−4 3.0 e−4
E (kJ mol−1) 10.000 13.948
R2 0.968 0.961
Table 3. Thermodynamic parameters for Cr3+ adsorption on the seeds cake of M. oleifera Lam
Temperature (°C)
Qeq (mg g−1)
∆G (kJ mol−1)
∆H (kJ mol−1)
∆S (J mol−1)
25 2.915 5.273 13.674 28.194
35 3.337 4.991
45 3.698 4.710
55 3.828 4.428
65 3.863 4.146
Figure 7. Adsorption isotherms of Cr3+ for (a) moringa seeds cake and (b)
ac-tivated carbon (C0: 10 to 90 mg L
E) obtained by the mathematical model of Dubinin–Radushkevich. Namasivayam43 determined that low rates of desorption suggest a
chemisorption process as the primary mode of pollutant removal by the adsorbent. Therefore, the percentage desorbed cannot be con-sidered satisfactory for a possible reuse of this biosorbent for new adsorption processes.
Other solutions such as sulfuric acid, acetic acid, and nitric acid can be utilized in the desorption process. Under acidic conditions, Cr3+ ions are displaced by protons in the active binding sites.42 In
addition to using other extraction solutions or even HCl in other concentrations, the incineration process is an alternative to the inal disposal of biosorbent containing this contaminant.
Owing to the low cost and biodegradable nature of the biosorbent, in addition to its abundance after an appropriate treatment such as incineration, the resulting volume of the adsorbent may be introduced in the composition of concrete, bricks, and ceramics. Such usage reduces costs and yields source material with superior mechanical properties.44 However, such processes may emit toxic gases into the
environment.
Therefore, a new cost-effective and eficient system for contami-nated water body treatment is necessary to appropriately dispose of waste containing toxic heavy metals from the adsorption processes.
CONCLUSIONS
It can be concluded that moringa seed cake satisfactory removes Cr3+ from contaminated solutions.
The obtained results of the pseudo-second order model and the E value indicate that the adsorption process are chemical in nature.
The best it was observed by the mathematical model of Langmuir for both adsorbents used, demonstrating monolayer adsorption with maximum adsorption capacities (Qm) of 3.191 mg g−1 and 12.048 mg
g−1 for the biosorbent and activated carbon, respectively. Owing to its
low cost, high availability, and biodegradable nature, this byproduct can be considered a viable alternative for the treatment of contami-nated aqueous solutions.
ACKNOWLEDGEMENTS
The authors would like to thank the Araucaria Foundation–SETI/ PR for funding through the Research Productivity Scholarship. Thanks are also extended to the Brazilian National Counsel of Technological and Scientiic Development (CNPq) and the Brazilian Ministry of Science and Technology (MCTI) for funding through the project REPENSA.
REFERENCES
1. Anwar, F.; Latif, S.; Ashraf, M.; Gilani, A. H.; Phytotherapy Research
2007, 21, 17.
2. Oliveira, J. T. A.; Silveira, S. B.; Vasconcelos, I. K. M.; Cavada, B. S.; Moreira, R. A.; J. Sci. Food Agric. 1999, 79, 815.
3. Bhatti, H. N.; Mumtaz, B.; Hanif, M. A.; Nadeem, R.; Process Biochem. 2007, 42, 547.
4. Oliveira, E. A.; Montanher, S. F.; Andrade, A. D.; Nóbrega, J. A.; Rollemberg, M. C.; Process Biochem. 2005, 40, 3485.
5. Rao, R. A. K.; Rehman, F.; J. Hazard. Mater. 2010, 181, 405. 6. Nomanbhay, S. M.; Palanisamy, K.; Electron. J. Biotechnol. 2005, 8, 43. 7. Vieira, M. G. A.; Oisiovici, R. M.; Gimenes M. L.; Silva, M. G. C.;
Bioresour. Technol. 2008, 99, 3094.
8. Huang, X.; Liao, X. P.; Shi, B.; J. Hazard. Mater. 2010, 173, 33. 9. Lodi, A.; Soletto, D.; Solisio, C.; Converti, A.; Chem. Eng. J. 2008, 136,
151.
10. Witek-Krowiak, A.; Szafran, R. G.; Modelski, S.; Desalination 2011,
265, 126.
11. Dabrowski, A.; Adv. Colloid Interface Sci. 2000, 93, 135. 12. Hsieh, C. T.; Teng, H.; Carbon 2000, 38, 863.
13. Singha, B.; Das, K. S.; Colloids Surf., B 2011, 84, 221.
14. Welz, B.; Sperling, M.; Atomic absorption spectrometry, 2th ed., Weinheim: Wiley-VCH, 1999.
15. IUPAC - International Union Pure and Applied Chemistry. Standard methods for the analysis of oils, fats and derivatives: method 1121; Paquot C.; Haufenne A., eds; Determination of moisture and volatiles matter content. DC: Oxford, 1988.
16. Wan Ngah, W. S.; Hanaiah, M. A. K. M.; J. Environ. Sci. 2008, 20, 1168.
17. Mimura, A. M. S.; Vieira, T. V. A.; Martelli, P. B.; Gorgulho H. F.; Quim. Nova 2010, 33, 1279.
18. Barbosa, L. C. A. Infrared spectroscopy for characterization of organic compounds, Ed. UFV: Viçosa, 2007, 189 p.
19. Stuart, B. H.; Infrared Spectroscopy: Fundamentals and applications, 1th ed, John Wiley and Sons, Inc.: West Sussex, 2004, 224p.
20. Gonçalves Jr., A. C.; Nacke, H.; Fávere, V. T.; Gomes, G.D.; Quim. Nova
2010, 33, 1047.
21. Han, R.; Zhang, L.; Song, C.; Zhang, M.; Zhu, H., Zhang, L.; Carbo-hydr. Polym. 2010, 79, 1140.
22. Araújo, C. S. T.; Alves, V. N.; Rezende, H. C.; Almeida, I. L.; de As-sunção, R. L.; Tarley, C. R.; Segatelli, M. G.; Coelho, N. M.; WaterSci. Technol. 2010, 62, 198.
23. Guo, X.; Zhang, S.; Shan, X.; J. Hazard. Mater. 2008, 15, 134. 24. Pagnanelli, F.; Mainelli, S.; Veglio, F.; Toro, L.; Chem. Eng. Sci. 2003,
58, 4709.
25. Alves, V. N.; Mosquetta, R.; Coelho, N. M. M.; Bianchin, J. N.; Roux, K. C. P.; Martendal, E.; Carasek, E.; Talanta 2010, 80, 1133.
26. Farooq, U.; Khan, M. A.; Athar, M.; Kozinski, J. A.; Chem. Eng. J. 2011,
71, 400.
27. Blázquez, G.; Hernáinz, F.; Calero, M.; Martín-Lara, M. A.; Tenorio, G.;
Chem. Eng. J. 2009, 148, 473.
28. Liu, Y.; Liu, Y. J.; Sep. Purif. Technol. 2008, 61, 229. 29. Ho, Y. S.; Mckay, G.; Process Biochem. 1999, 34, 451.
30. Önal, Y.; Akmil- Başar, C.; Eren, D.; Sarici-Özdemir, Ç, Depci, T., Y.; J. Hazard. Mater. 2006, 128, 150.
31. Srivastava, V. C.; Swamy, M. M.; Mall, I. D.; Prasad, B.; Mishra, I. M.;
Colloids Surf., A 2006, 272, 89.
32. Limousin, G.; Gaudet, J. P.; Charlet, L., Szenknect, S.; Barthès, V., Krimissa, M.; Appl. Geochem. 2007, 22, 249.
33. Tagliaferro, G. V.; Pereira, P. H. F.; Rodrigues, L. A.; Silva, M. L. C. P.;
Quim. Nova 2011, 34, 101.
34. Deliyanni, E. A.; Peleka, E. N.; Lazaridis, N. K.; Sep. Purif .Technol. 2007, 52, 478.
35. Fávere, V. T.; Riella, H. G.; Rosa, S.; Quim. Nova 2010, 33, 1476. 36. Kalavanthy, M. H.; Miranda, L. R.; Chem. Eng. J. 2010, 158, 188. 37. Rodrigues, L. A.; Silva, M. L. C. P.; Quim. Nova 2009, 32, 1206. 38. Onyango, M. S.; Kojima, Y.; Kumar, A.; Kuchar, D.; Kubota, M.;
Matsuda, H.; Sep. Sci. Technol. 2006, 41, 683.
39. Soares, M. R.; Alleoni, L. R. F.; Casagrande, J. C.; Quim. Nova 2005,
28, 1014.
40. Hameed, B. H.; Ahmad, A. A.; Aziz, N.; Chem. Eng. J. 2007,133, 195. 41. Dos Santos, V. C. G.; Tarley, C. R.; Caetano, J.; Dragunski, D. C.;
Water Sci.Technol. 2010, 62, 457.
42. Gundogdu, A.; Ozdes, D.; Duran, C.; Bulut, V. N.; Soylak, M.; Senturk, H. B.; Chem. Eng. J. 2009, 153, 62.
43. Namasivayam, C.; Prabha, D. Kumutha, M.; Bioresour. Technol. 1998,
64, 77.