Article
L-Ascorbic Acid Determination in Pharmaceutical Formulations Using a Biosensor Based on
Carbon Paste Modified with Crude Extract of Zucchini (Cucurbita pepo)
Orlando Fatibello-Filho* and Iolanda da C. Vieira
Departamento de Química, Centro de Ciências Exatas e de Tecnologia, Universidade Federal de São Carlos, CP 676, 13.560-970, São Carlos - SP, Brazil
Um biossensor baseado em pasta de carbono modificada com extrato bruto de abobrinha (Cucurbita pepo) como fonte de peroxidase é proposto para a determinação de ácido L-ascórbico em formulações farmacêuticas. Esta enzima na presença de peróxido de hidrogênio catalisa a oxidação de hidroquinona a p-quinona cuja redução eletroquímica a hidroquinona foi obtida em potencial de pico de -0,14V. Assim, quando ácido L-ascórbico é adicionado à solução, este ácido pode reduzir p-quinona quimicamente para hidrop-quinona e/ou reduzir peróxido de hidrogênio, decrescendo a corrente de pico proporcionalmente ao aumento de sua concentração. A recuperação do ácido L-ascórbico em cinco amostras variou de 98,1 a 102,1% e uma curva analítica linear no intervalo de concentração de ácido ascórbico de 2,0x10⁻⁴ a 5,5x10⁻³ mol L-1 (r=0.9992) foram obtidos. O limite de detecção foi 2,2x10⁻⁵ mol L-1 e o desvio padrão relativo foi <1,3% para solução de ácido ascórbico 4,0x10⁻³
mol L-1, hidroquinona 7,0x10⁻³ mol L-1 e peróxido de hidrogênio 2,0x10⁻⁴ mol L-1. Os resultados obtidos para o ácido L-ascórbico em formulações farmacêuticas usando o biossensor proposto e o procedimento da Farmacopéia estão em concordância a um nível de confiança de 95%.
A biosensor based on carbon paste modified with crude extract of zucchini (Cucurbita pepo) as a source of peroxidase is proposed for determining L-ascorbic acid in pharmaceutical formula-tions. This enzyme in the presence of hydrogen peroxide catalyses the oxidation of hydroquinone to p-quinone whose electrochemical reduction back to hydroquinone was obtained at peak poten-tial of -0.14V. Thus, when L-ascorbic acid is added to the solution, this acid can reduce chemically p-quinone to hydroquinone and/or reduce hydrogen peroxide, decreasing the peak current ob-tained proportionally to the increase of its concentration. The recovery of L-ascorbic acid from five samples ranged from 98.1 to 102.1% and a rectilinear calibration curve for L-ascorbic acid concentration from 2.0x10⁻⁴ to 5.5x10⁻³ mol L-1 (r=0.9992) was obtained. The detection limit was
2.2x10⁻⁵ mol L-1 and relative standard deviation was < 1.3% for a solution containing 4.0x10⁻³
mol L-1 L-ascorbic acid, 7.0x10⁻³ mol L-1 hydroquinone and 2.0x10⁻⁴ mol L-1 hydrogen
perox-ide. The results obtained for L-ascorbic acid in pharmaceutical formulations using the proposed biosensor and those obtained using the Pharmacopeia method are in agreement at the 95 % confidence level.
Keywords: L-ascorbic acid, carbon paste biosensor, peroxidase, zucchini (Cucurbita pepo)
*e-mail: [email protected]
Introduction
L-ascorbic acid (vitamin C) is a γ-lactone that is syn-thesized by plants and almost all animals except primates and guinea pigs. Its prolonged deficiency in the diet of humans results in the disease know as scurvy which is caused by the impairment of collagen formation. Scurvy generally results from a lack of fresh food1.
Plant tissue2-5 and crude extract6-12 have been found
to be effective catalytic materials in the enzymatic
method. This kind of biocatalytic material maintains the enzyme of interest in the natural habitat which can re-sult in a considerable stabilization of enzyme activity (long lifetimes), high enzymatic activity, low cost, ease of preparation and in several materials the presence of the enzyme cofactor3.
Many enzymatic procedures have been proposed in the literature13-17 for determining L-ascorbic acid using
ascorbate oxidase (E.C. 1.10.3.3.). This enzyme catalyses
A slice of squash (Cucurbita pepo) or cucumber (Cucumis
sativus) mesocarp (0.3 mm thick) supported in a polyamide
net was placed over a PTFE membrane of an oxygen elec-trode for the monitoring of L-ascorbic acid oxidation by the plant-tissue ascorbate oxidase13 An amperometric sensor for
L-ascorbic acid has been made by immobilization of
ascor-bate oxidase in the reconstituted collagen membrane and
mounting the enzyme-collagen membrane onto a Clark oxy-gen electrode. This enzyme was purified from the cucumber peel (Cucumis sativas) and the response of the electrode was linear from 5.0x10⁻⁵ to 5.0x10⁻⁴ mol L-1 L-ascorbic acid14.
Cucumber (Cucumis sativus L.) juice has been used as the carrier solution in an amperometric flow-injection sys-tem for the determination of L-ascorbic acid15. The deter-mination time was 1 min and the calibration graph was rectilinear in the L-ascorbic acid concentration range from 5.0x10⁻⁴ to 7.0x10⁻³ mol L-1. L-ascorbic acid was
deter-mined by concentration-step amperometry using a thin layer of carbon felt impregnated with cucumber juice as an enzyme solution of ascorbate oxidase16. The dilute fruit juice was added on top of the carbon felt and the decreases of current peak caused by the enzymatic reac-tion was measured. The peak current was proporreac-tional to the concentration of L-ascorbic acid in the concentration range 2.5x10⁻⁴ - 1.6x10⁻³ mol L-1.
A biosensor for L-ascorbic acid based on enzyme ki-netics of ascorbate oxidase was developed. The enzyme was extracted from Cucurbita maxima and immobilized by covalent bonding, using glutaraldehyde as a bifuncional agent, on alkylamine glass beads, with and without en-zyme active site protection. A low-cost, home-made oxy-gen electrode was applied as a transductor17.
In this work, a biosensor is proposed for determining L-ascorbic acid in pharmaceutical formulations.
Peroxi-dase in the presence of hydrogen peroxide catalyses the
oxidation of hydroquinone to p-quinone whose electro-chemical reduction back to hydroquinone was obtained at peak potential of -0.14V. Thus, when L-ascorbic acid is added to the solution, this acid can reduce chemically p-quinone to hydrop-quinone and/or reduces hydrogen per-oxide, decreasing the peak current obtained proportion-ally to the increase of L-ascorbic acid concentration.
Experimental
Reagents and solutions
All reagents were of analytical-reagent grade and all solutions were prepared with water from a Millipore (Bedford, MA, USA) Milli-Q system, Model UV Plus Ultra-Low Organics Water.
Guaiacol, Nujol and hydrogen peroxide were pur-chased from Aldrich (Milwaukee, WI, USA). Acetylsali-cylic acid, L-ascorbic acid, citric acid, glucose, lactose, magnesium stearate, oxalic acid, poly(ethylene glycol) 1500, sodium chloride, starch, sucrose, tartaric acid were purchased from Sigma Co (St. Louis, MO, USA) and graph-ite powder (grade # 38) were purchased from Fisher.
A 2.5x10⁻² mol L-1 L-ascorbic acid stock solution was prepared daily in 0.1 mol L-1 phosphate buffer of pH 6.5
previously de-oxygenated with nitrogen and standardized by a conventional method18. Reference solutions from
1.9x10⁻⁴ to 5.4x10⁻³ mol L-1 were prepared from the stock solution in 0.1 mol L-1 phosphate buffer of pH 6.5.
Five Brazilian pharmaceutical formulations contain-ing L-ascorbic acid such as Cebion (Merck, Rio de Janeiro, RJ), Redoxon (Roche, Rio de Janeiro, RJ), Energil C (Legrand, São Paulo, SP), Vitamina C (Schering-Plough, Rio de Janeiro, RJ) and Aspirina C (Bayer, São Paulo, SP) were obtained from a local drug store and analyzed using the proposed biosensor.
The Polyclar SB-100 used as a protective and/or stabi-lizer agent in the crude extract preparation was kindly donated by GAF (Wayne, NJ, USA).
Healthy zucchini (Cucurbita pepo), a variety of squash with a long, narrow shape and a greenish rind, purchased from a local producer, was selected, washed, hand-peeled, chopped, cooled in a refrigerator at 4oC and used as a
source of peroxidase (donor; hydrogen peroxide oxi-doreductase, POD; E.C.1.11.1.7.).
Instrumentation
A DuPont Instruments (Newtown, CT, USA) Model RC-5B centrifuge, provided with a Model SS-34 rotor, was used in the preparation of the crude extract of the zucchini root. A Hewlett-Packard (Boise, ID, USA) Model 8452A UV-visible spectrophotometer with a quartz cell (optical path of 1 cm) was used in peroxidase activity measurement and total protein determination.
All experiments were performed in a 15 mL electro-chemical cell. A three-electrode assembly incorporating a crude extract-modified carbon paste electrode (biosensor), an Ag/AgCl reference electrode and a platinum auxiliary electrode was used in all measurements. Cyclic voltam-metric and amperovoltam-metric measurements were performed with an EG&G PAR, Model 264A Polarographic Analyzer/ Stripping voltammeter.
Zucchini crude extract preparation
phosphate buffer (pH 6.5) containing 2.5 g of Polyclar
SB-100 for 2 min at 4-6 oC. The homogenate was rapidly
filtered through four layers of cheesecloth and centrifuged at 13,500 rpm for 15 min at 4oC. The resulting supernatant was stored at this temperature in a refrigerator and used as the enzymatic source after the determination of the
per-oxidase activity and total protein.
Peroxidase activity and total protein determinations
Peroxidase (POD) activity present in the crude extract
was determined in triplicate by measurement of the absor-bance at 470 nm of tetraguaiacol12,19 produced by the
re-action between 0.2 mL of supernatant solution, 2.7 mL of 0.05 mol L-1 guaiacol solution and 0.1 mL of 10.0 mmol L-1
hydrogen peroxide solution in 0.1 mol L-1 phosphate buffer (pH 6.5) at 25oC. The initial rate of guaiacol peroxidation
reaction was a linear function of time for 1.5-2.0 min. One activity unit is defined as the amount of enzyme that causes an increase of 0.001 absorbance per minute under the ex-perimental conditions described previously.
Total protein concentration was determined in tripli-cate using bovine serum albumin as standard20.
Biosensor construction
A mixture of 1,400 units of peroxidase mg-1 protein of
zucchini root crude extract with 375 mg of graphite powder (75 % m/m) was initially prepared in a mortar. This mixture was dried for 12 h under reduced pressure in a desiccator at 4oC. Subsequently 125 mg of mineral oil
(25% m/m) was added into this powder and mixed in a mortar for at least 20 min to produce the final paste. The modified carbon paste was packed into the tip of a 1 mL plastic syringe and a platinum soldered to a copper wire was used to provide the external electric contact6. Other enzyme concentrations varying from 700 to 3,500 units of
peroxidase mg-1 protein and other carbon paste composi-tions containing graphite powder from 65 to 75 % m/m and mineral oil amounts ranging from 35 to 25 % m/m in that activity range of POD were also prepared.
Analysis of pharmaceutical samples
The contents of 10 tablets were well mixed; from the fine powder an accurately weighed portion was taken and dissolved in 0.1 mol L-1 phosphate buffer solution (pH
6.5) previously degased with nitrogen.
All experiments were performed at room temperature
in a 0.1 mol L-1 phosphate buffer (pH 6.5) solution
containing 2.0x10⁻² mol L-1 hydrogen peroxide and
7.0x10⁻³ mol L-1 hydroquinone. Aliquots of pharmaceutical
samples were added into a 15 mL thermostated glass cell, homogenized with the aid of a magnetic stirrer, degased with nitrogen for 1 min and the amperometric measure-ments were performed at -0.14 V and the resulting cathodic current was displayed on the x-t recorder.
Results and Discussion
Study of the enzymatic processReactions catalyzed by enzymes have long been used for analytical purposes in the determination of different analytes, such as substrates, inhibitors and also the enzymes. Biosensors, which combine the selectivity of enzymes with the high sensitivity of electrochemical measurements, pro-vide an excellent tool for analytical chemistry21.
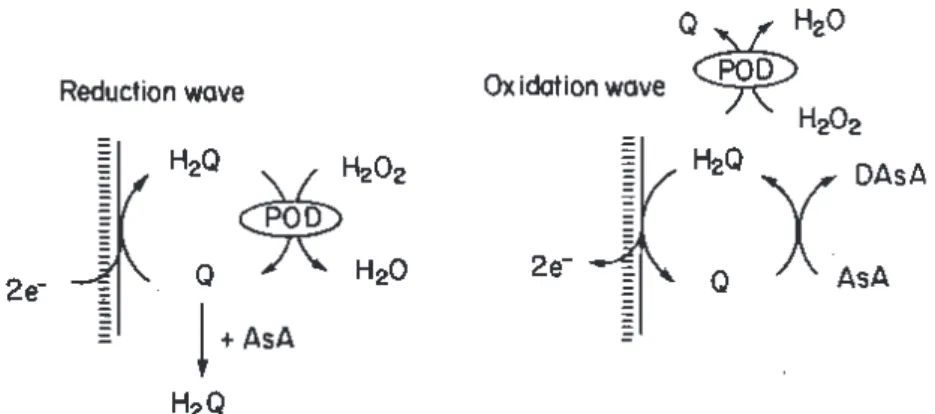
Figure 1 shows a scheme of the enzymatic process be-tween hydroquinone (H2Q), hydrogen peroxide (H2O2), L-ascorbic acid (AsA) and peroxidase (POD) of the crude extract incorporated into the carbon paste electrode. For the reduction wave, hydrogen peroxide oxidizes the na-tive form of POD in a single two-electron process resulting in the oxidized form of POD (denoted compound I) and water22 Thus, hydroquinone is enzymatically oxidized to p-quinone (Q) which at a potential of - 0.14V was electro-chemically reduced to hydroquinone providing a peak current related to its concentration. Following this reduc-tion wave scheme, when L-ascorbic acid solureduc-tion is added to the solution, this acid can reduce chemically p-quinone to hydroquinone23 and/or reduce hydrogen peroxide to water with dehydroascorbic acid (DAsA) formation24 (not
shown in this Figure) decreasing the peak current propor-tionally to the increase of L-ascorbic acid concentration. A scheme which explains the oxidation wave is also pre-sented in this figure and will not be discussed once it was not used in the ascorbic acid detection.
Effect of paste composition
The effect of the graphite powder, containing 1,400 units of peroxidase mg-1 of protein varying from 65 to 75% (m/m)
and Nujol from 35 to 25% (m/m) on the biosensor response using 4.0x10⁻³ mol L-1 hydroquinone was investigated. The
best carbon paste composition was found using 0.375 g of graphite powder containing zucchini crude extract (75% (m/m)) and 0.125 g of Nujol (25% (m/m)).
The effect of enzyme concentration from 700 to 3,500 units peroxidase mg-1 of protein in the 75:25 % m/m of graphite powder plus crude extract/Nujol, respectively, on the biosensor response was also studied. The analytical signals (cathodic peak currents) for 4.0 x 10⁻³ molL-1
concentration used up to 1,400 units peroxidase mg-1 pro-tein. Thus, a concentration of 1,400 units mg-1 protein
POD was used in all biosensors.
Effect of pH and hydrogen peroxide concentration
The effect of pH in the range from 3.0 to 8.0 on the electrode response of a 4.0x10⁻³ mol L-1 hydroquinone solution was also investigated. A maximum current (maxi-mum signal/noise ration) is obtained at a pH range of 6.0-7.0. Therefore, a pH of 6.5 was used in the other experi-ments, since L-ascorbic acid is more stable at this pH.
The effect of varying hydrogen peroxide concentra-tion from 5.0x10⁻⁴ to 1.2x10⁻² mol L-1, for 4.0x10⁻³ mol L-1 hydroquinone and 4.0x10⁻³ mol L-1 ascorbic
acid solution on the biosensor response was also evalu-ated. The optimum hydrogen peroxide concentration found was 2.0x10⁻³ mol L-1. This concentration was then used.
Effect of dissolved oxygen
The effect of dissolved oxygen on the biosensor re-sponse for 4.0x10⁻³ mol L-1 hydroquinone solution, 2.0x10⁻³ mol L-1 hydrogen peroxide solution and
L-ascor-bic acid ranged from 2.0x10⁻⁴ to 5.5x10⁻³ mol L-1 was evaluated in an air-saturated and degased conditions. From the results obtained, it was found that oxygen has very little effect on the biosensor response in the L-ascorbic acid concentration range studied for recently prepared ascorbic acid solutions. As it is known, solutions of L-ascorbic acid are highly susceptible to oxidation by dis-solved oxygen and degrade in a short period of time in alkaline solution25,26. Thus, in order to obtain a good compromise between stability and performance of the bio-sensor, measurements were made in phosphate solution (pH 6.5), after efficient deoxygenation with nitrogen of all solutions used.
Cyclic voltammetry and analytical characteristics
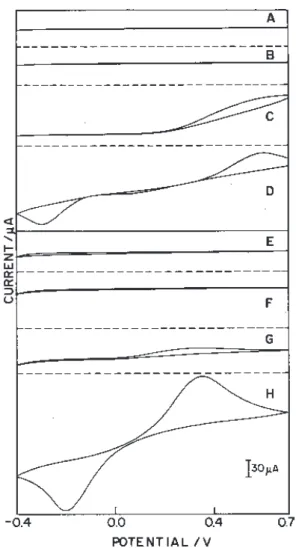
Figure 2 shows the cyclic voltammograms obtained with plain carbon paste electrode (A, B, C and D) and zucchini crude extract modified carbon paste electrode (biosensor) (E, F, G and H) in the potential range from +0.7 to -0.4 V vs Ag/AgCl at a scan rate of 100 mV s-1 in 0.1 mol L-1 phosphate buffer solution (pH 6.5). Cyclic
volta-mmograms A and E were obtained in 0.1 mol L-1
phos-phate buffer (pH 6.5) with unmodified electrode and biosen-sor, respectively. Cyclic voltammograms B and F were ob-tained for 2.0x10⁻³ mol L-1 hydrogen peroxide 0.1 mol L-1
in phosphate buffer (pH 6.5), C and G for 2.0x10⁻³ mol L-1 hydrogen peroxide and 3.0x10⁻³ mol L-1 L-ascorbic acid
in 0.1 mol L-1 phosphate buffer (pH 6.5) solution and fi-nally cyclic voltammograms D and H were obtained for 2.0x10⁻³ mol L-1 hydrogen peroxide, 3.0x10⁻³ mol L-1 L-ascorbic acid and 7.0x 10⁻³ mol L-1 hydroquinone in 0.1
mol L-1 phosphate buffer (pH 6.5) solution for these both electrode (plain and biosensor), respectively. It can be seen that L-ascorbic acid (AsA) was oxidized to dehydroascor-bic acid (DAsA) at a potential of 0.4-0.5 V using the plain electrode (cyclic voltammogram C) and at a potential range of 0.2-0.4 V using this biosensor (cyclic voltammogram G). On the other hand, in the presence of hydroquinone (cyclic voltammograms D and H), two waves were ob-served: a reduction wave of reduction of quinone to hyd-roquinone (see also Figure 1) and an oxidation wave of hydroquinone to quinone and/or oxidation of AsA to DAsA. As it can be observed, the sensitivity of the biosen-sor was much better than that of the plain electrode (cyclic voltammogram H).
Figure 3 shows the cyclic voltammograms obtained with the modified carbon paste biosensor in the potential range from + 0.7 to - 0.4 V vs Ag/AgCl at a scan rate of 100 mV s-1 in 0.1 mol L-1 phosphate buffer solution (pH 6.5). The baseline A
was obtained using a 2.0x10⁻³ mol L-1 hydrogen peroxide in phosphate buffer solution (pH 6.5). Cyclic voltammogram 3B
was obtained with 2.0x10⁻³ mol l-1 hydrogen peroxide and
3.0x10⁻³ mol L-1 L-ascorbic acid solutions in the same buffer solution described above in the experimental section. On the other hand, cyclic voltammograms presented in Figure 3C were obtained for 7.0x10⁻³ mol L-1 hydroquinone and 2.0x10⁻³
mol L-1 hydrogen peroxide (cyclic voltammogram 1) and twenty other cyclic voltammograms (from 2 to 21) with the addition of L-ascorbic acid solution in the concentrations of (2) 2.0x10⁻⁴; (3) 3.9x10⁻⁴; (4) 7.7x10⁻⁴; (5) 1.1x10⁻³; (6) 1.5x10 -3; (7) 1.8x10⁻³; (8) 2.1x10⁻³; (9) 2.5x10⁻³; (10) 2.8x10⁻³; (11)
3.1x10⁻³; (12) 3.3x10⁻³; (13) 3.6x10⁻³; (14) 3.9x10⁻³; (15)
4.1x10⁻³; (16) 4.4x10⁻³; (17) 4.6x10⁻³; (18) 4.9x10⁻³; (19) 5.1x10⁻³; (20) 5.3x10⁻³ and (21) 5.5x10⁻³ mol L-1. The
ca-thodic peak current obtained at a potential of -0.14 V (electro-chemical reduction of p-quinone to hydroquinone) was thus related with the L-ascorbic acid concentration. The analytical curve obtained for L-ascorbic acid solution in the concentra-tion range from 2.0x10⁻⁴ to 5.5x10⁻³ mol L-1 was Icp =147.82
- 2.00x10⁵ [AsA], r= 0.9992, where I
cp is the cathodic peak
current in mA and [AsA] is the L-ascorbic acid concentration in mol L-1. A detection limit (three times the signal blank/
slope) of 2.2x10⁻⁵ mol L-1 and a relative standard deviation <1.3% for eight consecutive determinations of a solution con-taining 4.0x10⁻³ mol L-1 L-ascorbic acid, 7.0x10⁻³ mol L-1 hydroquinone and 2.0x10⁻³ mol L-1 hydrogen peroxide
solu-tion were obtained. This biosensor retained 90% of its initial enzyme activity for five months when stored at 4oC and the
lifetime of this biosensor was at least 7 months (over 900 samples were analyzed with the same carbon paste electrode), which is much higher than the lifetime of biosensors using pure
peroxi-dase and/or ascobate oxiperoxi-dase22,27.
Study of potential interferents
The effect of other substances on the determination of L-ascorbic acid in pharmaceutical formulations, such as acetylsalicylic acid, citric acid, glucose, lactose, magne-sium stearate, oxalic acid, poly(ethylene glycol) 1500, so-dium chloride, starch, sucrose, tartaric acid was investigated. The ratios of the concentrations of L-ascorbic acid to those of these excipient substances were fixed at 0.1, 1.0 and 10.0. None of these substances interfered in the proposed method.
Biosensor application
Using the above established conditions, i.e. 75:25 % m/m of graphite powder and Nujol, respectively and 1,400 units of peroxidase mg-1 of protein, pH 6.5, 2.0x10⁻³
mol L-1 hydrogen peroxide, 7.0x10⁻³ mol L-1 hydro-quinone, amperometric measurements at a fixed potential of – 0.14 V were carried out with the proposed biosensor in the recovery study and also in the determination of L-ascorbic acid in several pharmaceutical formulations.
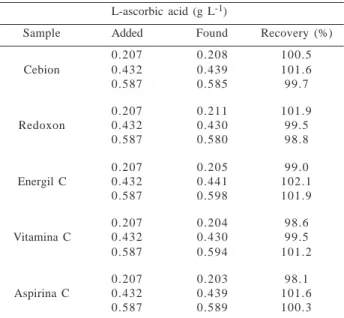
The recovery studies of L-ascorbic acid in five phar-maceutical formulations, Cebion, Redoxon, Energil C, Vitamina C and Aspirina C (n=5) were undertaken using the carbon paste modified with the crude extract. In these studies, three different standard concentration solutions (0.207; 0.432 and 0.587 g L-1) were added to each sample and recoveries varying from 98.1 to 102.1% of L-ascorbic acid were obtained (Table 1). This is a good evidence of the accuracy of proposed method and absence of matrix effects on those determinations.
The proposed method was validated by applying it to the determination of L-ascorbic acid in many pharmaceu-tical formulations (Table 2). The results obtained by the proposed procedure are in good agreement with those ob-tained by an official procedure28 and also with the values
claimed (calculated t-values did not exceed the theoreti-cal value at 95% confidence level) and within an accept-able range of error.
Figure 2. Cyclic voltammograms obtained with plain carbon paste
Conclusions
The biosensor based on carbon paste modified with crude extract of zucchini (Cucurbita pepo) for determining L-ascorbic acid in pharmaceutical formulations is stable, selective, sensitive, simple and low cost. These characteris-tics make this biosensor an attractive alternative to those procedures that use pure enzymes (ascorbate oxidase) used for pharmaceutical, clinical and food applications.
Acknowledgements
Financial support from FAPESP (Processes 1991/ 2637-5 and 1994/4822-2) PADCT/CNPq (Process 62.0060/91-3), CNPq (Process 50.1638/91-1), a scholar-ship granted by FAPESP (Process 97/04764-0) to I.C.V. are gratefully acknowledged.
References
1. Voet, D.; Voet, J. Biochemistry. John Wiley & Sons, New York, p. 256, 1995.
2. Kuriyama, S.; Rechnitz, G. A. Anal. Chim. Acta 1981,
131, 91.
3. Arnold, M. A.; Rechnitz, G. A. Biosensors based on plant and animal tissue. In Biosensors: Fundamentals and
Applications, A. F. P. Turner, I. Karube & G. S. Wilson,
eds.; Oxford University Press, New York, p. 30, 1987.
Figure 3. Cyclic voltammograms in 0.1 mol L-1 phosphate buffer solution (pH 6.5) for: (A) 2.0x10⁻³ mol L-1 hydrogen peroxide solution; (B) 2.0x10⁻³ mol L-1 hydrogen peroxide and 3.0x10⁻³ mol L-1 L-ascorbic acid solution and (C) 7.0x10⁻³ mol L-1 hydroquinone and 2.0x10⁻³ mol L-1 hydrogen peroxide (cyclic voltammogram 1) and twenty other cyclic voltammograms (from 2 to 21) with the addition of L-ascorbic acid solution in the concentration range from 2.0x10⁻⁴ to 5.5x10⁻³ mol L-1. Scan rate of 100 mV s-1 and E
cp of -0.14V, at 25oC.
Table 1 Results of the addition-recovery experiment using L-ascorbic
acid of three standard concentrations
L-ascorbic acid (g L-1)
Sample Added Found Recovery (%)
0.207 0.208 100.5
Cebion 0.432 0.439 101.6
0.587 0.585 99.7
0.207 0.211 101.9
Redoxon 0.432 0.430 99.5
0.587 0.580 98.8
0.207 0.205 99.0
Energil C 0.432 0.441 102.1
0.587 0.598 101.9
0.207 0.204 98.6
Vitamina C 0.432 0.430 99.5
0.587 0.594 101.2
0.207 0.203 98.1
Aspirina C 0.432 0.439 101.6
0.587 0.589 100.3
Table 2 Determination of L-ascorbic acid in pharmaceutical
for-mulations using the official method28 and the biosensor
L-ascorbic acid (g/tablet)
Sample Label value Official method Biosensor Relative error (%)
4. Wang, J.; Ciszewski, A.; Naser, N. Electroanalysis
1992, 4, 777.
5. Macholán, L. Biocatalytic membrane electrodes. In
Bioinstrumentation and Biosensors. D. L. Wise, ed.;
Marcel Dekker, New York, p. 329, 1991.
6. Caruso, C. S.; Vieira, I. C.; Fatibello-Filho, O. Anal.
Lett. 1999, 32, 39.
7. Fatibello-Filho, O.; Vieira, I. C. Analyst 1997, 122, 345. 8. Fatibello-Filho, O.; Vieira, I. C. Anal. Chim. Acta
1997, 354, 51.
9. Vieira, I. C.; Fatibello-Filho, O. Anal. Lett. 1997,
30, 895.
10. Vieira, I. C.; Fatibello-Filho, O. Anal. Chim. Acta 1997,
366, 111.
11. Vieira, I. C.; Fatibello-Filho, O. Talanta 1998, 46, 559. 12. Vieira, I. C.; Fatibello-Filho, O. Analyst 1998 ,
123, 1809.
13. Macholan, L.; Chmelikova, B. Anal. Chim. Acta
1986, 31, 187.
14. Matsumoto, K.; Yamada, K.; Osajima, Y. Anal. Chem.
1981, 53, 1974.
15. Uchiyama, S.; Tofuku, Y.; Suzuki, S. Anal. Chim. Acta.
1988, 208, 291.
16. Uchiyama, S.; Umetsu, Y. Anal. Chim. Acta 1991,
255, 53.
17. Marques, E. T. A.; Lima, J. L. Appl. Biochem. and
Biotechnol. 1992, 32, 73.
18. Willian, W. J. Handbook of Anion Determination, Butterworths, London, p.587, 1979.
19. Whitaker, R. J. Principles of Enzymology for the Food
Sciences. Marcel Dekker, New York, p. 592, 1985.
20. Lowry, O. H.; Rosebrough, N. J.; Farr, A. L.; Randall, R. J. J. Biol. Chem. 1951, 193, 265.
21. Guilbault, G. G. Analytical Uses of Immobilized En-zymes. Marcel Dekker, New York, p. 211, 1984. 22. Gorton, L. Electroanalysis 1995, 7, 23.
23. Uchiyama, S.; Hasebe, Y.; Shimizu, H.; Suzuki, S.
Anal. Chim. Acta 1993, 276, 341.
24. Zambonin, C. G.; Losito, I. Anal. Chem. 1997, 69, 4113. 25. Pereira, A. V.; Fatibello-Filho, O. Anal. Chim. Acta
1998, 366, 55.
26. Pereira, A. V.; Fatibello-Filho, O. Talanta 1998, 47, 11. 27. Wang, J.; Lin, S. Anal. Chem. 1988, 60, 1545. 28. The United States Pharmacopeia-The National
For-mulary, USP XXXIII, Pharmacopeial Convention,
Rockville, MD, p. 130, 1995.
Received: January 28, 2000