Brazilian Journal of Physics, vol. 35, no. 4B, December, 2005 1155
Light on Dark Matter: Gravitational Lensing by Galaxy Clusters
Laerte Sodr´e Jr.
Departamento de Astronomia, IAG, Universidade de S ˜ao Paulo Rua do Mat˜ao 1226, Cidade Universit´aria, 05508-090, S˜ao Paulo, SP, Brazil
(Received on 5 November, 2005)
I discuss the use the weak gravitational lensing effect to study the mass distribution and dynamical state of a sample of 24 X-ray luminous clusters of galaxies. By comparing the mass and light distributions of the clusters it is found that their mass centers, for the majority of the clusters, is consistent with the positions of optical centers. Some clusters present significant mass substructures which generally have optical counterparts. At least in one cluster (Abell 1451), it is detected a mass substructure without an obvious luminous counterpart. Clusters with intra-cluster gas colder than 8 keV show a good agreement between the different mass determinations, but clusters with gas hotter than 8 keV present weak lensing masses smaller than those inferred by the other methods and therefore have been diagnosed to be out of equilibrium.
I. INTRODUCTION
One of the major scientific discoveries of last century was that most matter in the universe is dark (do not emit photons) and non-barionic. The first evidence was provided by Zwicky in 1937 ([1], see also [2]) who verified, by applying the virial theorem of classical mechanics to the Coma cluster of galax-ies, that most of the matter in this cluster was dark. In the same paper Zwicky suggested that the gravitational field of galaxy clusters is expected to deflect the light coming to us from background galaxies.
Many contemporary cosmological observations support the existence of dark matter, like the temperature fluctuations in the Cosmic Background Radiation and the power spectrum of the large-scale distribution of galaxies. Moreover, most of this dark matter is non-baryonic, as inferred from these same probes and from the observed abundances of light elements. Actually, accordingly to the so called ”concordance model”, we live in a flat universe where the matter-energy density is dominated by dark energy (∼72%) and dark matter (∼23%). Barions contribute only with∼4%. The nature of dark matter is a major unknown in modern science. Here I discuss how the study of galaxy cluster is helping to shed light on the dark matter distribution.
Galaxy clusters are complex systems that hold together galaxies, hot gas and dark matter. These components are gov-erned by different physical mechanisms and their study re-quires the use of different observational techniques. Imaging in visible light reveals the cluster through their member galax-ies which we know now that contribute only a small fraction of the cluster total mass. But, if these galaxies are in virial equi-librium, the depth of the cluster potential well can be accessed through their velocity dispersion. The thin hot gas– mainly hydrogen– that permeates the cluster gravitational potential is found to be at temperatures of the order of 107−108K, thus fully ionized and emitting X-rays via thermalbremsstrahlung process. The emission in the X-ray band provides an effi-cient method to estimate cluster masses if the hypothesis that the gas is in hydrodynamical equilibrium holds. The advan-tage of using the hot intracluster gas rather than the member galaxies for mass determinations is that it has a much shorter relaxation time due to its self-interactivity ([3]). Nevertheless, there is evidence, that many clusters present significant
depar-tures from dynamical relaxation, as indicated by the presence of substructures (e.g., [4], [5]). Presumably, the clusters that are in the top of the mass function will achieve last their for-mation process, so we expect to find some degree of correla-tion between the departures from equilibrium and the mass of the clusters.
The development of gravitational lensing techniques, for both the strong and weak regimes, has presented a new way of measuring masses regardless the nature or dynamical state of the matter ([6], [7]). Strong lensing, that relies on the mod-eling of systems of multiple lensed background galaxies, has proved to be an accurate method, mainly when the number of gravitational arcs is large ([8]). However, this technique can probe only the very central regions of the clusters, and is limited to the most massive and concentrated objects. On the other hand, the statistical analysis of the weak distortion caused by the cluster shear field on images of faint back-ground galaxies allows the mapping of the matter distribution to much larger radius; besides, this gravitational distortion is detectable in almost all clusters when large telescopes with current instrumentation are used. After the seminal work of Tyson et al. ([9]), the weak-lensing technique started to be used for the study of some clusters having special interest be-cause of extreme values in some of their measured proper-ties, and new methodologies were established (see [7] for a review).
I discuss here some results of a weak-lensing analysis of a sample of 24 X-ray luminous southern clusters with 0.05< z<0.31, based on imaging observations with the ESO-VLT telescope taken under sub-arcsecond conditions. A detailed discussion of this work is presented in Cypriano et al. ([10]). We determine the mass distributions for the galaxy clusters and investigate their dynamical state through comparison of the weak-lensing masses with already published virial and X-ray mass estimates. Throughout this paper I adopt aΛCDM cosmology withΩM = 0.3, ΩΛ = 0.7 and H0 = 70 km s−1 Mpc−1.
II. WEAK-LENSING ANALYSIS
1156 Laerte Sodr´e Jr.
observed in service mode using VLT Antu (Unit Telescope 1), with the FORS1 instrument (FOcal Reducer/low disper-sion Spectrograph) working in its imaging mode. The imag-ing was chosen to be centered on the clusters cores and done through the V, R, and I-bands. The color information is es-sential to discriminate objects belonging to the cluster from the background sources needed for the weak-lensing measure-ments. All the observations were conducted under good sky transparency and had an excellent image quality.
The detection of objects in the images and the extrac-tion of their main parameters were made with SEXTRACTOR ([11]). We have produced three sub-samples of detected ob-jects: stars, cluster galaxies, and other galaxies. In the ab-sence of spectroscopic redshifts for most of the galaxies in the clusters, the cluster galaxies were selected from the color-magnitude diagram(V−I)×Ifor each cluster. In this type of diagram, the early-type cluster galaxies occupy a well defined locus, the so called red cluster sequence, with almost the same color.
Weak-lensing analysis needs careful measurements of the ellipticity of background galaxies observed in the field of a cluster of galaxies. We made galaxy shape measurements us-ing theIM2SHAPEsoftware ([12]), which gives, for each ob-ject, its ellipse parameters a, b, andθ, which are its semi-major and semi-minor axes and the position angle of the ma-jor axis, respectively. The ellipticity, following the convention usually adopted in lensing studies, is defined as
ε=a−b
a+b (1)
The ellipticity projected tangentially to the direction of a pre-defined cluster mass center is given by
εt=εcos[2(θ−φ)] (2)
whereφis the azimuthal coordinate of the galaxy.
A key step in weak-lensing analysis is the selection of galaxies that will be used as probes of the gravitational field of the lensing cluster. These galaxies must be behind the clus-ter and we should be able to measure their shapes with good accuracy. For this, it is necessary to have distance estimates for all objects in the field. In the absence of distance infor-mation, we proceeded by building a master catalog of puta-tive background galaxies, selected by flux in the non-cluster galaxy catalog. The final catalog is obtained after removal of a number of objects due to their proximity of the cluster center (where the weak-lensing regime is no longer a good approximation and the large number of cluster galaxies can contaminate the weak-lensing sample and bias the shape mea-surements) or large errors in the ellipticity.
The mass distribution, in the weak-lensing regime, can be obtained from the pattern of distortion of galaxy shapes at a position x, hεt(x)i, that depends only of the reduced shear g=γ/(1−κ), whereγandκare the shear modulus and con-vergence atx.
We have reconstructed the two-dimensional mass density distributions from distortion maps using the LENSENT soft-ware ([13], [14]). This softsoft-ware computes κ maps using a
maximum-entropy method, taking each background galaxy image shape as an independent estimator of the reduced shear field. This map is smoothed by a Gaussian function, called intrinsic correlation function (ICF), whose full width at half maximum (FWHM) is determined by Bayesian methods.
It should be noted that since this method takes into account only galaxy distortions and ignores their amplifications, the convergence determined this way will suffer from the “mass sheet degeneracy”: the distortion pattern can be reproduced by any mass distributions that obeys the transformationκ→
λκ+ (1−λ), whereλis a real number.
We have also computed light maps of the light distribution of galaxies in the red sequence. The field is divided in 32×32 pixels and the smoothed light density of each pixel is esti-mated as
L
∝∑
i Lie−
d2i
2σ2 (3)
whereLiis the luminosity of thei-th galaxy, anddiis its an-gular distance to the pixel center. The value ofσ is chosen to have the same FWHM of the ICF of the mass map. An example of mass and light maps is shown in Fig. 1.
In order to avoid the mass sheet degeneracy and to obtain quantities that can be compared with data determined by other methods, we fit physically motivated parametric models to the distortion maps. We considered two different mass models: a singular isothermal sphere, SIS, and a singular isothermal el-lipsoid, SIE (a power law profile is also discussed in [10]). Let us assume a polar reference system with origin at the cluster center, so that any point on the image can be represented by an angular radial coordinateθand an azimuthal angleφ. For the SIS profile the convergence and the shear are given by
κ=γ=1 2
θE
θ (4)
where θE is the Einstein radius, which is related to the one-dimensional velocity dispersion of the isothermal sphere (σSIS) as
θE=4π
σ2
SIS c2
Dls Ds
. (5)
The SIE profile (e.g., [15]) has properties similar to those of SIS models, but the values of the shear and the convergence are now given by
κ=γ=1 2
θE
θ f [cos(φ−α) +f2sin(φ−α)]−1/2 (6) wheref<1 is the axial ratiob/a,αis the position angle of the ellipsoidal matter distribution andφthe azimuthal coordinate. For this model, in the weak-lensing regime (κ<<1), the shear is oriented tangentially to the direction to the mass center.
The SIS model has only one free parameter,θE, whereas the SIE has three free parameters:θE, f, andα.
Brazilian Journal of Physics, vol. 35, no. 4B, December, 2005 1157
FIG. 1: Mass (top) and Light (bottom) maps for the cluster A1451. The mass map is produced using the distortions of the faint back-ground galaxies as probes of the mass density of the cluster. The gray level scale shown at the right edge of the map is in unities of the critical density. The light map is the result of the smoothing of the luminosity of the clusters members belonging to the red sequence.
the best-fit parameters were obtained through minimization of theχ2statistic, defined as:
χ2=
∑
i
(εt,i−gt,i)2
σ2
εt,i+σ
2
ε , (7)
whereεt,iandσεt,iare the tangential ellipticity and its error for
thei-th galaxy,σε=0.3 ([7]) is the dispersion associated with galaxy intrinsic shapes, andgt,iis the tangential reduced shear at the position of this galaxy, which quantifies the ellipticity induced by the lensing distortion. For all models we consider
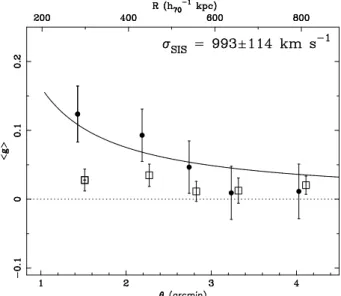
FIG. 2: Shear profile for the cluster A1451. The filled symbols cor-respond to average ellipticies of the faint background galaxies pro-jected tangentially to the cluster center. Each point represents nearly 1/5 of the galaxies. The open squares are the same, but of ellipticies projected in a direction 45◦relative to the center. The solid line show the best fit SIS profiles.
here it may be assumed that, in the weak lensing regime,|~g|=
gt.
We have estimatedσSIS(σSIEfor the elliptical model) from
θE using for each cluster an average value ofDls/Ds. Con-sidering the minimum and average values of I magnitudes in our weak-lensing sample, we selected sub-samples of HDF galaxies ([16]) and, from their photometric redshifts, the mean value of the distance ratio above was calculated. An example of the radial shear profile and the best-fit SIS profile is shown in Fig. 2. A main drawbeck of the parametric approach is that many clusters may have irregular mass distributions, not properly described by the profiles adopted here.
III. CONCLUSIONS
The main conclusions of this work may be summarized as follows (a more detailed discussion is presented in [10]:
1. We were able to detect significant weak-lensing signal in 22 out of 24 clusters. This high success rate shows the feasibility of weak-lensing studies with 8m-class telescopes using service mode observations and rela-tively short exposure times. It also indicates that the X-ray luminosity is indeed a good way to select mas-sive clusters. Nondetections in two clusters are proba-bly due to a combination of poorer observing conditions with low mass content.
1158 Laerte Sodr´e Jr.
FIG. 3: Alignment between the position angle of the brightest cluster galaxyαBCGand of the mass distributionαSIE. For clusters without
a clear dominant galaxy, the direction linking the two first ranked cluster members is used instead.
3. Few clusters present massive substructures, what can be due, in part, to small fields (0.4 to 1.8 Mpc on a side) and the relatively low resolution of the mass maps. When significant substructures are seen, they are gener-ally associated with bright cluster members. However, at least in one cluster (A1451) there seems to exist a substructure without a clear optical counterpart.
4. The clusters analyzed here present important departures from spherical symmetry, as can be verified by the bet-ter fits obtained with elliptical profiles. This result
con-firms the nonsphericity of dark matter halos found in cosmological simulations (e.g., [17]).
5. We have found, for the first time in an statistically sig-nificant sample, that the dark matter and brightest clus-ter galaxy major-axes are strongly aligned: for 62.5% of the clusters (15 out of 24) the difference between their position angle is smaller than 20◦(see Fig. 3).
6. Most clusters are in or near a state of dynamical equi-librium. This diagnosis derives from the agreement between their velocity dispersions and the temperature of their ICM, directly measured and/or inferred from weak-lensing data. Except for three clusters, which also present evidence of substructures or other complexities, the other clusters show agreement between these quan-tities at a 1.5σlevel.
7. Clusters with a hot intergalactic medium,TX>8 keV, show signal of dynamical activity, presenting large dif-ferences between lensing and dynamical mass estimates and seem to be far from equilibrium.
Most of these conclusions support a hierarchical scenario in which massive bodies are formed by the agglomeration of smaller ones, and the departures of equilibrium described above are indeed an evidence that some clusters that are at the top of the mass function are still in the process of active evolution.
Acknowledgments
It is a pleasure to thank the organizers of this meeting cele-brating Einstein miracoulous year, as well as my collaborators in this project: Eduardo Cypriano, Jean-Paul Kneib and Luis Campusano. This work has been supported by FAPESP and CNPq.
[1] F. Zwicky, ApJ86, 217 (1937). [2] J. P. Ostriker, ApJ525, 297 (1999).
[3] C. L. Sarazin,X-ray emission from clusters of galaxies, CUP, Cambridge (1988).
[4] M. J. Geller, T. C. Beers, PASP94,421 (1982).
[5] L. Sodr´e Jr., D. Proust, H. V. Capelato, G. B. Lima Neto, H. Cuevas, H. Quintana, and P. Fouqu´e, A&A377, 428 (2001). [6] B. Fort, Y. Mellier, A&AR5, 239 (1994).
[7] Y. Mellier, ARAA37, 127 (1999).
[8] J.-P. Kneib, R. S. Ellis, I. Smail, W. J. Couch, R. M. Sharples, ApJ471, 643 (1996).
[9] J. A. Tyson, F. Valdes, and R. A. Wenk, ApJ349, L1 (1990). [10] E. S. Cypriano, L. Sodr´e Jr., J.-P. Kneib, and L. E. Campusano,
ApJ613, 95 (2004).
[11] E. Bertin, S. Arnouts, A&AS117, 393 (1996).
[12] S. L. Bridle, J.-P. Kneib, S. Bardeau, S. F. Gull, in ’The shapes of Galaxies and their Dark Halos’ Yale Cosmology workshop, 28-30 May 2001, World Scientific (2002).
[13] S. L. Bridle, M. P. Hobson, A. N. Lasenby, and R. Saunders, MNRAS299, 895 (1998).
[14] P. J. Marshall, M. P. Hobson, S. F. Gull, and S. L. Bridle, MN-RAS335, 1037 (2002).
[15] R. Kormann, P. Schneider, and M. Bartelmann, A&A284, 285 (1994).
[16] A. Fern´andez-Soto, K. M. Lanzetta, and A. Yahil, ApJ513, 34 (1999).