Brazilian Journal of Physics, vol. 34, no. 2B, June, 2004 617
Ab Initio Calculation of the (100) and (110) Surface
Phonon Dispersion of GaAs and GaN
H. W. Leite Alves
∗, J. L. A. Alves
∗, A. M. Santos
†, L. M. R. Scolfaro
†, and J. R. Leite
† ∗Departamento de Ciˆencias Naturais, Universidade Federal de S˜ao Jo˜ao del Rei Caixa Postal 110, 36.300-000, S˜ao Jo˜ao del Rei, Minas Gerais, Brazil
†
Instituto de F´ısica, Universidade de S˜ao Paulo Caixa Postal 66318, 05315-970, S˜ao Paulo, S˜ao Paulo, Brazil
Received on 10 March, 2003
In this work, we have calculatedab initiothe phonon dynamics of the Ga-rich GaAs (100) (1×1), GaAs (100) (2×1), GaN (100) (1×1), GaAs (110) and GaN (110) surfaces. Our results for the (100) surfaces show that, while the (2×1) reconstruction is characterized by dimer vibrations, the (1×1) reconstruction presents interesting features which is closely related to the reduced mass of the compound. All the studied cases show the presence of a Rayleigh mode. The calculated properties for the (110) surfaces agree very well with the available experimental data from HEELS and inelastic He-atom scattering as well as with other theoretical calculations.
1
Introduction
The evaluation of dynamical properties of the solids, and of their surfaces, is a powerful tool to give a complete macro-scopic characterization of the studied systems and, also, to check the accepted models [1]. On the other hand, a great amount of efforts is spent to understand the growth mech-anism of cubic GaN(and its alloys), which is the proto-type material for the optoelectronic devices operating on the visible part of the electromagnetic spectra. Many sub-strates were employed and, recently, (100) and (110) GaAs substrates were used with relative success [2]. However, while the GaN and GaAs (100) and (110) surfaces electronic structures and structural properties were extensively studied, the amount of knowledge on their dynamical properties are rather scarce: only the (110) surfaces were studied [3,4].
So, in this work, using the Density Functional The-ory(DFT), within the local density approximation (LDA), based on the plane-wave pseudopotential method together with the slab-supercell description, we have calculated the atomic geometry and the phonon dynamics of the Ga-rich GaAs (100)(1×1), GaAs(100)(2×1), GaN(100)(1×1) surfaces, as well as the non-polar GaAs and GaN (110) ones, in order to supply the missing information on the vibra-tional properties of these surfaces. As, to our knowledge, this is first time that the III-V semiconductor (100) surface phonons were theoretically studied, we have chosen the (1 ×1) reconstruction (the ideal surface), that is consisted of a square disposition of the surface atoms which only the re-laxation takes place. On the other hand, in the(2×1) recon-struction, the surface unit cell is a double square along the surface (-1 1 0) direction, forming a rectangle which is con-stituted by buckled Ga-dimers. It was chosen because, dur-ing the conditions of the GaN growth on GaAs substrates,
the GaAs (100) surface makes a phase transition to the such reconstruction [2].
In the calculations, we have used the Hartwigsen-Goedecker-Hutter(HGH) ultrasoft pseudopotentials [5]. For the GaN calculations, we have included Ga-3d electrons as a semicore correction, as defined in Ref. 5. The phonon modes and their dispersion curves were obtained using the adiabatic perturbation theory (abinit code) [6]. Details about the converged bulk and surface equilibrium properties of GaN and GaAs were described in our previous works [7].
2
(100) Surfaces
To perform the phonon dynamics calculations within the slab supercell model, we have used a plane-wave cutoff en-ergy of 30 Ry, with the forces, after the relaxation or re-construction, converged to 0.05 mHartree/Bohr. While the (100) (2×1) surface was modelled with an atomic slab of four (100) layers and a vacuum region equivalent to 4 atomic layers, the (100) (1×1) ones, were described by a slab su-percell of six (100) layers and a vacuum region build up of 6 atomic layers. In all slabs, the back surface was passivated by hydrogen atoms arranged in a dihydride structure. Also, a (4 4 2) Monkhorst-Pack grid was used to sample the slab Brillouin zone [8].
618 H. W. Leite Alveset al.
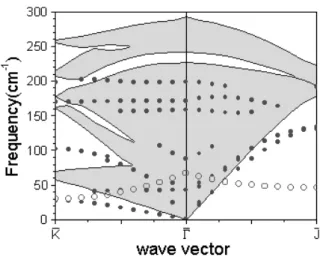
cm−1, acquiring a strong vertical component in the displace-ment pattern. However, looking to the J point, at 27.4 cm−1, this mode keeps with its shear-horizontal character.
Figure 1. Calculated phonon dispersion for the GaAs (100) (1×1) surface. The circles denote the surface modes while the hatched area are the projected bulk results. The open circles depicts the damped vibrations.
We have detected another fully surface-localized mode as a flat branch at 87.4 cm−1 and F¨uchs-Kliewer(FK) (surface-subsurface chain vibration) modes at 42.5, 171 and 199 cm−1atΓpoint, arriving to 102, 170 and 198 cm−1at J point. Also, we note that, when the bulk modes start to fall at the frequency gap region, the top Ga component on the displacement pattern increases. Also, we note, from our results, that there is a Ga damped vibration perpendicular to the surface(with negative frequency) at 66.9 cm−1. All these features agree well with our recent results obtained with a smaller supercell [7].
We show, in Fig. 2, our results for GaN (100) (1×1) sur-face and, also, we have excluded the hydrogen modes by the same reasons described above, in the GaAs case. In GaN, due to the large mass difference for Ga and N atoms, the bulk acoustical and optical phonon modes are separated by a large frequency gap. Our results show that the lowest local-ized mode is the RW one, arriving at K point with 166 cm−1, and at J point, at 115.2 cm−1, keeping the same character as observed for the GaAs surface. A fully surface-localized mode as a flat branch at 98.6 cm−1and a FW mode at 619.9 cm−1. Also, as observed by T¨ut¨unc¨uet al. [4] for the GaN (110) surface, we found a rock mode at 442.6 cm−1 but, it does not keep the flat band character when we goes fromΓ
to J point in the surface Brillouin zone. Finally, we found two Ga damped vibrations, one perpendicular to the surface and the other parallel to it, at 132.8 and 69.9 cm−1, respec-tively. The second mode was not observed for the GaAs surface.
Figure 2. Same as Fig. 1 for the GaN (100) (1×1) surface. Here, the stars denote the sub-surface modes.
Figure 3 depicts our results for the GaAs(100) (2×1) surface, showing new features when compared to the (1×1) pattern. Again, the lowest surface mode is the RW one, start-ing atΓpoint as a shear-horizontal mode, keeping this char-acter at the K point, at 72.6 cm−1, and at the J point, at 45.2 cm−1, but it is not observed at J’ point. The other modes atΓare Ga-dimer vibrations, where at 46, 87,102.1, 119.7, 172.9 and 203.6 cm−1, the dimer vibrates perpendicular to the surface, and at 58.3, 58.7, 164.6 and 193.3 cm−1, the dimer vibrates in the (-1,1,0) direction.
Figure 3. Calculated phonon dispersion for the GaAs (100) (2×1) surface. The circles denote the surface dimer modes while the hatched area are the projected bulk results.
3
(110) Surfaces
Brazilian Journal of Physics, vol. 34, no. 2B, June, 2004 619
the calculated surface modes for the A” irreducible represen-tations of the point group symmetry of the surface unit cell, because the experimental results have only detected modes on this particular symmetry representation. As seen in Table I, our results are in good agreement with other theoretical and experimental results: also the lowest localized mode is the RW one, and the dispersion curves show the same fea-tures as described in other theoretical works [3,4].
Finallly, we presented our preliminary results for the phonon dynamics of the Ga-rich GaAs(100) (1 × 1), GaAs(100) (2×1), GaN(100) (1×1), GaAs (110) and GaN (110) surfaces. We hope that our results give guidelines for future experiments on this subject. Further details of our calculations and a careful analysis of the above mentioned vibration modes will be published soon.
Table I. Calculated surface phonon frequencies (in cm−1)for GaAs and GaN (110) atΓpoint in the A” irreducible representations of the point group symmetry of the surface unit cell, compared with available theoretical (Refs. 3, 4) and experimental results (Refs. 9, 10).
A”
GaAs This work 82.6 124 184 250 288
Ref. 3 133 191 249 279
Ref. 4 88.6 127 168 184 246 289 Ref. 9 80.7
Ref. 10 84.7 134 170 289
GaN This work 135 189 500 579 720
Ref. 4 508 726
Acknowledgements
The computer resources were provided by the Centro Nacional de Processamento de Alto Desempenho em Mi-nas Gerais & Regi˜ao Centro-Oeste (CENAPAD-MG/CO), Brazil.
References
[1] S. Baroni, S. de Gironcoli, A. Dal Corso, and P. Giannozzi, Rev. Mod. Phys.73, 515 (2001).
[2] S. A. Ding, G. Neuhold, J. H. Weaver, P. H¨aberle, K. Horn, O. Brandt, H. Yang and K. Ploog, J. Vac. Sci. Technol. A14, 819 (1996); V. P. LaBella, Z. Ding, D. W. Bullock, C. Emery and P. M. Thibado, Int. J. Mod. Phys. B15, 2301 (2001).
[3] C. Eckl, R. Honke, J. Fritsch, P. Pavone and U. Schr ¨oder, Z. Phys. B104, 715 (1997); J. Fritsch, P. Pavone and U. Schr¨oder, Phys. Rev. Lett.71, 4194 (1993).
[4] H. M. T¨ut¨unc¨u and G. P. Srivastava, J. Phys.: Condens. Mat-ter8, 1345 (1996); H. M. T¨ut¨unc¨u, R. Miotto, G. P. Srivastava and J. S. Tse, Appl. Phys. Lett.80, 3322 (2002).
[5] C. Hartwigsen, S. Goedecker and J. Hutter, Phys. Rev. B58, 3641 (1998).
[6] X. Gonze, J.–M. Beuken, R. Caracas, F. Detraux, M. Fuchs, G.–M. Rignanese, L. Sindic, M. Verstraete, G. Zerah, F. Jol-let, M. Torrent, A. Roy, M. Mikami, Ph. Ghosez, J.–Y. Raty and D. C. Allan, Comput. Mater. Sci.25, 478 (2002), and references therein.
[7] A. de Paiva, J. L. A. Alves and H. W. Leite Alves, phys. stat. sol. (c)0, 417 (2002); H. W. Leite Alves, J. L. A. Alves, A. M. Santos, L. M. R. Scolfaro and J. R. Leite, Physics of Semiconductors 2002, Proceedings of the 26thInternational Conference on the Physics of Semiconductors, Institute of Physics Conference Series number 171, ed. A. R. Long and J. H. Davies, Institute of Physics, Bristol, P39, 2003.
[8] H. J. Monkhorst and J. D. Pack, Phys. Rev. B13, 5188 (1976).
[9] U. Harten and J. P. Toennies, Europhys. Lett.4, 833 (1987).