Ar
ti
cle
*e-mail: [email protected]
Determination of Benzene, Toluene and
N
-Hexane in Urine and Blood
by Headspace Solid-Phase Microextration/Gas-Chromatography
for the Biomonitoring of Occupational Exposure
Paulo C. F. de Lima Gomes,* Éverton D. D’Andrea, Camila B. Mendes and Maria Elisa P. B. de Siqueira
Laboratório de Análises Toxicológicas, Universidade Federal de Alfenas, 37130-000 Alfenas-MG, Brazil
A análise de tolueno, benzeno e n-hexano inalterados em urina e sangue humano é uma
ferramenta para avaliar a exposição ocupacional a esses solventes. Um método simples usando microextração em fase sólida acoplada ao headspace (HS-SPME), usando ibras de carboxeno/
polidimetilsiloxano (CAR-PDMS) e PDMS, para análise simultânea por cromatograia gasosa de tolueno, benzeno e n-hexano em urina e em sangue foi desenvolvido com intuito de realizar a
monitorização biológica de indivíduos expostos ocupacionalmente a esses solventes. O método foi aplicado na análise de amostras de trabalhadores que utilizavam colas, contendo solventes, na recuperação de calçados. O tolueno foi detectado em todas as amostras de sangue coletadas em sapatarias quando se utilizou a ibra de CAR-PDMS (16,0-55,2 µg L-1,n=7) e o n-hexano foi
detectado em duas amostras (33,0 and 41,3 µg L-1). O benzeno não foi detectado em nenhuma das
amostras de sangue e/ou urina. Nenhum dos solventes pode ser quantiicado nas amostras de urina.
Analysis of unchanged toluene, benzene and n-hexane in human blood and urine can be
useful to evaluate occupational exposure to these solvents. A simple method was developed using headspace-solid phase microextraction (HS-SPME) for simultaneous gas-chromatography analysis of toluene, benzene and n-hexane in urine and blood; with purpose of biological monitoring of
occupational exposure. Carboxen/polidimethylsiloxane iber (CAR-PDMS) and PDMS iber coating were employed in this analysis. Blood and urine samples were collected from handling glue workers. The toluene was detected in all blood samples collected from workers handling glue in shoe repair shops, when using CAR-PDMS ibers (16.0-55.2 µg L-1,n=7). n-Hexane was only
detected in two blood samples (33.0 and 41.3 µg L-1) and benzene was not detected in anyone.
No solvent could be quantiied in urine samples.
Keywords: SPME, n-hexane, toluene, benzene, urine, blood
Introduction
Volatile organic compounds (VOCs) presents vapor pressures above 0.01 kPa and boiling points below 150 ºC.1,2
The determination of VOCs in inhaled air, blood, and urine is important from a toxicological, biochemical and forensic viewpoint.3,4
Organic solvents such as n-hexane, benzene, toluene and xylenes are present in a wide range of commercially available products because of their industrial use in the manufacturing of paints, adhesives, thinners, glues, plastic, pitch, bitumen, some pharmaceutical products and as intermediate in the formation of other chemical substances.
n-Hexane is one of the most important aliphatic compounds and is utilized as a solvent in several industries (i.e.,pharmaceutical, chemical and shoe manufacturing) as ingredient in glues and during the manufacturing of polyoleins and rubber. Toxicological effects of n-hexane involve damage to the central and peripheral nervous systems.5-7
Exposure to benzene is less likely than that of n-hexane and toluene since its use as a solvent in industrial processes was banned in 1980.8,9 The International Agency for
Research on Cancer (IARC)10 classiied it as a potential
industry, when present in the process of petroleum cracking. In addition, benzene can be encountered in cigarette smoke and after the combustion of fossil fuels, such as gasoline. The toxicological effects related to benzene are non-lymphocytic leukemia,11-13 aplastic anemia, chromosome
aberrance14-17 and bone marrow progressive degeneration.
Toluene is a very common chemical which is widely used as a solvent in many consumer products, such as paints, glues and adhesives. Toluene is also used as a synthetic intermediate and as an additive in fuel to increase gasoline octane rating. It produces central nervous system toxicity and fetotoxicity.18
Human contamination by VOCs is generally evaluated by monitoring metabolites in urine. The 2,5-hexanodione, trans, trans muconic acid and hippuric acid are the main biomarkers of n-hexane, benzene and toluene, respectively. However, this procedure presents some disadvantages. Firstly, external sources such as food, mainly fruits and vegetables, can also contain these substances. Secondly, the urinary excretion of the metabolites is inluenced by several factors such as age, alcohol consumption and smoking habits. Therefore, the quantity of biomarkers excreted varies depending on environmental factors and personal characteristics.19-22
In contrast, the use of unchanged solvents as biomarkers is more speciic. The emergence and detection of solvents in urine and/or blood provides high selectivity since they are not endogenous substances.18
Solvents in urine are present in low concentrations as compared to blood.23 Only about 0.06% of the absorbed
toluene and 0.1-0.3% of benzene are excreted unchanged in the urine. Furthermore, the American Conference of Governmental Industrial Hygienist (ACGIH)24 recommends
the measurement of toluene in blood, where it is present in higher concentration, rather than in urine.
In toxicological analysis and other analytical procedures, sample preparation is an essential step to eliminate interferences and selectively extract analytes from the biological luids. Solid phase microextraction (SPME) is a solventless extraction technique based on the sorption of the analyte in small diameter ibers coated with sorbent material.19,23 This technique involves two steps. First
the analytes partition between the iber coating and the sample matrix, followed secondly, by desorption of the concentrated extract into the analytical instrument.25 The
headspace mode (HS-SPME) permits an eficient mass transfer and is better adapted for the analysis of volatile and semi-volatile chemical compounds, especially in complex matrices.
Other methods have been developed for the determination of solvents in blood and/or urine.19,23,26-31 However, in all
these methods unaltered n-hexane was not included. Furthermore, there is no study dealing with simultaneous determination of unchanged n-hexane, benzene and toluene in blood and/or urine. It should be noted that simultaneous occupational exposure occurs more frequently than single exposure in industries that use products containing solvents.
This study focused on the development of a simple, sensitive, and environmental friendly HS-SPME/GC-FID analytical method. Two different fiber coatings, polydimethylsiloxane (PDMS) and carboxen-PDMS (CAR-PDMS) were employed for the simultaneous determination of toluene, benzene and n-hexane in urine and blood. The method was applied to the analysis of the solvents in urine and blood of workers occupationally exposed in shoe repair shops.
Experimental
Chemicals and standard solutions
n-Hexane (99.9%) (Biotec, Pinhais, Brazil), benzene (99.9%), toluene (99.9%), isooctane (99.9%) and ethylbenzene (99.9%) (Grupo Química, Penha, Brazil) and sodium chloride (Neon Comercial Ltda., Ipiranga, Brazil) were used. Stock solutions of each of the above organic compounds were prepared in methanol (Mallinckrodt Baker Inc., Phillipsburg, USA) at a concentration of 1000 mg L-1,
and stored at 4 ºC in sealed amber vial until use.
Instruments
A manual SPME device (Bellefonte, PA, USA) was used to hold the iber. Fibers coated with PDMS (100 µm thickness) and CAR-PDMS (75 µm thickness) were purchased from Supelco. A 1-cm magnetic bar (Supelco) and water bath with digital temperature control (B. Braun Biotech International GmbH, Melsungen, Germany) were used in the SPME procedure. Glass vials, 16 mL, sealed with silicone/PTFE septa were also obtained from Supelco and used for HS-SPME extraction.
A GC 1000 gas-chromatograph with a FID detector (Ciola Gregori Ltda., São Paulo, Brazil) equipped with a splitless injector inlet liner, interfaced to a PC with a DANI DS 1000 integrator (Dani Strumentazione Analitica, Monza, Italy) and IQ3 software for data acquisition was used. The injections were conducted in splitless mode.
Chromatographic conditions
present in urine and blood ive columns with different characteristics were tested: 1 dimethylsiloxane, HP-Innowax polyethylene glycol both with 30 m × 0.53 µm i.d. ×
0.5 µm ilm thickness and HP-1U methylsiloxane 30 m ×
0.32 µm × 0.25 µm from Agilent Technologies (Santa Clara,
CA, USA); ZB-35 phenyl polysiloxane 30 m × 0.53 µm ×
0.5 µm and ZB-1 PDMS 30 m × 0.53 mm × 5.0 µm from
Zebron (Newport Beach, CA, USA). Different temperature programs were tested as well. Nitrogen was used as carrier gas at a constant low of 2.5 mL min-1; the detector was
maintained at 250 ºC and the injector at 240 ºC or 260 ºC for PDMS, and CAR-PDMS iber respectively.
HS-SPME variables
The HS-SPME variables were optimized to obtain the best resolution and eficiency. For each coating phase the following parameters were studied: heating temperature, stirring time, iber headspace exposure time and sodium chloride concentration in the matrix. Desorption of analytes from the ibers (time and temperature of the injector port) was also established.
HS-SPME procedure
Eight milliliters of urine or two milliliter of blood, previous homogenized, were transferred to 16 mL vials containing a magnetic stir bar and an adequate amount of sodium chloride. The vials were sealed with a silicone/ PTFE septum to prevent any loss of the analytes and kept heated in a thermoblock under constant stirring. After reaching equilibrium the septum was pierced with a SPME needle and the SPME iber was exposed to the headspace for sorption of the volatile compounds. Subsequently, the SPME iber was transferred to the GC injector for desorption.
Analytical validation
The chromatographic co-elution of isooctane, ethylbenzene, methanol, ethanol, acetone, pyridine, xylenes, cyclohexane, heptanes, 2-methylhexanone, isopropylic alcohol and methylethylbutylketone were evaluated by direct injection of these compounds into the GC.
Calibration curves were obtained spiking blank urine samples with six different concentrations of each solvent (5 replicates per concentration): toluene between 92 and 560 µg L-1, benzene between 2 and 420 µg L-1 and n-hexane
between 10 and 540 µg L-1 when CAR-PDMS ibers were
used. The same procedure was adopted for PDMS ibers,
however the concentrations of toluene, benzene and n-hexane ranged from 92 to 2000 µg L-1, from 2 to 6000
and from 10 to 10000 µg L-1, respectively.
For blood, a similar procedure was used (six different concentrations of each solvent, 5 replicates per concentration). The concentrations ranged from 16.6 to 1000 µg L-1 for toluene and from 33.2 to 2000 µg L-1 for
benzene and n-hexane when CAR-PDMS fibers were used. The same procedure was adopted for PDMS ibers. However, the concentrations of toluene and benzene varied between 50 and 1000 µg L-1 and n-hexane between 100
and 2000 µg L-1.
The lowest and highest values of the linear range for each analyte were deined taking into account the LOQ (limit of quantiication) and the detector sensitivity response to each solvent. Isooctane was used as an internal standard for urine samples and ethylbenzene for bloods samples.
The linear regression was calculated by the least mean square method. Quantiication limit (LOQ) was established as the concentration that provides an analytical signal ten times higher than noise with adequate precision (RSD < 20%). The LOQ for each solvent was the irst concentration in the calibration curves. The intra-assay and inter-assay precision was estimated using spiked samples of urine or blood in ive replicates at three concentrations levels within the linearity range.
Biological samples
Urine and blood samples were collected from healthy, non-smoking volunteers unexposed to VOC’s (blank samples) for method optimization and validation. Samples from workers handling leather glue in shoe repair shops were obtained from seven volunteers and collected at the end of their work shift. Spot urine specimens were collected directly from the donor in 50 mL polyethylene vials. Aliquots of 8 mL from each sample were immediately transferred to headspace vials containing the internal standard and salt and then sealed. Blood was collected in a disposable system (BD Vacuntainer®, Franklin Lakes, NJ, USA) and 2 mL aliquots
were taken and treated as described for urine. The collection of urine and blood was in agreement with criteria established by the Ethics Committee of the Federal University of Alfenas (Unifal-MG).
Results and Discussion
Lee et al.27 evaluated the occupational exposure of benzene and toluene in urine and blood, but analyzing these compounds in rat blood and urine. Alegretti et al.23 quantiied benzene, toluene and xylenes in whole blood to evaluated extreme exposure in inhalants addicts. Asakawa et al.26 measured the occupational exposure of toluene
and xylenes in urine of plastic ilms industry worker’s. Moreover, poor epidemiological data about occupational exposure of Brazilian’s shoes workers were found in the literature.
Optimization of the chromatographic conditions
An adequate resolution was obtained using the ZB-1 megabore column (30 m × 0.53 mm i.d. × 5 µm ilm
thickness). Oven temperature was kept at 80 ºC for 3 min and then heated at a rate of 10 ºC min-1 until reaching
150 ºC. The temperature was maintained at 150 ºC for 3.2 min and then raised to 220 ºC at a rate of 40 ºC min-1 and
then held for 6 min. Desorption was set at 240 ºC for 5 min (PDMS iber) or at 260 ºC for 10 min (CAR-PDMS iber), which allowed a complete desorption, without carryover.
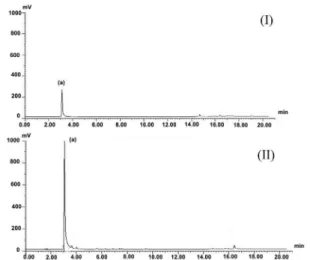
Better resolution among analytes and endogenous components from urine and blood as well as minimum peak tailing were observed under the optimized conditions. Moreover, ZB-1 presented an adequate ilm thickness and hydrophobic phase which allowed better separation when compared to the other columns tested. Figures 1 and 2 present chromatograms of blank urine and blood samples, respectively. In both chromatograms no interfering peaks from endogenous compounds were observed among the analytes retention times (6-12 min).
Figures 3 and 4 show chromatograms of spiked urine and blood, respectively. The peaks obtained with CAR-PDMS ibers show peak tailing, which can be attributed to the slower desorption rate from this iber. However, signiicantly greater responses were obtained with CAR-PDMS ibers when compared with CAR-PDMS ibers.
HS-SPME conditions
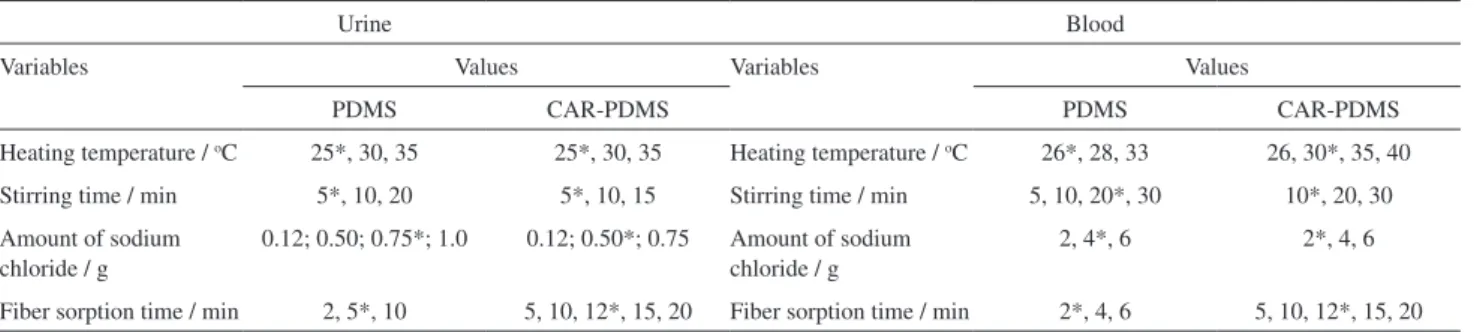
Table 1 summarize the variables studied and the ones selected as optimum for each solvent in urine and blood respectively.
A great number of fiber phases are commercially available today. PDMS ibers have been largely used to
Figure 1. Chromatogram of blank urine extracted by PDMS iber (I) and
by CAR-PDMS (II), spiked with 200 µL methanol(a).
Figure 2. Chromatogram of blank blood extracted by PDMS iber (I) and
by CAR-PDMS fiber (II), containing 50µL de methanol(a).
Figure 3. Chromatogram (I) of spiked urine extracted by PDMS iber with
extract various analytes, especially VOCs, while CAR-PDMS ibers have also been utilized in analysis of VOCs, particularly in trace analysis.27,32-34
The mechanism of extraction varies depending on the type of coating used. PDMS coating is one of the most widely used coatings for extracting volatile compounds because of the relative ease of extraction by absorption, which is not affected by competition between analytes. This process depends on the partition coeficient sample/ headspace. At the same time, coating thickness and molecular size of analyte will determine the capacity of absorption on the iber.1
On the other hand, the sensitivity of mixed-phase SPME coatings, such as CAR-PDMS, is reported to be much higher compared to PDMS for extracting volatile compounds.32,33 In addition, CAR-PDMS coated ibers
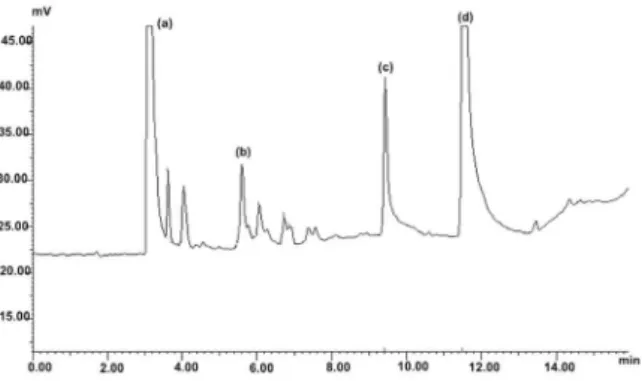
Figure 4. Typical chromatogram (I) of spiked blood extracted by PDMS
iber with 100 µg L-1 of n-hexane (b), and benzene (c), 50 µg L-1 toluene (d) and 2000 µg L-1 of ethylbenzene (e). Chromatogram (II) of spiked blood extracted byCAR-PDMS with 33.8 µg L-1 of n-hexane (b) and benzene (c),
16.8 µg L-1 toluene (d) and 2000 µg L-1 of ethylbenzene (e).
Table 1. Levels of the HS-SPME parameters evaluated during univariate optimization for urine and blood samples
Urine Blood
Variables Values Variables Values
PDMS CAR-PDMS PDMS CAR-PDMS
Heating temperature / oC 25*, 30, 35 25*, 30, 35 Heating temperature / oC 26*, 28, 33 26, 30*, 35, 40
Stirring time / min 5*, 10, 20 5*, 10, 15 Stirring time / min 5, 10, 20*, 30 10*, 20, 30 Amount of sodium
chloride / g
0.12; 0.50; 0.75*; 1.0 0.12; 0.50*; 0.75 Amount of sodium chloride / g
2, 4*, 6 2*, 4, 6
Fiber sorption time / min 2, 5*, 10 5, 10, 12*, 15, 20 Fiber sorption time / min 2*, 4, 6 5, 10, 12*, 15, 20 *Optimized values.
exhibit micro and mesopores with 2-20 Å diameter, appropriate for extracting compounds, such as solvents, containing 2-12 carbons in their molecular structures. These coatings extract primarily via adsorption into the iber coating and require more time to reach equilibrium or saturation of the pores. The results showed in Table 1 demonstrate the higher sorption time of CAR-PDMS compared to PDMS ibers. Also, different desorption times and temperatures emphasize these properties: CAR-PDMS ibers required 10 min at 260 ºC for complete desorption, without carryover, while PDMS required only 5 min at 240 ºC. Despite this higher sorption time, greater amounts of volatile and semi-volatile compounds were extracted by CAR-PDMS compared to PDMS. The competitive adsorption and displacement effects make mass equilibrium and quantification particularly challenging, as observed in the narrow linear range of CAR-PDMS compared with PDMS fibers35
(see Tables 2 and 3).
Method validation
Tables 2 and 3 report the validation parameters established for urine and blood respectively. For urine, R2 values > 0.99 were obtained for all solvents, regardless
of the iber type. For blood samples R2 values > 0.99 were
obtained, except for toluene (R2 = 0.98) in PDMS ibers.
Variation of coeficients lower than 17% was observed for both ibers. These results are in accordance with ANVISA,36
FDA37 and IUPAC38 requirements.
selected to obtain a lower LOQ. In the case of blood it is not recommended to use a large sample volume due to the invasive procedure of sampling.
Samples from occupationally exposed workers
The validated method was applied to the determination of toluene, benzene and n-hexane in urine and blood collected from seven shoe workers who handle glues containing solvents, mainly toluene and n-hexane. In blood samples, the use of CAR-PDMS ibers allowed the quantiication of toluene (from 16.0 to 55.2 µg L-1)
in all samples. Only one blood sample presented result for toluene when using PDMS iber (53.9 µg L-1). The
biological exposure index (BEI) for toluene in blood, as recommended by the ACGIH, is 50 µg L-1. This represents
the maximum allowable blood concentration which presents no risk for the majority of workers exposed to the solvent in an occupational environment. Only one worker presented blood toluene higher than the allowable BEI, while the other workers were within acceptable exposure levels. Figure 5 shows a chromatogram of the analysis of blood sample from a shoe worker.
Benzene was not detected in any sample, regardless the use or not of cigarette by the worker. Although the levels of the solvent in biological luids of smokers are higher than in the non smokers, concentrations varying between 191-942 ng L-1
in urine39 and 81-1136 ng L-1 in blood.40 The LOQ of the
method used is higher than its detection in situations of environmental or smoking exposure. On the other hand, as mentioned earlier, benzene was banned as an additive in glues long time ago.
Table 3. Validation data obtained for the solvents analysis in blood samples
Compound Linearity range / (µg L-1) Regression data
(a, b, r)
Level Precision / (%CV) Intra-assay
Precision / (%CV)
Day1 Day2 Day3 PDMS CAR-
PDMS
PDMS PDMS
PDMS PDMS
CAR-PDMS
n-hexane 100-2000 33-2000 0.014 0.125
0.0003 0.0012 0.9967 0.9962
Low Medium High
12 7.0 11 4.1 8.1 3.4
12 2.5 0.5
7.6 10 12
7.2 12 0.3 benzene 100-2000 33-2000 0.015 0.183 0.0007 0.0022 0.9934 0.9970 Low Medium High 6.7 15
5.2 5.7 7.1 7.8 17 7.5 10
9.1 1.0 2.4 6.1 9.2 1.6 toluene 50-1000 16.6-1000 0.040 0.152 0.0013 0.0025 0.9869 0.9998 Low Medium High 7.5 16
6.6 2.5 11 9.9 11 17 17
12 4.4 8.6 11 13 11
PDMS: a=intercept, b=slope, r=correlation coeficient. Low level =100 µg L-1n-hexane, benzene, 50 µg L-1 toluene. Medium level = 500 µg L-1n-hexane andbenzene, 250 µg L-1 toluene. High level = 2000 µg L-1n-hexane and benzene, 1000 µg L-1 toluene. CAR-PDMS: Low level = 33 µg L-1n-hexane and benzene, 16 µg L-1 toluene Medium level = 500 µg L-1n-hexane and benzene, 250 µg L-1 toluene. High level = 2000 µg L-1n-hexane and benzene, 1000 µg L-1 toluene. Table 2. Validation data obtained for the solvents analysis in urine samples Compound Linearity range / (µg L-1) Regression data (a, b, r) Level Precision / (%CV) Intra-assay Precision / (%CV) Day1 Day2 Day3 PDMS PDMS PDMS CAR- PDMS PDMS CAR- PDMS CAR-PDMS n-hexane 10-10000 1-540 −0.1163 0.2995 0.7925 0.0172 0.9984 0.9954 Low Medium High 11 15
10 10
7.0 9.3 1.9 14 11
6.8 10 4.3 9.3 9.3 0.3 benzene 2-6000 2-420 −0.0882 −1.5559 1.6276 0.0358 0.9977 0.9959 Low Medium High 13 11
13 9.3 4.9 11
10 12 7.1 9.1 9.3 6.7 11 11 14
toluene 92-2000 92-560 −0.3524 −3.515 3.769 0.0431 0.9955 0.9956 Low Medium High 11 8.3 12 10
8.9 11
10 8.3 11
13 10 11
11 11 15 PDMS: a=intercept, b=slope, r=correlation coeficient. Low level =10 µg L-1n-hexane and benzene, 92 µg L-1 toluene. Medium level = 2500 µg L-1
n-hexane, 1500 µg L-1 benzene, 500 µg L-1 toluene. High level = 10000 µg L-1n-hexane, 6000 µg L-1 benzene, 2000 µg L-1 toluene. CAR-PDMS:
Low level = 10 µg L-1n-hexane, benzene, 92 µg L-1 toluene. Medium level = 270 µg L-1n-hexane, 210 µg L-1 benzene, 280 µg L-1 toluene. High level = 540 µg L-1
n-Hexane was detected in blood from only two volunteers (33.0 and 41.3 µg L-1). Imbriani and
co-workers39,41,42 reported that the urine concentration of
unaltered n-hexane corresponding to the TLV-TWA (50 ppm, ACGIH) was 13.09 µg L-1, not mentioning the
corresponding value for blood samples. Although no positive results were obtained for n-hexane in the urine samples from exposed workers, the LOQ established for both ibers permits its use for analysis at concentrations lower than the reported biological limit. At present, there is no established biological limit value for unaltered benzene in urine or blood. No solvent could be detected in any urine sample, regardless of the iber type.
Conclusions
The HS-SPME analytical method proposed for toluene, benzene and n-hexane analysis in blood and urine is highly sensitive and speciic and can be performed with equipment available in most laboratories (HS/SPME-GC/FID). The LOQ, precision and linearity obtained support its usefulness in routine biomonitoring analysis, with CAR-PDMS ibers, having lower levels of detection for solvent exposure and is recommended for blood analysis.
Acknowledgments
The authors would like to thank the inancial support from CNPq (Conselho Nacional de Desenvolvimento Científico e Tecnológico) and the grant provided by Fapemig (Fundação de Auxílio à Pesquisa do Estado de Minas Gerais).
References
1. Parreira, F. V.; Cardeal, Z. d. L.; Quim. Nova2005, 28, 646. 2. Keith, L. H.; Principles of Environmental Sampling, 2th ed.,
ACS: Washington, 1996.
3. Statheropoulos, M.; Sianos, E.; Agapiou, A.; Georgiadou, A.; Pappa, A.; Tzamtzis, N.; Giotaki, H.; Papageorgiou, C.; Kolostoumbis, D.; J. Chromatogr., B2005, 822, 112. 4. Mills, G. A.; Walker, V.; J. Chromatogr., A2000, 902, 267.
5. Hamelin, G.; Truchon, G.; Tardif, R.; Int. Arch. Occup. Environm. Health2004, 77, 264.
6. Spencer, P. S.; Schaumburg, H. H.; Sabri, M. I.; Veronesi, B.;
Crit. Rev. Toxicol.1980, 7, 279.
7. Graham, D. G.; Amarnath, V.; Valentine, W. M.; Pyle, S. J.; Anthony, D. C.; Crit. Rev. Toxicol.1995, 25, 91
8. ANP – AGÊNCIA NACIONAL DE PETRÓLEO BRASIL, MINISTÉRIO DO TRABALHO (MT) & MINISTÉRIO DA SAÚDE (MS) – Portaria Ministerial n°3, 28 de abril, 1982. 9. ANVISA, Diário Oicial da União, RDC ANVISA Nº 252,
(16-09-2003), http://e-legis.anvisa.gov.br/leisref/public/showAct. php?id=8127, accessed in January 2009.
10. IARC Monographs; Evaluation of Carcinogenic Risks to Humans, 1987, vol. 1-42, suppl. 7, 120.
11. Ott, M. G., Townsend, J. C., Fishbeck, W. A., Langner, R. A.;
Arch. Environ. Health1978, 33, 3.
12. Rinsky, R. A.; Environ. Health Perspect.1989, 82, 189. 13. Aksoy, M.; Environ. Health Perspect.1989, 82, 193.
14. Basilicata, P.; Miraglia, N.; Pieri, M.; Acampora, A.; Soleo, L.; Sannolo, N.; J. Chromatogr., B2005, 818, 293.
15. Hite, M.; Pecharo, M.; Smith, I.; Thornton, S.; Mutat. Res.1980,
77, 149.
16. Forni, A.; Environ. Health Perspect.1996, 104, 1309. 17. Tice, R. R.; Costa, D. L.; Drew, R. T.; Proc. Natl. Acad. Sci. U.
S. A.1980, 77, 2148.
18. Fustinoni, S.; Buratti, M.; Giampiccolo, R.; Brambilla, G.; Foà, V.; Colombi, A.; Int. Arch. Occup. Environm. Health2000, 73, 389. 19. Kramer Alkalde, T.; do Carmo Ruaro Peralba, M.; Alcaraz
Zini, C.; Bastos Caramao, E.; J. Chromatogr., A2004, 1027, 37.
20. Rolle-Kampczyk, U.; Herbarth, O.; Rehwagen, M.; J. Environ. Med.1999, 1, 65.
21. Kumar, S.; Tiwari, G. N.; Singh, H. N.; Desalination2000, 127, 79.
22. Alvarez-Leite, E. M.; Duarte, A.; Barroca, M. M.; Silveira, J. N.; J. Occup. Health1999, 41, 112.
23. Alegretti, A. P.; Thiesen, F. V.; Maciel, G. P.; J. Chromatogr., B2004, 809, 183.
24. American Conference of Governmental Industrial Hygienists (ACGIH), Thershold Limit Values and Biological Exposure Indices for 2006, ACGIH: Cincinatti, 2006.
25. Fernandes, C.; Neto, A. J. d. S.; Rodrigues, J. C.; Alves, C.; Lancas, F. M.; J. Chromatogr., B2007, 847, 217.
26. Asakawa, F.; Jitsunari, F.; Choi, J.; Suna, S.; Takeda, N.; Kitamado, T.; Bull. Environ. Contam. Toxicol.1999, 62, 109. 27. Lee, X.-P.; Kumazawa, T.; Kondo, K.; Furuta, S.; Sato, K.;
Legal Medicine1999, 1, 231.
Figure 5. Chromatogram of shoe worker’s blood containing
28. Fustinoni, S.; Giampiccolo, R.; Pulvirenti, S.; Buratti, M.; Colombi, A.; J. Chromatogr., B1999, 723, 105.
29. Perbellini, L.; Pasini, F.; Romani, S.; Princivalle, A.; Brugnone, F.; J. Chromatogr., B2002, 778, 199.
30. Karaconji, I. B.; Skender, L.; Arh Hig Rada Toksikol2007, 58, 421.
31. Schimming, E.; Levsen, K.; Kohme, C.; Schurmann, W.;
Fresenius J. Anal. Chem.1999, 363, 88.
32. Elke, K.; Jermann, E.; Begerow, J.; Dunemann, L.;
J. Chromatogr., A1998, 826, 191.
33. Ezquerro, O.; Ortiz, G.; Pons, B.; Tena, M. T.; J. Chromatogr., A2004, 1035, 17.
34. Michulec, M.; Wardencki, W.; J. Chromatogr., A2005, 1071, 119.
35. Koziel, J.; Jia, M.; Pawliszyn, J.; Anal. Chem.2000, 72, 5178. 36. ANVISA, Diário Oicial da União, Resolução RE No. 899, 29
de Maio de 2003, Guia para Métodos Analíticos e Bioanalíticos, 2003.
37. FDA, U.S. Food and Drug Administration, Rockville, 2001. (incomplete)
38. Thompson, M.; Elisson, S. L. R.; Wood, R.; Pure Appl. Chem.
2002, 74, 835.
39. Imbriani, M.; Ghittori, S.; Int. Arch. Occup. Environm. Health
2005, 78, 1.
40. Ong, C.-N.; Lee, B.-L.; J. Chromatogr., B1994, 660, 1. 41. Imbriani, M.; Ghittori, S.; Borlini, F.; Pezzagno, G.; Capodaglio,
E.; Boll.-Soc. Ital. Biol. Sper.1986, 60, 1919.
42. Imbriani, M.; Ghittori, S.; Pezzagno, G.; Capodaglio, E.; Int. Arch. Occup. Environm. Health1984, 55, 33.
Received: January 21, 2009