Polarized Raman spectra of
L
-arginine hydrochloride monohydrated single crystal
J.L.B. Faria
Departamento de F´ısica, Universidade Federal de Mato Grosso, Cuiab´a-MT, 78060-900, Brazil
P.T.C. Freire,∗ R.O. Gonc¸alves, F.E.A. Melo, and J. Mendes Filho Departamento de F´ısica, Universidade Federal do Cear´a, Fortaleza-CE, 60455-760, Brazil
R.J.C. Lima, A.J.D. Moreno
Centro de Ciˆencias Sociais, Sa´ude e Tecnologia, Universidade Federal do Maranh˜ao, Imperatriz-MA, 65900-410, Brazil (Received on 16 October, 2009)
Polarized Raman spectra ofL-arginine hydrochloride monohydrated single crystal in nine different scattering geometries of the two irreducible representations of factor groupC2were studied at room temperature. The
experimental wavenumber values are compared with those obtained from ab-initio calculation and the assign-ment of the Raman bands to the respective molecular vibrations is also given. Finally, a discussion related to a previously reported phase transition undergone byL-arginine hydrochloride monohydrated single crystal at low temperature is furnished.
Keywords:
1. INTRODUCTION
Amino acids (NH2−CH−COOH−R, whereRis a
rad-ical) are the basic units of proteins and peptides of all liv-ing beliv-ings. For an unknown reason Nature has choose 20 of these special molecules, differing in theRpart, to form the impressive number of proteins found in our planet. L -arginine, among other amino acids, and its salts, includingL -arginine·HCl, is known to protect protein from inactivation
in frozen solutions, during freeze-drying [1], during spray-drying [2] and in the storage of lyophilized solids [3]. Be-yond this, L-arginine and acid combinations have been ex-tensively used in the last years to assist in the recovery of chemically unfolded proteins and recombinant proteins ex-pressed in inclusion bodies [4].
Beyond these biological aspects related to amino acid in general, and L-arginine in particular, it is also possible to found interesting physical properties related to this amino acid. For example, the search for new non-linear optical materials with high non-linear coefficients and high damage threshold has lead to the discovery ofL-arginine phosphate monohydrate (LAP) [5]. These studies also allowed the dis-covery of new materials havingL-arginine as the main sub-stance. Among these material is L-arginine hydrochloride monohydrate (LAHW) whose several physical properties as thermal expansion, elastic properties and dielectric charac-teristics were presented in Ref. [6].
Some works deal with the temperature behavior of L -arginine·HCl·H2Omonocrystals. It was observed that
un-der high temperature conditions LAHW begins to lost water of crystallization at 70oCand at 200oCabout two-third of it
are eliminated [7]. Under low temperature conditions, on the other hand, it was observed through Raman scattering tech-nique, evidence of a phase transition undergone by LAHW between 100 and 110K [8]. Although in the paper of Ref. [8] some Raman spectra are presented, up to now, there is no
∗Electronic address:tarso@fisica.ufc.br
complete investigation of the polarized Raman spectra for LAHW, as well as, an assignment of the observed modes. Such assignment is very important because it helps us to un-derstand what vibrations are related to the crystal modifica-tions, in particular under temperature and pressure changes.
The objective of this paper is twofold: (i) to present the Raman spectra in the spectral region 20−3700cm−1for nine
scattering geometries of the two irreducible representations of theC2factor group; (ii) to give a tentative assignment of
the observed Raman bands based onab-initiocalculations.
2. EXPERIMENTAL
Single crystals of LAHCL were grown from aque-ous solution containing L-arginine hydrochloride powder,
C6H14N4O2·HCl, from Sigma by the slow evaporation
method at controlled temperature(293K). In order to char-acterize and to do the orientation of the crystals we used X-ray diffraction patterns obtained from a Rigaku DMAX diffractometer usingCu Kαradiation monochromated with
a graphite crystal. The Raman spectra were obtained with a Jobin Yvon T64000 micro-Raman system equipped with an
N2-cooled charge coupled device system. The samples were
polished with diamond paste with granulations with 10, 3 and 1µm. The slits were set for a 2cm−1spectral resolution. Excitation was effected with the 514.5nmradiation from an argon ion laser. The incident laser had a power less than 5mW on the surface of the sample.
3. RESULTS AND DISCUSSION
Fig. 1 presents the zwitterion form of an arginine molecule (the number associated to the atoms will be used in the assignment of the normal modes). Single crystal data of LAHW crystal confirms that the compound grows with a monoclinic lattice belonging to the P21(C22) space group
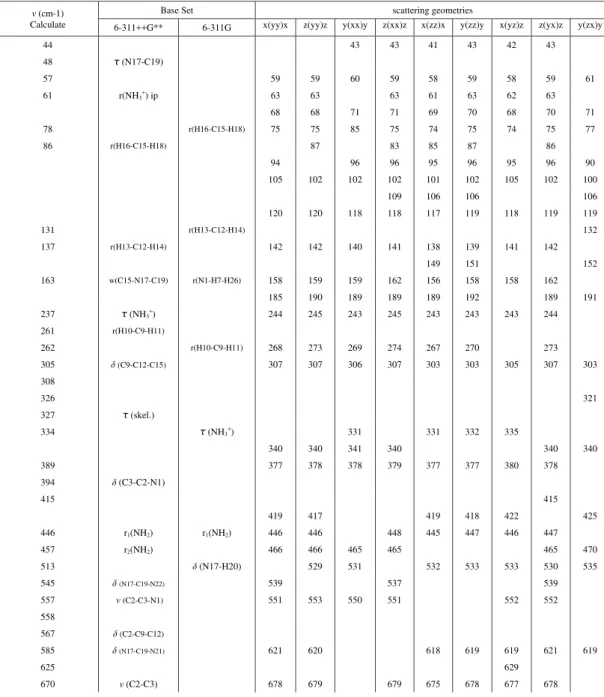
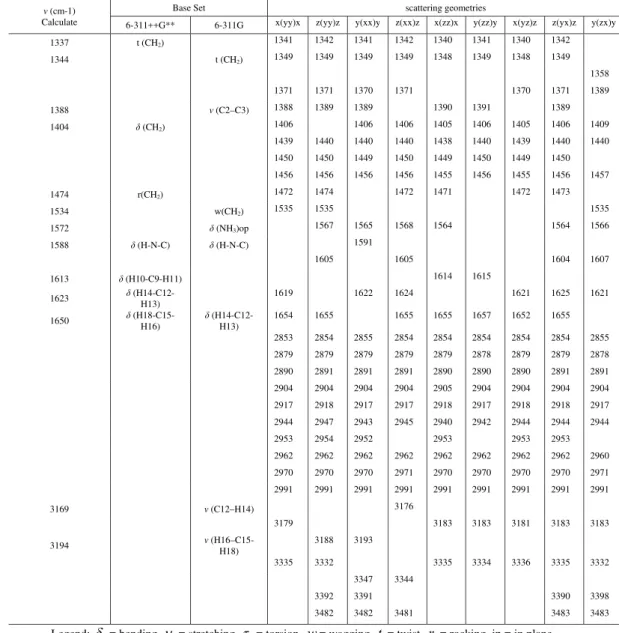
Table 1. Wavenumbers (cm-1) and tentative assignment for the bands appearing in the Raman
spectra of LAHW crystal at room temperature. The notation a(bc)d is the conventional Porto
notation, where a and d represent the directions of the incident and the scattered light and b and
c represent the directions of polarizations of the incident and the scattered light.
ν(cm-1)
Calculate
Base Set scattering geometries
6-311++G** 6-311G x(yy)x z(yy)z y(xx)y z(xx)z x(zz)x y(zz)y x(yz)z z(yx)z y(zx)y
44 43 43 41 43 42 43
48 τ (N17-C19)
57 59 59 60 59 58 59 58 59 61
61 r(NH3+) ip 63 63 63 61 63 62 63
68 68 71 71 69 70 68 70 71
78 r(H16-C15-H18) 75 75 85 75 74 75 74 75 77
86 r(H16-C15-H18) 87 83 85 87 86
94 96 96 95 96 95 96 90
105 102 102 102 101 102 105 102 100
109 106 106 106
120 120 118 118 117 119 118 119 119
131 r(H13-C12-H14) 132
137 r(H13-C12-H14) 142 142 140 141 138 139 141 142
149 151 152
163 w(C15-N17-C19) r(N1-H7-H26) 158 159 159 162 156 158 158 162
185 190 189 189 189 192 189 191
237 τ (NH3+) 244 245 243 245 243 243 243 244
261 r(H10-C9-H11)
262 r(H10-C9-H11) 268 273 269 274 267 270 273
305 δ(C9-C12-C15) 307 307 306 307 303 303 305 307 303
308
326 321
327 τ (skel.)
334 τ (NH3
+
) 331 331 332 335
340 340 341 340 340 340
389 377 378 378 379 377 377 380 378
394 δ(C3-C2-N1)
415 415
419 417 419 418 422 425
446 r1(NH2) r1(NH2) 446 446 448 445 447 446 447
457 r2(NH2) 466 466 465 465 465 470
513 δ(N17-H20) 529 531 532 533 533 530 535
545 δ(N17-C19-N22) 539 537 539
557 ν(C2-C3-N1) 551 553 550 551 552 552
558
567 δ(C2-C9-C12)
585 δ(N17-C19-N21) 621 620 618 619 619 621 619
625 629
670 ν(C2-C3) 678 679 679 675 678 677 678
of LAHW, all the atoms occupy sites with symmetryC1and
the 186 vibrations can be decomposed into the irreducible representations of the factor groupC2asΓ=93A+93B, with
oneAand twoBbelonging to the acoustic branch and all the other being Raman and infra red active. In Figs. 2 – 5, Z
represents an axis parallel to the [001] direction, X repre-sents an axis parallel to the [100] direction andY is an axis perpendicular to theXandZaxes.
In order to give insights about the assignment of the nor-mal modes of the crystal we have performed ab initio cal-culations. All calculations were carried out using
Gaus-sian98 (by computational resources in CENAPAD’s facili-ties) and the results were viewed by MOLEKEL programme packages. Geometry optimization and frequency calculation for L-arginine in the gas phase were performed with Self-Consistent methods and Hartree-Fock (HF) level of theory, with 6−31+G(d,p)and 6−311+ +G(d,p)basis sets. The
out-ν(cm-1) Calculate
Base Set scattering geometries
6-311++G** 6-311G x(yy)x z(yy)z y(xx)y z(xx)z x(zz)x y(zz)y x(yz)z z(yx)z y(zx)y
692 701 702 702 700 701 700 702
717 w(N21-C19-N17-N22)
732 w(N17-C19-N22) 751 753 751 748 753
786 τ (skel.) 784 784 782 782 783 783 777
799
829
831 831 831 830 830
846 δ(CO2
-) 843 843 843 843 842 843 842 843 841
885
890 δ (N21-H23) 892 897 898 890 892 890 892 891
894 r(NH3+) op 897 898 897 898 897 898 898
900
902
904
929 w(NH2) 930 931 931 930 929 930 930 930 930
939 940 939 939 939 939 939 940 940
950 955 953 955
957 960 960 959 959 958 959 958 959 957
1001 r1'(NH3
+ ) op
1006
1029 1029 1027 1028 1028 1029 1029 1021 1029
1049 1049 1049 1049 1049 1049 1049 1050
1053 ν(C2-N1) 1052 1053 1059 1052 1052
1073 1062 1059 1060 1060 1057 1064
1096 r1(NH3
+
) op 1089 1092 1092 1090 1090 1090 1093 1091
1099 1100 1099 1099 1100 1101 1099 1099 1101
1112 δ1(N1-H26)
1132 1134 1135 1136 1133
1120 r2'(NH3+) op
1144 w(N1-H5-H26) 1139 1138 1138 1140 1142
1163 ν(C19-N22)
1172 δ2(N1-H26)
1180 r2(NH3+) op 1179 1181 1177 1179 1176 1178 1179 1180 1179
1211 r1"(NH3+) op w (NH3+)
1231 1231 1232
1247 r2"(NH3
+
) op 1253 1250 1250 1253 1253
1257 t1(NH2)
1259 r2(NH2)
1275
1282 δ(N21-H23) 1291
1294 t2(NH2) 1297 1298 1297 1298 1297 1298
1309 1307 1307 1308
1312 1312 1312 1312 1313 1312 1313 1313
1326 1326 1325 1326 1324 1325 1326 1326 1326
put file contained the optimized structure, the Raman and IR intensities and frequencies, and the atomic displacements for each mode. At the optimized structure of the molecule, no imaginary frequency was obtained, proving that a true mini-mum of the potential energy surface was found.
In all spectra presented in this paper we use the conven-tional Porto notationa(bc)d, whereaanddrepresent the di-rections of the incident and the scattered light andbandc
represent the directions of polarizations of the incident and the scattered light. The scattering geometries in all figures are related to the irreducible representations of the factor
groupC2as follows: x(yy)x,z(yy)z,y(xx)y,z(xx)z,x(zz)x, y(zz)yandz(yx)zare fromAirreducible representation and
x(yz)xandy(zx)yare from theBirreducible representation. Figure 2 presents the Raman spectra of LAHW for nine different scattering geometries in the spectral region 25−
225 cm−1 at room temperature. This region is known to have the lattice modes of the crystal (ω<200 cm−1), al-though some internal modes can also be observed with low wavenumber, as occurs with the torsional vibration ofCO2,
τ(CO2), for L-asparagine monohydrated [9], L-valine [10]
ν(cm-1) Calculate
Base Set scattering geometries
6-311++G** 6-311G x(yy)x z(yy)z y(xx)y z(xx)z x(zz)x y(zz)y x(yz)z z(yx)z y(zx)y
1337 t (CH2) 1341 1342 1341 1342 1340 1341 1340 1342
1344 t (CH2) 1349 1349 1349 1349 1348 1349 1348 1349
1358
1371 1371 1370 1371 1370 1371 1389
1388 ν (C2–C3) 1388 1389 1389 1390 1391 1389
1404 δ (CH2) 1406 1406 1406 1405 1406 1405 1406 1409
1439 1440 1440 1440 1438 1440 1439 1440 1440
1450 1450 1449 1450 1449 1450 1449 1450
1456 1456 1456 1456 1455 1456 1455 1456 1457
1474 r(CH2) 1472 1474 1472 1471 1472 1473
1534 w(CH2) 1535 1535 1535
1572 δ (NH3)op 1567 1565 1568 1564 1564 1566
1588 δ (H-N-C) δ (H-N-C) 1591
1605 1605 1604 1607
1613 δ (H10-C9-H11) 1614 1615
1623 δ (H14-C12-H13) 1619 1622 1624 1621 1625 1621
1650 δ
(H18-C15-H16)
δ (H14-C12-H13)
1654 1655 1655 1655 1657 1652 1655
2853 2854 2855 2854 2854 2854 2854 2854 2855
2879 2879 2879 2879 2879 2878 2879 2879 2878
2890 2891 2891 2891 2890 2890 2890 2891 2891
2904 2904 2904 2904 2905 2904 2904 2904 2904
2917 2918 2917 2917 2918 2917 2918 2918 2917
2944 2947 2943 2945 2940 2942 2944 2944 2944
2953 2954 2952 2953 2953 2953
2962 2962 2962 2962 2962 2962 2962 2962 2960
2970 2970 2970 2971 2970 2970 2970 2970 2971
2991 2991 2991 2991 2991 2991 2991 2991 2991
3169 ν (C12–H14) 3176
3179 3183 3183 3181 3183 3183
3194 ν
(H16–C15-H18)
3188 3193
3335 3332 3335 3334 3336 3335 3332
3347 3344
3392 3391 3390 3398
3482 3482 3481 3483 3483
Legend: δ = bending, ν = stretching, τ = torsion, w= wagging, t = twist, r = rocking, ip = in plane,
op = out of plane, skel. = framework vibration; subscripts indicate degenerence; superscript indicate same vibration for diferent atoms in same cluster. Atom numbering is shown in Figure 1.
FIG. 1: Molecule of arginine in the zwitterion form.
In fact, the ab initio calculations performed in the present work show the occurrence of vibrations withω<200cm−1
that can be associated to internal modes. As an example,
using the 6−311++G∗ ∗base set, it is possible to assign the
in-plane torsion ofNH3+,τ(NH3+)ip, as the mode appearing
with wavenumber of 63cm−1.
Related to the torsional vibration ofCO−
2,τ(CO2), our
cal-culations were not able to identify it precisely. However, it is possible to assign the band observed at ∼189 cm−1
as the τ(CO2). This is based on the studies performed on
other hydrogenated amino acid crystals [9 – 11] as well as in deuterated one [12]. Such an assignment is important be-cause under extreme conditions torsional vibrations ofCO2
can present particular behavior and furnish insights about the hydrogen bonds, as those presented by L-alanine-d7 under pressure variation [13].
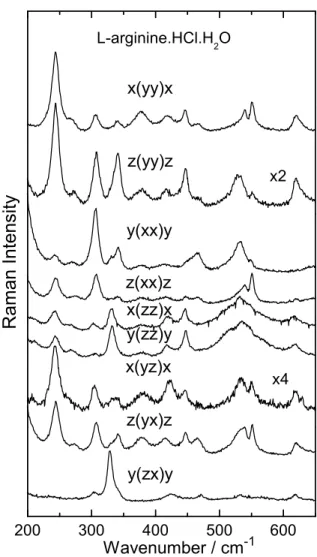
Fig. 3 presents the Raman spectra of LAHW for nine different scattering geometries in the spectral region 200−
650cm−1. In this region it is found the bands associated to
torsional vibration ofNH3+,τ(NH+
3). In general, the band
50 100 150 200 y(zx)y z(yx)z x(yz)x y(zz)y x(zz)x z(xx)z y(xx)y z(yy)z x2 x4 R a m a n I n t e n s i t y
W avenum ber / cm -1 x(yy)x L-arginine.HCl.H
2 O
FIG. 2: Raman spectra ofL-Arginine hydrochloride monohydrate crystal in several scattering geometries in the 25−225cm−1
spec-tral region.
suggested by former works onL-alanine [12] andL-leucine [14]. Other important vibration is associated to the rocking ofNH2,r(NH2), which ab initio calculations show to be
be-tween 445 and 465cm−1. Bending vibration of NH are also
found in this spectral region, at about 530cm−1, while the
bending ofN−C−N,δ(NCN), was identified as the peak at ∼551cm−1, a band with small linewidth as can be observed
in Fig. 3 for some scattering geometries.
Fig. 4 presents the Raman spectra of LAHW in the spec-tral region 650−1750cm−1for nine different scattering
ge-ometries. This region presents a series of bands and the ab initio calculation was fundamental to assign in a most precise manner. The peak observed at about 678cm−1was associ-ated to aC2−C3 stretching vibration,ν(C2−C3). Here we
need to state the following observation: both,C2 andC3 car-bon atoms are hold with other atoms (NH3forC2 andO2for C3) in such a way that we do not have aC−C“pure”
vibra-tion, as occurs with diamond; this explains why for diamond the ν(C−C)vibration is observed at 1332cm−1. A
wag-ging vibration related to theN−C−N unit was associated
to the band observed at 751cm−1. The bending ofCO−
2 unit,
200 300 400 500 600
y(zx)y z(yx)z x(yz)x y(zz)y x(zz)x z(xx)z y(xx)y z(yy)z x(yy)x L-arginine.HCl.H 2 O x2 x4 R a m a n I n t e n s i t y
W avenumber / cm -1
FIG. 3: Raman spectra ofL-Arginine hydrochloride monohydrate crystal in several scattering geometries in the 200−650cm−1
spec-tral region.
δ(CO−
2), was observed at 843 cm−1, as pointed out by our
calculations. The bands observed at about 930 and 940cm−1
were associated to the wagging vibration ofNH2,w(NH2).
The stretching vibration ofC2−N1,ν(C2−N1), was
asso-ciated to the band observed at∼1052cm−1, and an
out-of-planeNH3+rocking vibration,r(NH3+), was assigned as the band observed at about 1090cm−1. An out-of-planeNH+
3
vibration was assigned as the band observed at∼1250cm−1.
Many bands are observed between 1300 and 1400cm−1,
among them the twist vibration of CH2, t(CH2). It is
worth to note that the 6-311G basis of calculation suggests that theC2−C3 stretching vibration should be observed at
1388cm−1. However, because the reason given previously (carbon atoms bonded to other atoms) we believe that the suggestion is not correct. The band observed at 1406cm−1
was associated with the bending vibration ofCO−
2,δ(CO−2),
and a rocking vibration of the same unit,r(CO−
2), was
asso-ciated to the band observed at∼1472cm−1. Finally, in this
spectral region we also observed bending vibrations of the
FIG. 4: Raman spectra ofL-Arginine hydrochloride monohydrate crystal in several scattering geometries in the 650−1750cm−1
spectral region.
Fig. 5 presents the Raman spectra of LAHW crystal in the spectral region 2800−3600cm−1for nine different
scatter-ing geometries. The profile between 2800 and 3000 cm−1 is very rich, originated mainly from stretching vibrations of
CH. However, our calculations were not able to assign sep-arately all bands in this region. Finally, the bands with high linewidths centered at∼3200cm−1and 3400cm−1can be
associated to the stretching vibration of water,ν(H2O), as it
is expected from crystals with structural water [15].
With this assignment we can both (i) through light on the phase transition undergone by LAHW at low-temperatures and (ii) to give insights on future works on vibrational prop-erties of the crystal under high pressure conditions. Re-lated to the first point we remember that Raman spectroscopy study have suggested the occurrence of a phase transition un-dergone by LAHW crystal at about 110 K [8]. This phase transition was inferred mainly by the change of band pro-files in the low-wavenumber region of the spectra. Obvi-ously, as stated previObvi-ously, these modifications are associ-ated with lattice mode vibrations. Interesting enough is that we have also observed modifications in bands observed at 1088−1100cm−1. The assignment of the present study
con-firms the identification of such bands as rocking vibrations of NH3 units. In other words, our study reinforces the
in-terpretation that the low temperature phase transition under-gone by LAHW can be understood mainly as conformational change of theL-arginine molecules, mainly consequence of modifications on hydrogen bondsN−H. . .O, with the oxy-gen atom belong to a water molecule or to theCOO−group
FIG. 5: Raman spectra ofL-Arginine hydrochloride monohydrate crystal in several scattering geometries in the 2800−3600cm−1
spectral region.
of another arginine molecule. This is in good accordance with experimental facts already presented byL-cisteine [16] andL-serine [17] crystals when submitted to high pressure conditions – the change of molecular conformation, due to variations in the dimensions of hydrogen bonds, modifies the symmetry of the unit cell of the crystal.
Conclusions
In this paper we presented the polarized Raman spectra of LAHW in the spectral region between 25 and 3600 cm−1.
Ab initio calculations were used to assign most of the bands observed in all nine scattering geometries. With such identi-fication we gave insights about a previously observed phase transition undergone by LAHW at low temperatures. Finally, the work will be useful to understand eventual modifications in the Raman spectra of LAHW, for example, when submit-ted to high pressure conditions in future works.
Acknowledgments
package and for computational facilities through the project reference “proj373”.
[1] K. Seguro, T. Tamiyam, T. Tsuchiya, J.J. Matsumoto, Cryobi-ology27, 70 (1990).
[2] M. Mumenthaler, C.C. Hsu, R. Peralman, Pharm. Res.11, 12 (1994).
[3] C.C. Hsu, H.M. Hguyen, D.A. Yeung, D.A. Brooks, G.S. Koe, T.A. Bewlwy, R. Pearlman, Pharm. Res.12, 69 (1994). [4] T. Arakawa, K. Tsumoto, Biochem. Biophys. Res. Commun.
304, 148 (2003).
[5] S.B. Monaco, L.E. Davis, S.P. Velsko, F.T. Wang, D. Eimerl, A. Zalkin, J. Crystal Growth85, 252 (1987).
[6] S. Hausshe, J. Chrosch, F. Gnanam, E. Fiorentini, K. Recker, F. Wallrafen, Cryst. Res. Technol.25, 617 (1990).
[7] S. Mukerji, T. Kar, Mater. Chem. Phys.57, 72 (1998). [8] R.J.C. Lima, P.T.C Freire, J.M. Sasaki, F.E.A. Melo, J.Mendes
Filho, J. Raman Spectrosc.33, 625 (2002).
[9] A.J.D. Moreno, P.T.C. Freire, I. Guedes, F.E.A. Melo, J.M. Filho, J.A. Sanjurjo, Braz. J. Phys.29, 380 (1999).
[10] J.A. Lima Jr., P.T.C. Freire, R.J.C. Lima, A.J.D. Moreno, J.M.
Filho, F.E.A. Melo, J. Raman Spectrosc.36, 1076 (2005). [11] F.M. Almeida, P.T.C. Freire, R.J.C. Lima, C.M.R. Remdios,
J.M. Filho, F.E.A. Melo, J. Raman Spectrosc.37, 1296 (2006). [12] H. Susi, D.M. Byler, J. Mol. Struct.63, 1 (1980).
[13] J.M. Sousa, P.T.C. Freire, H.N. Bordallo, D.N. Argyriou, J. Phys. Chem. B111, 5034 (2007).
[14] P.F. Fac¸anha Filho, P.T.C. Freire, K.C.V. Lima, J. Mendes Filho, F.E.A. Melo, P.S. Pizani, Braz. J. Phys.38, 131 (2008). [15] A.J.D. Moreno, P.T.C.Freire, I. Guedes, F.E.A. Melo, J.
Mendes Filho, J.A. Sanjurjo, Braz. J. Phys.29, 380 (1999). [16] V.S. Minkov, A.S. Krylov, E.V. Boldyreva, S.V. Goryainov,
S.N. Bizyaev, A.N. Vtyurin, J. Phys. Chem. B 112, 8851 (2008).