Brazilian Journal of Physics, vol. 33, no. 4, December, 2003 709
Anisotropy in
M gB
2
O. F. de Lima
1and C. A. Cardoso
21Instituto de F´ısica Gleb Wataghin, UNICAMP, 13083-970, Campinas, S˜ao Paulo, Brazil
2Departamento de F´ısica, Grupo de Materiais e Dispositivos - MCDCM,
S˜ao Carlos, S˜ao Paulo, 13565-905, Brazil
Received on 23 May, 2003.
The first direct measurement of an anisotropic superconducting property inM gB2was achieved for the bulk
nucleation fieldHc2, in a sample of aligned crystallites. It was found a ratioγ(T) =H
ab c2/H
c
c2 = 1.6−1.9,
forT varying from 32 K to 26K, betweenH applied parallel to theabplane, and along thecdirection. The
anisotropy of the induced critical current density was evaluated through the Bean model to beJab
c /J
c c ≈1.5. We present here a brief review of these studies in connection with current results found in the literature.
1
Introduction
The strongly anisotropic crystalline structure of M gB2,
consisting of triangular layers of magnesium atoms sand-wiched between hexagonal layers of boron atoms, was known[1, 2] for almost 50 years before the discovery of superconductivity in this binary compound[3]. It seemed therefore reasonable when specific heat studies done in polycrystalline samples[4], as well as band structure calcu-lations [5], pointed to a possible anisotropic nature of the electronic and magnetic properties ofM gB2. The first
di-rect measurement of an anisotropic superconducting prop-erty was achieved for the bulk nucleation fieldHc2, in
sam-ples of alignedM gB2crystallites [6, 7]. It was found a ratio
γ =Hab
c2/Hcc2 ≈ 1.7, between the critical field parallel to
the ab plane and parallel to the c axis direction. Since then, different groups have found values ofγbetween 1.1 and 6, using different type of samples and different techniques to characterize the normal - superconducting transition[8, 9]. In our view the large scattering of reportedγ values could be ascribed mainly to three factors[7]: (1) the sample pu-rity, since it affects directly the energy gap anisotropy at the microscopic level, due mainly to inter- and intra-band scat-tering; (2) the experimental criterion used to define a reliable superconducting bulk transition; (3) the temperature depen-dence ofγ. Indeed, recent reports[10, 11] have shown that
γgoes from∼2to∼6 whenT varies between∼39K to ∼15K.
The critical current density anisotropyJab
C/JCc ∼ 1.5
was also evaluated[12], using the Bean’s model with data taken in the same sample of aligned crystallites[6] that pro-duced γ ≈ 1.7. The similarity between these anisotropy values is indeed expected for clean samples with relatively low pinning interactions, since in this case JC is
propor-tional to[13]ξ2
, whereξis the anisotropic coherence length. Therefore,Jab
C /JCc ≈ξab/ξc ≈Hcab2/Hcc2. Direct
determi-nation ofJab
C /JCc, using transport current measurements,
produced values around 2.5 for c-axis-oriented thin films [14], although in this case they did not measureγ.
By now, a two-band Fermi surface has been clearly demonstrated[15, 16] forM gB2: a π−band generated by
the boronpzorbitals, oriented perpendicularly to the layers,
and aσ−band generated by thepxyorbitals, confined in the
boron layers. Several novel effects have been related to this unique case of genuine two-gap superconductivity, as for ex-ample, the temperature dependence of theHc2 anisotropy
ratio. Intraband and interband scaterring effects has been shown to play important roles in determining some of these new effects[17]. Following, we present a brief review on the anisotropy studies ofM gB2done by our group at Unicamp,
and comment on some related results reported by other peo-ple.
2
Aligned Crystallites
Our studies were done using samples formed by a collec-tion of aligned crystallites. A weakly sintered sample of
M gB2was prepared, starting with a stoichiometric mixture
of 99.5 at% pure boron and 99.8 at% pure magnesium. The loose mixture was sealed in a Ta tube under Ar atmosphere, which was then encapsulated in a quartz ampoule and put into the furnace. The compound formation was processed by initially holding the furnace temperature at 1200◦C for 1 hour, followed by a decrease to 700◦C (10◦C/h), then to 600◦C (2◦C/h), and finally to room temperature at a rate of 100◦C/h. The weakly sintered product was easily crushed and milled employing mortar and pestle. A very uniform powder was then obtained, consisting mainly of shiny crys-tallites with aspect ratios ranging from 2 to 5, the main sur-face size ranging from 5 to 40µm and thickness around 2
710 O. F. de Lima and C. A. Cardoso
between 5 - 20µm, in which the crystallites fraction was al-most 100%. Small amounts of this powder were then spread carefully on both sides of a piece of paper, producing an almost perfect alignment of the crystallites, as revealed[6] by SEM pictures and X-ray analysis. Finally, several sam-ples were mounted consisting of a pile of five squares of 3×3mm2
, cut from thecrystallite-painted paperand glued with Araldite resin. These samples produced enough signal for the measurement of magnetization and AC susceptibility, using, respectively, a SQUID and PPMS machines (made by Quantum Design).
3
Upper Critical Field Anisotropy
Figure 1 shows our data (crossed circles) for the tempera-ture dependent ratioγ = Hab
c2/Hcc2, with other
represen-tative results taken from the literature, for M gB2 single
crystals[11, 10] and thin films[18]. Our data shows consis-tently smaller values forγ ∼ 1.6 -1.9 in the probed tem-perature interval of 32 K - 26 K, while the other results are scattered between ∼ 2 and∼ 4. We ascribe these differ-ences mainly to the different sample purities as well as to the different criteria employed to define the relevant transi-tion between the normal and superconducting states. Our re-sults may also contain a small contribution to the depressed values ofγin consequence of the average misalignment of 4.6 degrees between the crystallitesc-axis[7].
15 20 25 30 35
0 1 2 3 4 5 6
ab c
20 2224 2628 303234 3638 40 0
10 20 30 40 50
Tc = 39.2 K
MgB2 crystallites
Hc2
[kO
e]
T [K] H // c H // ab
c
ab
H c2
/ H
c2
T [K]
Figure 1. Anisotropy ratio of the upper critical field inM gB2as
a function of temperature for aligned crystallites (crossed circles), textured thin films of different purities[18] (hatched ellipse), sin-gle crystal using resistivity measurements[11] (dash-dotted line), single crystal using torque magnetometry[10] (dashed line). The
inset shows the originalHc2 data from Ref.[6]. Note: The data
quoted from other authors are only approximately represented in this figure.
Using the Ginzburg-Landau mean field expression[19] (in CGS units) ξ(T) = ξo(1−T /Tc)−1/2 and the results
for anisotropic situations[20, 13]Hc
c2(T) =φo/(2π ξ2ab)and
Hab
c2/Hcc2 = 1/ε, whereφo = 2.07×10− 7
G cm2
is the quantum of flux andε2
=mab/mcis the mass anisotropy
ratio, we find thatξo,ab/ξo,c = ξab(T)/ξc(T) =γ ≃ 1.73
and ε2
≃ 0.3, for T ≈ 27 K. Since at that temperature we haveHc
c2 ≈ 20kOe, this would imply ξo,ab ≃ 70 A˚
andξo,c ≃ 40A. However, these values may be underes-˚
timated, in view of recent experiments[21] and theoretical calculations[22] based on the almost independent two-gap structure, originated by the two separateπandσbands.
4
Critical Current Density Anisotropy
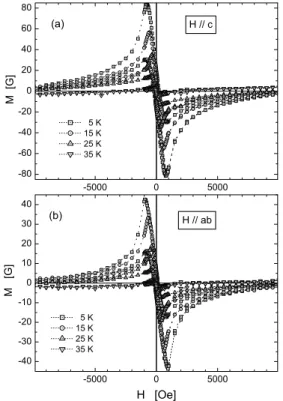
Measurements of the magnetic moment as a function of the applied magnetic field, for several temperatures belowTc=
39 K, were performed with a SQUID magnetometer. The average crystallites dimensions were 10×10×2 µm3
, de-termined by visual inspection, using an optical microscope with a micrometer scale. An estimate of the total volume of crystallites in the sample gives 0.06 mm3
, in total agreement with a value that produces a slope∆M/∆H =−1/4πfor the region of diamagnetic shielding atH ≈0. In order to subtract the magnetic background present in all curves[6], the same type of measurements were repeated at tempera-tures aboveTc(not shown here). No significant temperature
dependence was observed for the hysteresis loops measured at several temperatures from 45 K to 80 K, in the low field region. Thus, the loop obtained atT =45 K was considered to be a good approximation for the magnetic background, in the entire temperature range going from 5 K to 35 K. The fully corrected magnetization curves are presented in Fig. 2, for (a) H // cand (b) H // ab. The remanent mag-netization values, in both field directions, are shown in the enlarged plot of Fig. 3. To avoid complications associated with demagnetizing effects we treat only the case ofH =0. The critical current density can be estimated from the corrected magnetization curves of Figure 2, if one assumes the occurrence of uniform gradients in the flux density dis-tribution inside the crystallites. According to the Bean’s crit-ical state model[23],JC is proportional to the width of the
hysteresis loop and for a slab geometry it is
JC=
40|∆M|
t(1−t/3w) (1)
wheret < w are the sample dimensions perpendicular to the applied field and|∆M|is the magnetization loop width. Notice that the sample used in this work is formed by a col-lection of isolated crystallites, sotandwappearing in Equa-tion (1) refer to the crystallites average dimensions.
The ratioJab
C/JCc was determined by evaluating|∆M|
atH =0, followed by the use of Equation (1) to both field orientations. Fig. 4 shows thatJab
C/JCc = 1.5±0.1,
be-tween 5 K - 30 K and drops suddenly at T =35 K. The large error bars shown in Fig. 4 reflect essentially the uncer-tainty in the crystallites sizes, taken to bea=b = 10±4 µm andc= 2±1µm. Based on this evaluation it is safe to conclude that we found an anisotropy ratio of the same order of theHc2anisotropy, measured in the same sample[6]. A
Brazilian Journal of Physics, vol. 33, no. 4, December, 2003 711
-5000 0 5000 -40
-30 -20 -10 0 10 20 30 40
-5000 0 5000 -80
-60 -40 -20 0 20 40 60 80
(b) H // ab
M [G]
H [Oe]
5 K 15 K 25 K 35 K (a)
5 K 15 K 25 K 35 K
H // c
M [G]
Figure 2. Magnetization loops for applied fieldsH(a)
perpendic-ular and (b) parallel to the crystallites planes, after subtracting the
magnetic background measured atT= 45 K (see text).
-60 -40 -20 0 20 40 60 -10
-5 0 5 10
-60 -40 -20 0 20 40 60 -20
-10 0 10 20
H // ab (b)
H [Oe]
M [G]
H // c (a)
M [G]
Figure 3. Enlarged view of the magnetization loops shown in Fig.
2, for fields nearH= 0. This plot allowed us to extract the
rema-nent magnetization and∆Mvalues for each temperature.
5 10 15 20 25 30 35
1,2 1,3 1,4 1,5 1,6 1,7
H = 0
J
Cab
/
J
Cc
T [K]
Figure 4. Critical current density anisotropy, given by the ratio between the in-plane and out of plane values, calculated from the
remanent magnetization atH= 0 and using the Bean model.
on larger single crystals, or well textured samples, would be highly desirable. In this case, we would expect also a large scattering of values from different works. Perhaps, these dif-ferences will be even larger than the ones reported[8, 9] for
Hab
c2/Hcc2, since the critical current density is a very
com-plex variable that depends also on pinning of vortices and, hence, should depend more strongly on sample quality.
Transport current measurements of the critical current density anisotropy has also been done in thin films[14], where values ranging between 2.17 and 2.88 were obtained. However, in this work they have not measuredγandJab
C/JCc
in the same sample. We feel that more measurements involv-ing these two anisotropy ratios in the same sample would be desirable.
5
Conclusion
We presented here a brief review of the studies done by our group at Unicamp, on the anisotropic properties ofM gB2.
We have employed samples of well aligned crystallites that fournishedγ = Hab
c2/Hcc2 = 1.6 - 1.9, for temperatures
varying between 32 K - 26 K. The critical current den-sity anisotropy was found to beJab
C/JCc = 1.5±0.1,
be-tween 5 K - 30 K. The similarity bebe-tween these values ofγ
andJab
C/JCc is an indication of the crystallites high purity
level and low density of pinning centers. Although these anisotropy values are relatively small, compared with the values found in the cuprate superconductors[13], it is clear that some texturization technique will be required in order to produce wires and cables ofM gB2optimized for
appli-cations.
712 O. F. de Lima and C. A. Cardoso
References
[1] V. Russel, R. Hirst, F. A. Kanda, and A. J. King, Acta
Crys-tallogr.6,870 (1953).
[2] M. E. Jones and R. E. Marsh, J. Am. Chem. Soc.76,1434
(1954).
[3] J. Nagamatsu, N. Nakagawa, T. Muranaka, Y. Zenitani, and
J. Akimitsu, Nature410, 63 (2001).
[4] Y. Wang, T. Plackowski, and A. Junod, Physica C355, 179
(2001).
[5] J. Kortus, I. I. Mazin, K. D. Belashchenko, V. P. Antropov,
and L. L. Boyer, Phys. Rev. Lett.86, 4656 (2001).
[6] O. F. de Lima, R. A. Ribeiro, M. A. Avila, C. A. Cardoso,
and A. A. Coelho, Phys. Rev. Lett.86, 5974 (2001).
[7] O. F. de Lima, C. A. Cardoso, R. A. Ribeiro, M. A. Avila,
and A. A. Coelho, Phys. Rev. B64, 144502 (2001)
[8] C. Buzea, and T. Yamashita, Supercond. Sci. Technol.14,
R115 (2001).
[9] M. Angst, and R. Puzniak, cond-mat/0305048v2 at
<http://arxiv.org/>(2003).
[10] M. Angst, R. Puzniak, A. Wisniewski, J. Jun, S. M.
Kaza-kov, J. Karpinski, J. Roos, and H. Keller, Phys. Rev. Lett.88,
167004 (2002).
[11] Yu. Eltsev, S. Lee, K. Nakao, N. Chikumoto, S. Tajima,
N. Koshizuka, and M. Murakami, Phys. Rev. B65, 140501
(2002).
[12] O. F. de Lima, and C. A. Cardoso, Physica C386, 575 (2003).
[13] G. Blatter, M. V. Feigel’man, V. B. Geshkenbein, A. I. Larkin,
and V. M. Vinokur, Rev. Mod. Phys.66, 1125 (1994).
[14] S. Sen, A. Singh, D. K. Aswal, S. K. Gupta, J. V. Yakhmi, V. C. Sanhi, E.-Mi Choi, H.-Jin Kim, K. H. P. Kim, H. -Sook
Lee, W. N. Kang, and S. -Ik Lee, Phys. Rev. B65, 214521
(2002).
[15] H. J. Choi, D. Roundy, H. Sun, M. L. Cohen, and S. G. Louie,
Nature418, 758 (2002).
[16] S. Tsuda, T. Yokoya, Y. Takano, H. Kito, A. Matsushita, F.
Yin, J. Itoh, H. Harima, and S. Shin, Phys. Rev. Lett. 91,
127001 (2003).
[17] A. Gurevich, Phys. Rev. B67, 184515 (2003). See also a
paper by A. Gurevich in this Special Volume of the Braz. J.
Phys (U-Super Proceedings).
[18] S. Patnaik, L. D. Cooley, A. Gurevich, A. A. Polyanskii, J. Jiang, X. Y. Cai, A. A. Squitieri, M. T. Naus, M. K. Lee, J. H. Choi, L. Belenky, S. D. Bu, J. Letteri, X. Song, D. G. Schlom, S. E. Babcock, C. B. Eom, E. E. Hellstrom, and D.
C. Larbalestier, Supercond. Sci. Technol.14, 315 (2001).
[19] M. Tinkham, Introduction to Superconductivity, 2nd ed.
(McGraw-Hill, New York, 1996).
[20] L. N. Bulaevskii, V. L. Ginzburg, and A. A. Sobyanin, Zh.
Eksp. Teor. Fiz.94, 355 (1988) [Sov. Phys. JETP68, 1499
(1988)].
[21] M. R. Eskildsen, M. Kugler, S. Tanaka, J. Jun, S. M.
Kaza-kov, J. Karpinski, and F. Fischer, Phys. Rev. Lett.89, 187003
(2002).
[22] A. E. Koshelev, and A. A. Golubov, Phys. Rev. Lett. 90,
177002 (2003).
![Figure 1 shows our data (crossed circles) for the tempera- tempera-ture dependent ratio γ = H c ab2 /H c c 2 , with other represen-tative results taken from the literature, for M gB 2 single crystals[11, 10] and thin films[18]](https://thumb-eu.123doks.com/thumbv2/123dok_br/18979774.456605/2.892.101.449.611.873/figure-crossed-circles-tempera-dependent-represen-literature-crystals.webp)