Abstract
The present article is devoted to the development of a hematite-poor ore mine in Ouenza, which does not meet the steelmaker’s requirements. Signiicant volumes are stored at the pithead of the mine, and the reserves are estimated at over 100 million tones. This enormous quantity of mining waste occupies an important space and poses a real threat to the environment as well as for the mining city of Ouenza. In order to solve these socio-economic and environmental problems, a sustainable development and a better quality of life for inhabitants of this region is needed. For this, representa-tive samples were taken at the level of the dumps. Taking into account the natural char-acteristics of the stock namely; mineralogical composition, iron content, particle size of the rock mass, as well as the release mesh of iron minerals from the gangue. Firstly, tests are conducted on the recovery by radiometric separation of iron-rich pieces and graded. Then the rest of the ore was subjected to mechanical preparation followed by enrichment, which will be the subject of another study. The research is conducted on samples to determine the optimal parameters of the γ-rays absorption tested by radiometry; these parameters were the velocity of the conveyor belt and the time of ex-posure to γ-rays. The obtained results by this valorization process are very signiicant: iron content 53.5% and 8.3% recovery.
Keywords: linear absorption coeficient, Ouenza iron ore, radiometric method, γ-rays. Abdelaziz Idres
Professor
Badji Mokhtar University
Mining Department - Laboratory of Mining Resources Valorization and Environment Annaba-Algeria
Chiraz Abdelmalek Dr.
El Manar University
Laboratory of Mineral Resources and Environment Tunis -Tunisia
Ahcène Bouhedja Dr.
Badji-Mokhtar University
Laboratory of Physical Metallurgy and Materials Properties
Annaba - Algeria [email protected]
Aissa Benselhoub PhD
State Agrarian and Economic University Department of Ecology and Environment Protection Dnipropetrovsk - Ukraine
Mohamed Bounouala Professor
Badji Mokhtar University
Mining Department-Laboratory of Mining Resources Valorization and Environment Annaba - Algeria
Valorization of mining
waste from Ouenza iron
ore mine (eastern Algeria)
Mining
Mineração
http://dx.doi.org/10.1590/0370-44672016700051
1. Introduction
The mine of Ouenza is located in the east of the country (see Figure 1), which is the main sourcing pole of iron ore for the Algerian steelmaking .The mine has suffered a decline in
produc-tion of 2 million tons per year as a result of the quality mismanagement of the exploited raw materials. For this purpose, the rest of the extracted quantity represents low-grade ores
REM: Int. Eng. J., Ouro Preto, 70(1), 85-92, jan. mar. | 2017 86
Figure 1
Ouenza Iron Mine.
a) View of the opencast mine, b) Mining Waste
2. Materials and methods
This study relates to an oxidized iron ore concentration technology by radiometry - the case of Ouenza iron mine. This concentration process is based on the difference between the ra-diometric properties of mineral compo-nents, that is to say, their ability to emit, to relect, and to absorb corpuscular
radiation and ondulaires (Mokrousov and Lileyev, 1979).The linear absorption coeficient depends on the density of the medium, the mineralogical composition
and the wavelength γ passing through
a path unit. The samples taken from iron ore and waste rock have different mineralogical compositions, so they
have different linear weakening coef-icients.The study of the mineralogical composition of samples of iron ore and waste rock is performed by metallo-graphic microscopy on polished sections (Table 1).Chemical analysis by XRF (Table 2) show the poor grade of the mine iron ore (Idres and Bounouala, 2005).
Minerals
Content, %
H G H G SA D C Q A M A Others
Hematite 12.18 40.29 29.17 8.07 1.56 4.12 2.41 0.08 0.12 2.00
Goethite-
Hydrogoe-thite 3.09 19.38 50.17 7.79 3.35 5.13 9.05 0.12 1.05 1.57
Limestones 0.17 0.28 0.97 - - 94.37 1.30 - - 0.73
Sandstone - 0.39 0.27 - - 3.29 94.92 - - 0.32
Minerals
Content, %
Fetot SiO2 Al2O3 CaO MgO MnO Mn K2O Na2O P2O5 S CO2 PAF
Hematite 54.00 2.40 0.22 6.83 1.67 0.94 0.70 0.03 0.02 0.03 0.035 6.60 10.70
Goethite-Hydrogoethite 41.70 22.50 0.30 13.35 1.06 1.85 1.43 0.03 0.19 0.06 0.02 6.20 18.10
Limestones 0.90 2.00 0.16 52.85 0.55 0.08 0.07 0.02 0.06 0.01 0022 42.40 42.50
Sandstone 0.06 94.5 0.31 1.38 0.10 0.03 0.001 0.02 - - - 1.86 1.93
Table 1
Mineral composition of mining waste rock flancs of Ouenza mine.
H - Hematite, G - Goethite, HG - Hydrogeothite, SA - siderite-ankerite, D - Dolomite, Calcite C-, Q - Quartz, A - Apatite, MA - Clay minerals
(a) (b)
Table 2
Chemical analysis of
mining waste of Ouenza mine.
2.1 Investigation of the influence of sample thickness on the absorption intensity of
γ
- rays
The inluence of the thickness of thecalibrated ore on the degree of γ-rays ab-sorption, as well as that of the iron content of a calibrated sample, on the absorption intensity of γ-rays are performed at an installation laboratory (see Figure 2).
Once the devices are connected, we carry out measurements in a natural background (If) scintillation sensor (3), and then we record an initial intensity (I0) of the γ-rays source (1) using a calculating device hotix PC-20 (7).
Each operation is repeated three times, provided that the measurement time is greater than or equal to 10 sec-onds. Otherwise, the pulse recording accuracy decreases.
stabilize the duration of the time interval during the measurements of the above parameters, we introduce timing relay (8) into the system illustrated in Figure 2.
The studied sample (2) is placed under the sights of the source of γ-rays. The latter, once they pass through the sample, are recorded by the scintilla-tion counter (3). They are transformed
into light signals, multiply and pass to the input of the radiometer (4). In the last, a signal forms according to the frequency; in other words, it depends on the intensity of γ-rays under the pulses per time unit (8), which excludes the measurement errors.
As a source of γ-rays (1), we use 153 Gadolinium, Thulium the 170,
Americium 241, Cesium-137, and as an indicator of γ-rays, we use crystal thickness NAJ activated by Thallium. A radiometer of the components is in-tegrated RC-circuit.
The measurement of γ-rays is
based on the potential created by the charge of counting pulses in the inte-grated circuit (Azaryan, 2015).
Figure 2 Installation for measuring absorption of γ-rays.
2.2 Measuring the intensity of
γ
-rays on the sample thickness
In the present study, the thickness ofthe sample analyzed is determined from the average of ive (5) tests conducted. According to several researches (Medhat, 2012; Medhat, 2012; Kucuk et al., 2013),
it was shown that the iron content, the mineralogical composition and the sample thickness directly affects the degree of absorption of γ-rays.
For more information on the
inlu-ence of different factors cited above, labo-ratory tests were conducted on samples of varying size, and the absorption intensity was studied using various energy sources ie Gadolinium 153 and Americium 241.
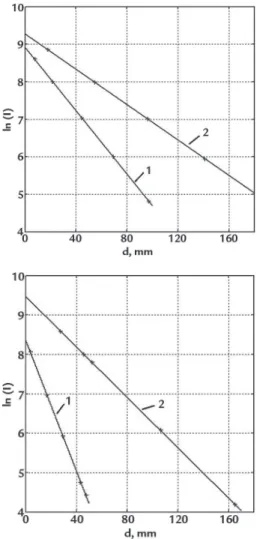
Figure 3 Influence of the intensity of γ-rays on the sample thickness.
(Gamma source: Gadolinium 153) 1.Hematite, 2. Gangue
Figure 4 Influence of the intensity of γ-rays on the sample thickness
REM: Int. Eng. J., Ouro Preto, 70(1), 85-92, jan. mar. | 2017 88
From the results obtained and shown in Figures 3 and 4, we note that the ray absorption intensity γ with a source of Gadolinium 153 and a vari-able thickness of the sample shows
that with thickness equal to 80 mm, hematite minerals absorb
approxi-mately twice as many γ-rays as the
gangue and the separation eficiency is signiicantly between 5.5 and 7.5. On
the other hand, expected outcomes with Americium 241 demonstrate that the optimal size is reached at about 40 mm when I varies between 5 and 8.
2.3 Analysis of the effect of the absorption degree of
γ
-rays on the nature of the minerals
The absorption of γ-rays bydiffer-ent minerals is mainly characterized by the coeficients, such as linear, atomic and electronic.
The total absorption coeficient is most appropriate for the calculation of physical parameters. It is deined as the ratio between the linear
ab-sorption coeficient and abab-sorption density (Medhat, 2011; Morkun and Tron, 2014).The linear absorption coeficient depends on the density of the medium, its mineralogical com-position and the quantum wavelength
γ penetrating through the path unit
(Baştuğet al., 2010).
The tested samples of different mineralogical composition are char-acterized by their difference of linear
absorption coeficients (Manohara et
al., 2010).
The intensity of the beam of
γ-rays passing through a sample is
determined by:
I
1= I
0. e
- μ1I0 : primary radiation intensity;
I1, I2: intensity of radiation passing
through the sample;
d1, d2: thickness pieces of the sample;
μ1, μ2: linear coeficient of absorp-tion of γ-rays.
The γ-rays are easily absorbed
by the mineral substance and can penetrate through solid bodies with a thickness of several centimeters. It is evident that the dependence of the to-tal coeficient of γ-rays and the miner-alogical composition is observed under
the photoelectric effect. (Özdemir and Kurudirek, 2009).
The energy of γ-rays makes it
possible to quantify the mineralogical composition of the sample provided
that the value of E ≤ 300 keV. For
this purpose, we propose for mine iron waste a range of energy
varia-tion E = 50 ÷ 200 keV which ensures
the photoelectric absorption and
Compton scattering (Kopanev et al.,
2007; Kurudirek, 2011; Morkun and Tron, 2014).
Furthermore, the obtained re-sults for the linear coeficient of γ-ray absorption depending on the iron content for samples of size 80 mm are presented in Figure 5.
Notice that the γ value is closely related to the mineralogical and chem-ical nature of the studied sample: the more the sample is rich in iron content,
the γ value increases but the energy
absorption decreases. To the contrary, it consumes more energy absorption of γ-rays if the sample is low in iron.
I
2= I
0. e
- μ2. d2(1)
(2)
Figure 5
Influence of the linear
coefficient γ on the iron content.
2.4 Study of minerals selectivity by means of adsorption of
γ
-rays
The ore separation curves makethe option of a technological processing system possible, and facilitate the analysis and interpretation of results of the γ ab-sorption process.
Knowing the size and composition from the itness curves, possible theoreti-cal values of treatment are determined (see Figure 6) based on:
- Φ curve to calculate the yield and
reject content
- The curve λ, the elementary fraction, - The curve β, the yield and the iron content in the concentrate,
- The curve μn, the separator accuracy. To characterize the ability of the iron ore separation, we tested samples of size 50 ÷ 100 mm with an iron content of 37.8%.According to the obtained results, radiometric separation of iron ore is
rec-ommended. The iron recovery λ curve
shows that the results obtained are highly significant (concentrate, intermediate product and rejects).
Figure 6 Effect of γ-rays on the calibrated ore (50 ÷ 100 mm).Furthermore, enrichment tests by radiometric separator with conical spreader are realized on the basis of the linear absorption coefficient variation of γ-rays (µn= 1.0 cm-1 and µ
n = 0.7 cm -1).
As radiation source, we used the isotope Gadolinium 153 with an activity
of 100 mCi. This one is recommended in scientiic works already published
(Chan-turiya, 1993; Chan(Chan-turiya, 1999; Morkun
et al., 2014).
Figure 7 Scheme of radiometric separator with conical spreader.
2.5 Experimental section
This research work aims at studying the velocity effect of tape movement vary-ing from 0.25 to 0.5 m / s and the exposure times of pieces ranging from 0.14 to 0.24 second. The achieved results of separation of the particle size fraction - 100 + 50 mm are shown in Figs 8 and 9 (for the irst process radiometric) and in Figures 10 and
11 (for the second puriication process). When we vary the speed of the conveyor belt and the value μn = 1.0 cm-1
is reached, an iron content of 53.0% is achieved against a recovery of 11% with optimal speed of 0.4 m/s (Figure 8 ).
When we vary the exposure time for pieces μn = 1.0 cm-1(constant), we attained
an iron content of 53.5% against a recov-ery of 14.5% with an optimal exposure time of 0.2 second (Figure 9) .
By analogy to the second process radiometric for μn = 0.7 cm-1, an iron
content of 44.2% is reached against a recovery of 94% with optimal speed of 0.4 m / s (Figure 10).
REM: Int. Eng. J., Ouro Preto, 70(1), 85-92, jan. mar. | 2017 90
Figure 9
Effect of radioscopy time
on the material balance for µn = 1.0 cm-1.
Figure 10
Effect of velocity of conveyor belt on the material balance for µn = 0.7 cm-1.
Figure 11
Effect of radioscopy time
on the material balance for µn = 0.7 cm-1.
3. Results and discussion
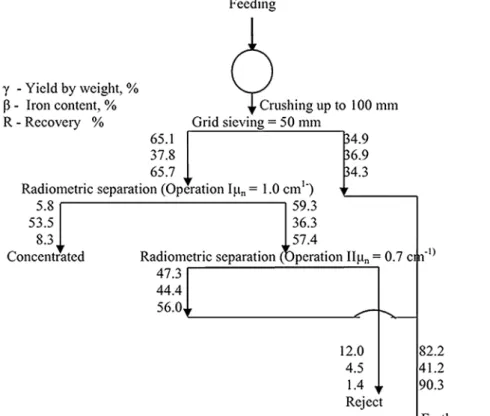
Corresponding to the research conducted in laboratory for a size fraction - 100 mm + 50 mm, the results obtained by radiometric sepa-ration are very encouraging. For this purpose, we suggest the flowsheet given in Figure 12.
However, after the irst radio-metric separation operation, we obtain a calibrated concentrate with a yield of 5.8% and an iron content of 53.5%. In the second operation, we obtain 12% of schist with an iron content of 41.2%.
In order to achieve the objectives referred in terms of radiometric sepa-ration eficiency, the irst sepasepa-ration shall be set for μn= 1.0 cm-1 and the second operation for 0.7 cm -1.
It results that the best separation system (irst operation) for obtaining the concentrate with an iron content of 53.5% can be achieved with the following parameters: the limit value of linear weakening coefficient of
γ-rays, μn= 1.0 cm-1, the belt speed
V = 0.4 m / s and the exposure time t = 0.20 second.
In this regard, in the second step of the radiometric separation, the material balance is notable in con-tent and recovery when μn = 1.0 cm-1,
Figure 12 Schematic of radiometric
separation proposed for mining waste from Ouenza mine.
4. Conclusions
According to the study carried out on the characterization and the possibility of radiometric separation of mining waste, the obtained results allowed us to draw the following conclusions:
- The particle size of the studied samples is between 50 and 100 mm to have calibrated pieces and facilitate the radiometric separation;
- A study of macroscopic size pieces allowed us to classify fractions into four mineralogical classes namely: hematite, goethite-hydrogoethite, lime-stone and sandlime-stone;
- Chemical analysis of the different
particle size fractions revealed that the iron content in hematite 54% against 41.70% in the fraction of the Goethite-hydrogoethite;
- Before proceeding to the samples separation, we used as a radiation source the isotope Gadolinium 153 and Ameri-cium 241;
- In the sample having a thickness of 80 mm, the hematite minerals absorbed approximately twice amount of γ-rays as the gangue did and the separation efi-ciency is signiicant for ionizing intensities varying between 5.5 and 7.5;
- Samples submitted to main
radio-metric separation (1st operation) reveal very signiicant results for recovery, and iron contents are 54% and 8% respectively (case of minerals rich in hematite);
- Rejects from the main separation, in turn undergo enrichment, where the obtained titrate concentrates have a con-tent of 44% Fe with a recovery of 56%;
Finally, the concentrate from the inal operation of radiometric separation, and after passing it through a sieve for a particle size of less than 50 mm, will be subjected to a characterization study for the selection of a separation process and enrichment.
Acknowledgments
The work presented in this ar-ticle falls within the framework of a research project led by the Labora-tory of Valorization of Mining
Re-sources and Environment, Mining Department, Badji Mokhtar Uni-versity, Annaba, Algeria. The entire research team thanks the Director,
engineers and all staff of Ouenza iron mine (Algeria) for their help and contribution to carry out this research project.
References
AZARYAN, A. Research of inluence of monocrystal thickness NAJ (TL) on the in-tensity of the integrated lux of scattered gamma radiation.Metallurgical and Mi-ning Industry, n.2, p. 43- 46, 2015.
BAŞTUĞ, A., GÜROL, A., İÇELLI, O., ŞAHIN, Y. Effective atomic numbers of some
composite mixtures including borax. In: NUCLEAR ENERGY. Annals..., v.37,
n.7, p. 927-933, 2010.
REM: Int. Eng. J., Ouro Preto, 70(1), 85-92, jan. mar. | 2017 92
Received: 7 April 2016 - Accepted: 12 September 2016.
MATERIAL, Izd. MGGU, Moscow: 1993. [in Russian].
CHANTURIYA, V. A. Contemporary problems of mineral raw material beneiciation in Russia. Journal of Mining Science, v.35, n.3, p. 314-328, 1999.
Idres, A., & Bounouala, M. Possibilité d'une nouvelle technologie de traitement des minerais de fer de l'Ouenza par radiométrie. Journal de Physique IV. Proceedin-gs..., v.124, p. 177-181, 2005. (EDP Sciences.
KOPANEV A. V., NOVIKOV V. I., SOLOVIY A. V. Radiometric equipment for control of technological processes of technogenic uranium deposit geomaterials treatment. Institute of geotechnical mechanics of the National Academy of Science of Ukraine. Dnepropetrovsk, n°. 73, p. 281–289, 2007.
KUCUK, N., TUMSAVAS, Z., CAKIR, M. Determining photon energy absorption parameters for different soil samples. Journal of Radiation Research, 54, p. 578-586, 2013.
KURUDIREK, M. Estimation of effective atomic numbers of some solutions for pho-ton energy absorption in the energy region 0.2–1.5 MeV: an alternative method.
Nuclear Instruments and Methods in Physics Research Section A: Accelerators,
Spectrometers, Detectors and Associated Equipment, v.659, n.1, p. 302-306,
2011.
MANOHARA, S. R., HANAGODIMATH, S. M., THIND, K. S., GERWARD, L. The effective atomic number revisited in the light of modern photon-interaction cross-section databases. Applied Radiation and Isotopes, v.68, n.4, p. 784-787, 2010.
MEDHAT, M. E. Studies on effective atomic numbers and electron densities in diffe-rent solid state track detectors in the energy range 1keV–100GeV. In: NUCLEAR ENERGY. Annals... v.38, n.6, p. 1252-1263, 2011.
MEDHAT, M. E. Gamma absorption technique in elemental analysis of composite
materials. In: NUCLEAR ENERGY. Annals... n.47, p. 204-209, 2012.
MEDHAT, M. Application of gamma-ray transmission method for study the pro-perties of cultivated soil. In: NUCLEAR ENERGY. Annals... v.40, n.1, p. 53-59, 2012.
MOKROUSOV, V.A., LILEYEV, V. A. Radiometric beneiciation of
non-radioacti-ve ores. Nauka, Moscow: 1979. 192p. [in Russian].
MORKUN, V., TRON, V. Automation of iron ore raw materials beneiciation with the operational recognition of its varieties in process streams. Metallurgical and Mining Industry, n.6, p.4-7, 2014.
MORKUN, V., TRON, V. Ore preparation multi-criteria energy-eficient automated control with considering the ecological and economic factors. Metallurgical and Mining Industry, p. 4-7, 2014.
MORKUN, V., MORKUN, N., PIKILNYAK, A. Ultrasonic facilities for the ground materials characteristics control. Metallurgical&MiningIndustry, n.2, 2014. ÖZDEMIR, Y., KURUDIREK, M. A study of total mass attenuation coeficients,
effective atomic numbers and electron densities for various organic and inorganic
compounds at 59.54 keV. In: NUCLEAR ENERGY. Annals... v.36, n.11, p.