In flu e n ce Of P ro ce s s Co n d itio n s On Me lt B lo w n W e b S tru ctu re .
P a rt IV - Fib e r D ia m e te r
Randall R. Bresee1, Uzair A. Qureshi2
1
University of Tennessee, Department of Materials Science & Engineering, 1321 White Ave., Knoxville, Tennessee 37996-1950, 2Supply Pro, Inc., 1231 Hahlo Street, Houston, Texas 77020
Correspondence to:
Randall R. Bresee, email: [email protected]
______________________________________________________________________________
ABSTRACT
We are continuing an effort to quantitatively measure the influence of processing variables on the structure of polypropylene melt blown webs. In this paper, we report experimental
measurements of the influence of die-to-collector distance, primary airflow rate, die temperature, collector speed and resin throughput rate on the diameter of fibers in fully-formed webs. This enabled us to quantitatively compare the influence of these processing variables on fiber diameter as well as to achieve greater understanding of the melt blowing process.
INTRODUCTION
During melt blowing (MB), the diameters of fibers close to the die change extremely rapidly. Further from the die, diameters change at a smaller rate but continue to change until fiber laydown is completed. Since fiber velocity, acceleration and temperature change substantially through the region where diameter attenuation occurs, it is likely that more than one mechanism contributes to fiber diameter development during MB. It is believed that fiber diameter may be reduced during MB two different ways – by aerodynamic drag and by fiber contact/entanglement [1]. Fiber diameters also may increase during MB by at least two mechanisms – fiber
contact/fusion and fiber shrinkage. We will briefly discuss these four contributions to fiber diameter development and then evaluate experimental measurements in terms of the four mechanisms.
Diameter Reduction by Aerodynamic Drag
Experimental measurements suggest that fiber diameter attenuation near the die is fairly uniform. These experiments show that the fiber array structure is relatively simple, fiber density per unit volume of space is fairly uniform, fibers are oriented fairly uniformly in the machine direction (MD), limited fiber entanglement occurs, fiber velocity is fairly uniform, and fiber acceleration is fairly uniform [1,2]. It is likely that diameter attenuation produced in this manner results in fairly narrow fiber diameter distributions.
Diameter Reduction by Fiber Contact/Entanglement
Since air and fiber velocities in the MD become nearly equal only a few cm from the die, but diameter attenuation continues to occur until laydown on the collector is completed, an elongational force different than normal aerodynamic drag must exist far from the die.
Fiber contact and entanglement distinguishes the MB process from the conventional melt
spinning process. It is reasonable to expect that contacts between fibers change their velocity and acceleration and thus could produce elongational forces that contribute to diameter attenuation during MB. That is, a fiber collision could accelerate one fiber segment and cause elongation to occur if the segment is constrained by entanglements and is hot enough to be deformable.
Previous work showed that the likelihood of fiber contact and entanglement during MB generally increased as fibers travel farther from the die [1]. Experimental measurements of fiber
temperature and molecular orientation [3], as well as the common observation of fiber fusion in fully-formed webs, indicate that fiber temperatures remain hot until after laydown on the collector. These considerations lead us to expect that conditions during MB are conducive to fiber diameter attenuation as a result of fiber contact/entanglement.
Experimental measurements also suggest that fiber diameter attenuation far from the die does not occur uniformly. These experiments show that the fiber array structure is complex, fiber density per unit volume of space is large and varies substantially through time and space, fiber
orientation varies substantially through time and space, fiber entanglement is complex, fiber velocity varies substantially through time and space, and fiber acceleration varies substantially through time and space [1,2]. Overall, it seems likely that fiber contact and entanglement result in diameter attenuation far from the die and probably produce broad fiber diameter distributions.
Diameter Increase by Fiber Contact/Fusion
Contact between two or more fibers could result in fusion of polymer if fiber temperatures are high enough. The fact that fibers in MB webs are said to be “self bonded” indicates that fibers are hot enough after laydown for fusion to occur readily on the collector. Experimental
Figure 1. Diameter increase by fiber contact/fusion; image size is 366 μm x 404 μm.
It is well known that fiber diameters vary substantially in MB webs. Fiber temperature
considerations led previous researchers to conclude that fine fibers are cooler than coarse fibers during MB [3]. This expectation was supported by experimental measurements of molecular orientation development (optical birefringence) in fibers during MB. Consequently, temperature considerations led us to expect that coarse fibers are more likely to fuse than fine fibers and fiber fusion probably results in broader fiber diameter distributions.
Diameter Increase by Fiber Shrinkage
Fiber shrinkage would be expected when molecular orientation has occurred, crystallization has not occurred and molecular relaxation time is short (fibers are hot). Experimental measurements show that polypropylene fibers do not crystallize during MB until after laydown occurred. This suggests that fiber shrinkage could occur while fibers are traveling toward the collector or after laydown has occurred. The authors have sometimes observed web shrinkage on the collector during MB immediately after laydown and before crystallization occurs.
Fiber shrinkage would be expected to increase fiber diameters. Since coarse fibers are hotter than fine fibers during MB, fiber shrinkage would be expected to result in broader fiber diameter distributions if coarse fibers shrink more than fine fibers.
METHODS
Melt blown webs were prepared using two different MB lines and a variety of processing conditions. These two lines differed considerably and the structure of webs produced from them differed considerably. Consequently, the experimental results reported in this paper represent a large range of MB equipment and processing conditions.
die temperature at each temperature. Webs were collected on a rotating drum collector with five die-to-collector distances (DCD’s) that varied from 22.9 to 81.3 cm (9-32 inch). Resin
throughput rates of 0.4 and 1.0 ghm were used. Two collector speeds were used, which produced web basis weights of 12 and 22 g/m2.
We also prepared 30 webs using ExxonMobil 3505GE1 polypropylene (400 melt flow rate) and a 115 cm (44 inch) wide commercial line located at Supply Pro, Incorporated. This line was equipped with a single coat-hanger 60o die manufactured by Accurate Products/Accuweb Meltblown Systems which had 1,541 holes of 305 μm (0.012 inch) diameter and an 10:1 LID spaced at 14 hole/cm (35 hole/inch). We varied primary airflow rate from 370 to 700 ft3/min by varying primary air pressure. Webs were collected on a rotating drum collector using DCD’s of 22 to 40 cm (8.5-15.0 inch).
Fiber diameter analysis was conducted off-line quantitatively from fully formed webs that were retrieved from the collector [4]. WebPro, an automated image analysis-based instrument, was used to measure the diameter of approximately 250 fibers in the size range of 1.5 μm to 50.0 μm across the full width of each web [5].
RESULTS
DCD
Figure 2 provides average fiber diameter data for the research and commercial MB lines. This figure shows that mean fiber diameter decreased when DCD increased. Webs were collected well beyond locations where fiber and air speeds can be expected to differ significantly. If
contributions of normal aerodynamic drag to diameter attenuation near the die are assumed to be similar for all webs, the fiber diameter differences observed in Figure 2 most likely resulted from fiber contact/entanglement.
y = -0.018x + 7.8
r2 = 0.78
y = -0.033x + 18.9
r2 = 0.92
15 16 17 18 19 20
20 30 40 50 60 70 80
DCD (cm) Me a n F ib er D ia m et er ( u m ) . 4 5 6 7 8 Mea n F ib er D ia m et er (u m )
Figure 2 also shows that fiber diameter attenuation continued to occur at very large distances from the die (e.g. 81 cm DCD). This indicates that the temperature of at least some fibers far from the die must have been hot enough for fiber deformation to occur. Our observations are consistent with previously reported experimental measurements of fiber diameter [1-3, 7] as well as experimental measurements of fiber temperature [2,3], numerous experimental measurements that showed that polypropylene did not crystallize until after laydown on the collector [3], and the common occurrence of fiber fusion after laydown has occurred.
Regression lines fitted to the data in Figure 2 show that the influence of DCD on mean fiber diameter was not large. A 10 cm change in DCD produced a mean fiber diameter change of 0.3
μm for the research line and a 0.2 μm for the commercial line. Consequently, we conclude that incidental variations in DCD that are likely to occur during MB have little practical influence on mean fiber diameter in webs.
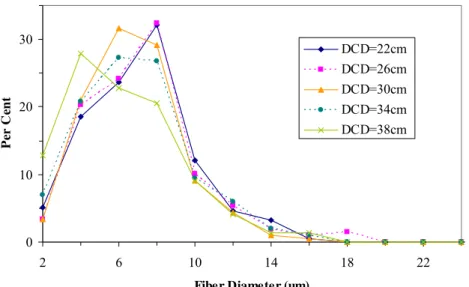
However, Figures 3-4 provide fiber diameter distributions for the MB lines. These figures show that increasing DCD increased the amount of fine fibers and reduced the amount of coarse fibers even when DCD was very large (e.g. 81 cm). Consequently, these data indicate that incidental variations in DCD could influence some properties such as web cover even though they may not change mean fiber diameter significantly.
Figure 3. Fiber diameter distributions for the research MB line.
0 10 20 30
2 6 10 14 18 22
Fiber Diameter (um)
Pe
r
C
en
t
DCD=22cm
DCD=26cm DCD=30cm DCD=34cm DCD=38cm
Figure 4. Fiber diameter distributions for the commercial MB line.
Figure 5 provides the maximum fiber diameter in the set of 250 fiber measurements acquired for each web. Regression lines fitted to the data show that linear correlation coefficients for
have been hot enough for fusion and/or shrinkage to occur, even at very large distances from the die (e.g. 81 cm).
Regression lines in Figure 5 show that the influence of DCD on maximum diameter was not insignificant. A 10 cm change in DCD produced a change in maximum fiber diameter of 1.3 μm for the research line and 2.1 μm for the commercial line.
y = 0.13x + 33.9
r2 = 0.61
y = 0.21x + 13.4
r2 = 0.38
32 37 42 47
20 30 40 50 60 70 80
DCD (cm)
Ma
x F
ib
er D
iam
et
er (
u
m
)
.
0 10 20 30
M
ax F
ib
er
D
iam
(u
m
)
Figure 5. Maximum fiber diameters for the commercial (top) and research (bottom) MB lines.
Figures 2 and 5 show that increasing DCD reduced mean diameter but increased maximum diameter. These results support the existence of more than one mechanism of fiber diameter development during MB. It seems likely that increased DCD provides more time for fiber contact/entanglement to reduce fiber diameters as well as more time for fiber contact/fusion or shrinkage to increase fiber diameters.
This conclusion also is supported by fiber diameter coefficients of variation (CV), which were computed by dividing the standard deviation for diameters by the mean diameter. Fiber diameter CV represents the broadness of fiber diameter distributions. Figure 6 shows that fiber diameters became less uniform when DCD was increased. Regression lines fitted to the data show that the influence of DCD on the broadness of fiber diameter distributions was not insignificant. A 10 cm change in DCD produced a CV change of 2.3 % for the research line and 4.0% for the
y = 0.23x + 27.0
r2 = 0.95 y = 0.40x + 27.2
r2 = 0.92
30 33 36 39 42 45
20 30 40 50 60 70 80
DCD (cm) F ib er D ia m et er C V ( % ) . 20 30 40 50 60 F ib er D ia m et er C V (% ) .
Figure 6. Fiber diameter coefficients of variation for the commercial (top) and research (bottom) MB lines.
Overall, Figures 2-6 provide evidence that several mechanisms contribute to fiber diameter development during MB. Two mechanisms seemed to contribute to diameter reduction (aerodynamic drag and fiber contact/entanglement) and one or two mechanisms seemed to contribute to fiber diameter increases (fiber contact/fusion and shrinkage). Both finer and coarser fibers were produced when DCD was increased. This was supported by data for mean diameter, maximum diameter, diameter distributions and diameter CV’s. Changes in DCD during MB affected fiber diameter even when DCD was large (81 cm). This indicates that fibers must have been hot enough for fiber deformation, fusion and relaxation to occur far from the die. Overall, we conclude that the practical influence of DCD on fiber diameter was not large, although it may be significant for some properties (e.g. web cover).
Primary Airflow
Both experimental and theoretical studies have reported that mean fiber diameter decreases when primary airflow rate increases [6-8]. Figure 7 provides experimental data for mean fiber diameter versus primary airflow rate for the commercial MB line after averaging mean values for webs produced using five different DCD’s. This figure shows that mean diameter depended on primary airflow rate in a complex way. That is, mean diameter decreased when primary airflow rate was increased for lower but not higher airflow rates. The effect at lower airflow rates is easily explained, since drag force near the die increases when primary airflow rate increases.
Figure 7 shows that this effect is notable since, at lower airflow rates, a 100 ft3/min increase in primary airflow rate produced a 1.0 μm decrease in mean fiber diameter.
higher primary airflow rates. To explain Figure 7, we must identify another factor which depends on airflow rate and influences fiber diameter development.
6.5 7.0 7.5 8.0 8.5
350 450 550 650
Primary Airflow (CFM)
M
ean
F
ib
er
D
iame
ter
(
u
m)
.
Figure 7. Mean fiber diameters for the commercial MB line.
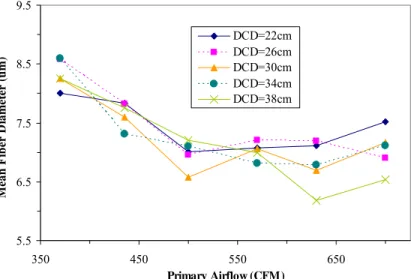
Figure 8 provides mean fiber diameter data plotted as a function of primary airflow rate for webs produced at each DCD. Although data points for each DCD series show substantial scatter, this figure indicates that mean diameter was influenced by airflow rate through a wider airflow range when DCD was larger than when DCD was smaller. When DCD was 38 cm, mean diameter decreased for four of the five airflow rate changes. When DCD was 34 cm, mean diameter decreased for three of the five airflow rate changes. When DCD was 22, 26 and 30 cm, mean diameter decreased only for two of the five airflow rate changes.
5.5 6.5 7.5 8.5 9.5
350 450 550 650
Primary Airflow (CFM)
M
ea
n
F
ib
er D
ia
m
et
er (
u
m)
.
DCD=22cm DCD=26cm DCD=30cm DCD=34cm DCD=38cm
Figure 8. Mean fiber diameters for the commercial MB line.
Figure 2 showed that diameter reduction from fiber contact/entanglement seemed to occur at all DCDs used in this study. However, mean diameter was reduced only 0.3 μm when DCD
diameter observed in Figure 8. The trend in Figure 8 indicates that collector location and primary airflow rate somehow influenced fiber diameter interactively.
One explanation for Figure 8 is that collector location influenced airflow near the die. That is, collector location could have influenced diameter attenuation near the die that resulted from normal aerodynamic drag. However, previous workers have reported that DCD did not influence fiber velocity near the die [1], fiber diameter near the die [1] and fiber vibration amplitude near the die [6]. Consequently, current knowledge does not support this explanation.
Another explanation for Figure 8 is that higher airflow rates and smaller DCD’s both reduce the time allowed for diameter attenuation. That is, a reduction in DCD could truncate the influence of primary airflow on diameter attenuation by reducing the time needed for primary airflow-related attenuation. However, it is difficult to understand how the DCD’s used in this study could significantly impact the amount of time for diameter attenuation near the die by normal
aerodynamic drag forces, since fiber and air speeds become nearly equal only a few cm from the die.
A third explanation for Figure 8 is that collector location directly influenced airflow near the collector. Previous work showss that one consequence of reducing DCD was to increase airflow divergence near the collector and consequently increase fiber flow divergence near the collector [9]. Fiber flow divergence near the collector is increased similarly by increasing the primary airflow rate. Increased fiber flow divergence spreads fibers through a larger region of space and consequently decreases diameter reduction from fiber contact/entanglement. The data in Figure 8
are consistent with this explanation since diameters remain larger at smaller DCD’s even when primary airflow rate was increased.
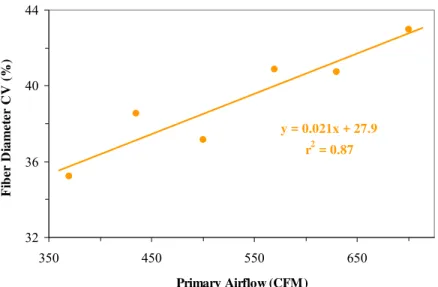
Figure 9 provides fiber diameter CV’s for the commercial MB line after averaging CV values for webs produced at five different DCD’s for each primary air speed. This figure shows that fiber diameters became less uniform when primary airflow rate was increased. A regression line fitted to the data shows that the influence of primary airflow rate on the broadness of fiber diameter distributions is notable. A 100 ft3/min change in primary airflow rate produced a 2.1% change in CV.
It is reasonable to expect that fiber diameter uniformity was reduced at higher primary airflow rates because airflow uniformity was reduced at higher airflow rates. Marla and Shambaugh reported that substantial variations in air velocity exist along the face of a MB die [10].
y = 0.021x + 27.9
r2 = 0.87
32 36 40 44
350 450 550 650
Primary Airflow (CFM)
F
ib
er D
iam
et
er
C
V
(
%)
.
Figure 9. Fiber diameter coefficients of variation for the commercial MB line.
Overall, the effect of primary airflow rate on fiber diameter was complex. When primary airflow rate was increased, fiber diameters became finer and less uniform, although mean diameter depended on DCD. It is reasonable to conclude that primary airflow rate influenced fiber diameter reduction as a result of aerodynamic drag near the die. It also seems likely that fiber contact/entanglement near the collector was influenced by both primary airflow rate and DCD. This can partly explain the complexity observed in our data. Our fiber diameter data also suggest that airflow uniformity was reduced when airflow rate was increased. Practical airflow rate variations during MB probably have a notable effect on the broadness of fiber diameter distributions in webs.
Die Temperature
Figure 10 provides mean fiber diameter as a function of die temperature for the research line after averaging mean diameters from webs produced using five different DCD’s. This figure shows that mean diameter was reduced when die temperature was increased. A regression line fitted to the data shows that the influence of die temperature on mean diameter was substantial. A 10 o C change in die temperature produced a 2.5 μm change in mean fiber diameter.
y = -0.25x + 73.5
r2 = 0.93
5 10 15 20 25 30
175 200 225 250 275
Die Temperature (C)
Me
an
F
ib
er
D
iam
(
u
m
)
.
Figure 10. Mean fiber diameters for the research MB line.
Figure 11 provides the maximum fiber diameter in sets of 250 fiber measurements for webs after averaging maximum diameters from webs produced using five different DCD’s. Like mean diameter, this figure shows that maximum fiber diameter decreased when die temperature was increased. A regression line fitted to the data shows that the influence of die temperature on maximum fiber diameter was substantial. A 10 o C change in die temperature produced a 4.9 μm change in maximum fiber diameter.
Marla and Shambaugh reported substantial variations in temperature along the face of a MB die [10]. In view of this, Figures 10-11 suggest that incidental die temperature variations in a MB line probably contribute significantly to fiber diameter variations in webs. Comparisons of
Figures 2, 7 and 10 indicate that nonuniformity in die temperature probably contributes more to fiber diameter variations than nonuniformity in DCD or primary airflow rate.
These results are qualitatively consistent with many reports in the literature that have shown that mean fiber diameter is influenced by die temperature. It is generally thought that finer fibers are produced at higher die temperatures because fibers elongate easier near the die when polymer viscosity decreases at higher temperatures. However, Marla and Shambaugh’s modeling study also predicts that a higher polymer temperature at the die resulted in higher temperatures at all points along the threadline [10]. This suggests that fiber diameter development through the entire die-collector space is influenced by die temperature. That is, fiber diameter data in Figures 10-11
y = -0.49x + 152
r2 = 0.90
15 25 35 45 55 65
175 200 225 250 275
Die Temperature (C)
Max F
ib
er
D
iam
(
u
m
)
.
Figure 11. Maximum fiber diameters for the research MB line.
Collector Speed
Webs were collected using two different collector speeds while maintaining all other processing variables constant. Increasing collector speed 83% increased mean fiber diameter values only slightly (from 9.6 μm to 9.7 μm). Figure 12 provides fiber diameter distributions for the webs. These results indicate that collector speed had little influence on fiber diameter.
0 4 8 12
2 6 10 14 18 22
Fiber Diameter (um)
P
er C
en
t
Faster Coll Speed (12 gsm)
Slower Coll Speed (22 gsm)
Figure 12. Fiber diameter distributions for the research MB line.
Resin Throughput Rate
Modeling studies [7,10] and experimental measurements [6] have shown that mean fiber
We found that mean fiber diameter increased approximately 11% (from 9.6 μm to 10.7 μm) when polymer throughput rate was increased from 0.4 ghm to 1.0 ghm. Figure 13 provides fiber diameter distributions for the webs. This figure shows that increased resin throughput rate did not simply shift the diameter distribution to larger fiber diameters. Instead, increasing resin throughput rate substantially decreased the percent of the finest fibers but had only a small affect on other fiber sizes. This suggests that throughput rate did not simply influence diameter
attenuation near the die as a result of aerodynamic drag. It is likely that resin throughput rate also influenced diameter development not near the die as a result of other mechanisms.
Overall, it is probably reasonable to conclude that incidental variations in resin throughput rate during MB have a moderate affect of fiber diameter in webs.
0 4 8 12
2 6 10 14 18 22
Fiber Diameter (um)
P
er C
en
t
1.0 ghm
0.4 ghm
Figure 13. Fiber diameter distributions for the research MB line.
Comparison of Processing Variables
Web processing and fiber diameter analysis conducted for this study provide enough data to reach a general conclusion about the relative influence of processing variables on fiber diameter development during MB. Our measurements indicate that fiber diameter is influenced most substantially by die temperature, moderately by primary airflow rate, moderately by resin throughput rate, only slightly by DCD and insignificantly by collector speed.
CONCLUSIONS
Die temperature had a significant influence on mean fiber diameter in webs. This was thought to be associated with the influence of die temperature on polymer viscosity through the entire die-collector space. Die temperature was thought to influence diameter reduction from both
aerodynamic drag near the die and fiber contact/entanglement at locations not near the die.
The effect of primary airflow rate on fiber diameter was complex. Mean diameter was affected by airflow rate more when DCD was larger than when DCD was smaller. This was thought to occur because collector location influenced airflow near the collector. That is, reducing DCD increased the divergence of fiber flow near the collector which, in turn, spread fibers through a larger region of space and decreased diameter reduction by fiber contact and entanglement. Fiber diameters became less uniform when primary airflow rate was increased, especially when DCD was large. This was viewed as evidence that airflow was less uniform at higher primary airflow rates.
Resin throughput rate had a moderate effect on fiber diameter. Increasing resin throughput rate did not simply shift the diameter distribution to larger fiber diameters. Instead, increasing resin throughput rate substantially decreased the percent of the finest fibers but had only a small affect on other fiber sizes. This suggests that throughput rate did not simply influence diameter
attenuation near the die as a result of aerodynamic drag but also influenced diameter development not near the die as a result of other mechanisms.
As DCD was increased, mean fiber diameter decreased, maximum fiber diameter increased and diameter CV increased. These results were viewed as evidence that increasing DCD resulted in smaller diameters by fiber contact/entanglement and larger diameters by fiber contact/fusion or fiber shrinkage.
Comparison of mean fiber diameters and fiber diameter distributions for webs produced
identically except using different collector speeds showed that collector speed had little influence on fiber diameter.
REFERENCES
1 Yin, H., Yan, Z. and Bresee, R.R.; Experimental Study of the Melt Blowing Process,
International Nonwovens Journal, vol. 8/issue 1, pp. 60-65, 1999
2 Yin, H., Yan, Z., Ko, W-C. and Bresee, R.R.; Fundamental Description of the
Meltblowing Process, International Nonwovens Journal, vol. 9/issue 4, pp. 25-28, 2000
3 Bresee, R.R. and Ko, W-C.; Fiber Formation During Melt Blowing, International Nonwovens Journal, vol. 12/issue 2, pp. 21-28, 2003
4 Huang, X.C. and Bresee, R.R.; Characterizing Nonwoven Web Structure Using Image Analysis Techniques. Part IV: Fiber Diameter Analysis for Spunbonded Webs,
5 Yan, Z. and Bresee, R.R.; Flexible Multifunction Instrument for Automated Nonwoven Web Structure Analysis, Textile Research Journal, vol. 69, pp. 795-804, 1999
6 Moore, E.M., Papavassiliou, D.V. and Shambaugh, R.L.; Air Velocity, Air Temperature, Fiber Vibration and Fiber Diameter Measurements on a Practical Melt Blowing Die,
International Nonwovens Journal, vol. 13/issue 3, pp. 43-53, 2004
7 Chen, T., Li, L. and Huang, X.; Fiber Diameter of Polybutylene Terephthalate Melt Blown Nonwovens, Journal of Applied Polymer Science, vol. 97, pp. 1750-1752, 2005
8 Cheng, T. and Huang, X.; Air Drawing of Polymers in Melt Blowing Process, Mathematical Modeling, Modeling and Simulation in Materials Science and
Engineering, vol. 12, pp. 381-388, 2004
9 Bresee, R.R. and Qureshi, U.A.; Fiber Motion Near the Collector During Melt
Blowing. Part I: General Considerations, International Nonwovens Journal, vol. 11/issue 2, pp. 27-34, 2002