www.atmos-chem-phys.net/11/12437/2011/ doi:10.5194/acp-11-12437-2011
© Author(s) 2011. CC Attribution 3.0 License.
Chemistry
and Physics
Emission controls versus meteorological conditions in determining
aerosol concentrations in Beijing during the 2008 Olympic Games
Y. Gao1,2, X. Liu1, C. Zhao1, and M. Zhang2
1Pacific Northwest National Laboratory, Richland, WA, USA
2State Key Laboratory of Atmospheric Boundary Layer Physics and Atmospheric Chemistry (LAPC),
Institute of Atmospheric Physics, Chinese Academy of Sciences, Beijing, China Received: 30 April 2011 – Published in Atmos. Chem. Phys. Discuss.: 14 June 2011
Revised: 10 November 2011 – Accepted: 20 November 2011 – Published: 12 December 2011
Abstract. A series of emission control measures were un-dertaken in Beijing and the adjacent provinces in China dur-ing the 2008 Beijdur-ing Olympic Games on 8–24 August 2008. This provides a unique opportunity for investigating the ef-fectiveness of emission controls on air pollution in Beijing. We conducted a series of numerical experiments over East Asia for the period of July to September 2008 using a cou-pled meteorology-chemistry model (WRF-Chem). Model can generally reproduce the observed variation of aerosol concentrations. Consistent with observations, modeled con-centrations of aerosol species (sulfate, nitrate, ammonium, black carbon, organic carbon, total particulate matter) in Bei-jing were decreased by 30–50 % during the Olympic period compared to the other periods in July and August in 2008 and the same period in 2007. Model results indicate that emission controls were effective in reducing the aerosol concentrations by comparing simulations with and without emission con-trols. In addition to emission controls, our analysis suggests that meteorological conditions (e.g. wind direction and pre-cipitation) were also important in producing the low aerosol concentrations appearing during the Olympic period. Trans-port from the regions surrounding Beijing determined the daily variation of aerosol concentrations in Beijing. Based on the budget analysis, we suggest that to improve the air quality over Beijing, emission control strategy should focus on the regional scale instead of the local scale.
Correspondence to:X. Liu ([email protected])
1 Introduction
During the past three decades, the rapid economic growth in China has caused a significant increase in the emission of aerosols and precursor gases. This leads to highly ele-vated aerosol concentrations, especially in some mega-cities (e.g. Beijing and Shanghai) and Pearl River Delta Region (e.g. Q. Zhang et al., 2009; Chan and Yao, 2008). In these regions, particulate aerosol is the major cause of severe air pollution. Aerosol species including sulfate (SO4), nitrate
(NO3), ammonium (NH4), black carbon (BC), organic
car-bon (OC), and dust could have significant impacts on envi-ronment and climate change in China (Tang et al., 2004; Han et al., 2008; Chan and Yao, 2008).
Beijing, China’s capital city with a population of more than 16 millions, is one of the largest metropolises in the World. PM10 (Particle Matter of 10 µm or less in the
aero-dynamic diameter) is reported to be the major cause of air pollution in Beijing on about 90 % of days from 1999 to 2005 (Beijing Environmental Bulletin, 1994–2005) and its concentration exceeds the China’s Grade-2 Standard (daily averaged concentration of PM10 of 150 µg m−3) on 30 % of
Beijing. Streets et al. (2007) showed that 34 % of PM2.5
(Par-ticle Matter of 2.5 µm or less in the aerodynamic diameter) and 35–60 % of ozone (O3) in Beijing were transported from
the regions surrounding Beijing based on simulations using the Community Multiscale Air Quality (CMAQ) model.
After being selected as the host of the 29th Olympic Games, the city government of Beijing has paid more at-tention to its air pollution problem. In order to achieve the goal that concentrations of sulfur dioxide (SO2), nitrogen
dioxide (NO2), and O3meet the standards suggested by the
World Health Organization and concentrations of particulate matters meet the standards for the major cities of developed countries during the Olympic Games, City Government of Beijing implemented a series of emission control measures in Beijing and its surrounding regions prior to and during the Olympics (Report “29th Beijing Olympic Games Air Quality Safeguards” drafted by the Environmental Protection Agency of China et al.; M. Wang et al., 2009). Before the full-scale control (pre-20 July 2008), heavy industrial polluters (e.g. the Capital Steel Company) were relocated, and 50 % of gov-ernment cars were not allowed to drive in Beijing after 23 June 2008. During the full-scale control (from 20 July to 19 September 2008), first, the odd/even license plate num-ber rule was applied on personal vehicles in Beijing; sec-ond, stricter control was applied on vehicles entering Bei-jing; third, the production of some factories that can cause air pollution was limited or even stopped. In addition, ex-tra 20 % government cars were not allowed to drive in Bei-jing, some outdoor constructions were stopped, and usages of coal-burning facilities were restricted during 8–24 August (the period of the Olympic Games) and 7–19 September (the period of the Paralympics). These measures offer a unique opportunity to investigate the effect of emission controls on the air quality in a mega-city. Several universities and re-search institutes in China had set up observation networks in Beijing and its surrounding provinces during the emis-sion control period. Previous studies indicated that emisemis-sion controls were effective in improving the air quality in Bei-jing in terms of reducing gas and aerosol concentrations dur-ing the Olympics (e.g. T. Wang et al., 2009; Cermak et al., 2009; Y. Wang et al., 2009; X.-Y. Zhang et al., 2009; Yang et al., 2011). Based on observed emission factors, S. Wang et al. (2010) estimated that emissions of aerosol precursors (e.g. SO2, nitrogen oxides (NOx), non-methane volatile
or-ganic compounds “NMVOCs”) during the Olympic Games were reduced by about 40–60 % compared with those in June 2008. M. Wang et al. (2009) found that on-road concentra-tions of NOx, SO2, carbon monoxide (CO), and BC were
reduced by 41 %, 70 %, 54 %, and 12 %, respectively during the Olympics, compared to those of the pre-control period (before 20 July 2008) from measurements by a mobile lab-oratory. The mean daytime O3concentration was reduced
by about 15 ppbv and daytime SO2, CO, and reactive
odd-nitrogen (NOy) concentrations were reduced by 61 %, 25 %,
and 21 %, respectively, during the Olympic Games,
com-pared to those of the same period in 2006 and 2007 from measurements at a rural site (Miyun site) of Beijing (Y. Wang et al., 2009).
As important as emissions, meteorological conditions can influence the air quality in mega-cities by affecting the chem-ical production of secondary pollutants in the atmosphere, wet/dry deposition of pollutants, and diffusion and exchange of pollutants with surrounding regions. Therefore, it is im-perative to understand the role of meteorological conditions in determining the aerosol pollution during the Olympic Games. Some studies indicated that during the Olympic pe-riod, there were still high levels of air pollutants on some days, and unfavorable weather conditions were suggested to be the reason (e.g. T. Wang et al., 2010; X.-Y. Zhang et al., 2009). T. Wang et al. (2010) measured trace gases and aerosol prior to and during the Olympics and suggested that improved air quality during the Olympics has a clear rela-tionship with weather conditions. X.-Y. Zhang et al. (2009) found that aerosol concentrations were still increased on some days during the Olympics due to the stabilized weather conditions. Previous studies examined the improvement of air quality in Beijing during the Olympic period by com-paring to the pre-control periods or to the same periods in previous years. However, meteorological conditions (e.g. wind and precipitation) can be significantly different be-tween these periods. There are no studies yet to examine the relative importance of emission controls versus weather conditions in determining the air quality change during the Olympics.
In this study, we investigate the changes in aerosol con-centrations and factors determining these changes in Beijing during the Olympic Games, by using a coupled meteorology-chemistry model (WRF-Chem). The contribution of emis-sion controls versus weather condition changes is examined. We begin in Sect. 2 by introducing the WRF-Chem model and the numerical experiments conducted in this study. In Sect. 3, we give a description of observation data used in the model evaluation and result analysis. The variation of aerosol concentrations in Beijing during the Olympic Games and its relationship with emission controls and meteorology condi-tions are discussed in Sect. 4. Conclusions of this study are presented in Sect. 5.
2 Model description
2.1 WRF-Chem model
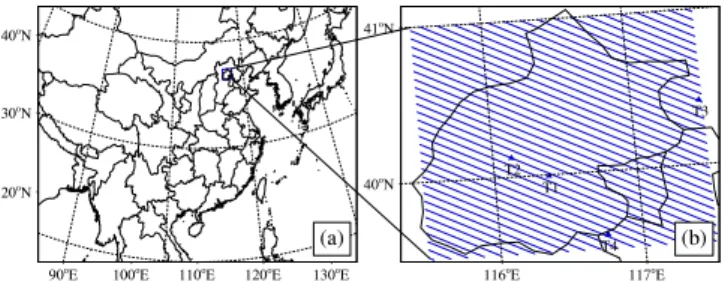
Fig. 1. Map of (a) the model simulation domain (10◦–55◦N,
70◦–150◦E) and (b) Beijing (39.43◦N–41.05◦N, 115.42◦E–
117.50◦E). The blue box in(a)denotes Beijing and is enlarged to
the shaded area in(b). The blue triangles in(b)denote four sites in the Beijing-Tianjin-Hebei Atmospheric Environment Monitoring Network.
MADE/SORGAM (Modal Aerosol Dynamics Model for Europe (MADE) and Secondary Organic Aerosol Model (SORGAM)) aerosol model (Ackermann et al., 1998; Schell et al., 2001) and the other one is CBMZ (Carbon Bond Mech-anism) photochemical mechanism (Zaveri and Peter, 1999) and MOSAIC (Model for Simulating Aerosol Interactions and Chemistry) aerosol model (Zaveri et al., 2008) which was implemented by Fast et al. (2006). The RADM2 chem-istry mechanism with the MADE/SORGAM aerosol model is used in this study. For the treatment of aerosol size dis-tribution, MADE/SORGAM uses the modal approach with three lognormal modes (Aikten, accumulation and coarse mode). All major components of aerosol are treated in the model including SO4, NO3, NH4, BC, OC, sea salt,
mineral dust, and aerosol water. Aerosol processes in the MADE/SORGAM include nucleation, condensation of both inorganic and organic aerosol, coagulation, dry/wet depo-sition, gas phase and aqueous phase chemistry, and water uptake of aerosols. Aerosol nucleation is the most impor-tant process for the formation of secondary aerosol parti-cles in the sulfuric acid-water system and is calculated fol-lowing Kulmala et al. (1998). Aerosol growth by con-densation occurs in two steps: the production of condens-able material (vapor) by reactions of chemical precursors, and the condensation and evaporation of ambient volatile species on aerosols using the modal approach of Binkowski and Shankar (1995). The formulation for the coagulation process follows Whitby et al. (1991) and Binkowski and Shankar (1995). Dry deposition in MADE/SORGAM is cal-culated through the deposition velocity which is proportional to the sum of aerodynamic, sublayer, and surface resistances from the parameterization by Wesley (1989). Wet deposi-tion includes the in-cloud aerosol removal based on the con-version rate of cloud water to rain water, and below-cloud aerosol removal by impaction and interception, following the formulation by Easter et al. (2004) for both large-scale and convective precipitation. Aerosol-cloud interactions were in-cluded in the model by Gustafson et al. (2007) for
calculat-ing the activation and resuspension between dry aerosols and cloud droplets, which is similar to the method used in the MIRAGE general circulation model (Ghan et al., 2001).
2.2 Numerical experiments
In this study, WRF-Chem is configured to cover East Asia (10–55◦N, 70–150◦E) with 110◦(S–N)×160◦(W–E) grid
points, a 36 km horizontal resolution centering at central China (30◦N, 110◦E), and 35 vertical layers up to 10 hPa.
Figure 1a shows the experiment domain (the outer-most box), and the shaded area in Fig. 1b (enlarged from the blue box in Fig. 1a) shows Beijing (39.43–41.05◦N, 115.42–
117.50◦E). Here, the scope of Beijing includes urban area
and rural areas according to administrative divisions. The Runge-Kutta 3rd order time-integration scheme, Noah land surface model, Mellor-Yamada-Janjic Planetary Boundary Layer scheme, and Grell-Devenyi Ensemble Cumulus clouds scheme are used in this study. The land use data used in the model are from 5 min resolution USGS (United States Ge-ological Survey) 24 category data, which were derived from 1 km Advanced Very High Resolution Radiometer (AVHRR) measurement in a 12-month period spanning from April 1992 to March 1993 (Loveland et al., 1991; Brown et al., 1993). The Lin cloud microphysics scheme is used to include the aerosol indirect effect and RRTMG longwave/shortwave scheme is used to include aerosol direct effect (Zhao et al., 2010a). For chemistry, RADM2 photochemical mech-anism, MADE/SORGAM aerosol model and Fast-J Pho-tolysis scheme are used. The initial meteorological fields and boundary conditions are from NCEP Final reanalysis data with 1◦
The simulation is conducted for the period of May to September 2008 by reinitializing meteorological conditions every 5 days with NCEP Final reanalysis data and includ-ing an overlap period of one day for each simulation block for meteorological spin up. The modeledu-component and v-component of wind, temperature and water vapor mixing ratio are also nudged over the whole domain. The method of nudging (Newtonian relaxation) relaxes the modeled state toward the observed state by adding, to one or more of the prognostic equations, artificial tendency terms based on the difference between modeled and observed states (Stauffer and Seaman, 1990, 1994; Stauffer et al., 1991). The sim-ulation is nudged towards the NCEP reanalysis data with a nudging time scale of 6 h.
We conducted five numerical experiments from 1 May to 2 September 2008 as listed in Table 1: (1) the control ex-periment (CTL) was driven by the meteorological conditions of 2008 and the emissions of 2008 with emission controls from 20 July to 2 September; (2) experiment (CTL-BJ0) was driven by the meteorological conditions of 2008 and the emissions of 2008 but with emissions in Beijing (Fig. 1b) set to be zero and with emission controls over the rest of model domain from 20 July to 2 September; (3) experiment (CTL-RD0) was driven by the meteorological conditions of 2008 and the emissions of 2008 with emission controls in Beijing and with emissions over the rest of model domain (i.e. domain outside the inner blue box in Fig. 1a) set to be zero from 20 July to 2 September; (4) experiment (NO-CTL) was driven by the meteorological conditions of 2008 and the business-as-usual emissions of 2008 (i.e. no emission con-trols); (5) experiment (NO-CTL07) was driven by the mete-orological conditions of 2007 and the emissions of 2007.
2.3 Emissions
Anthropogenic emissions of CO, NOx, SO2, volatile organic
compounds (VOCs), BC, OC, PM2.5and PM10 used in the
simulations over the model domain are obtained from David Streets’ 2006 emission inventory (http://www.cgrer.uiowa. edu/EMISSION DATA new/index 16.html), which consists of four sectors (power, industry, residential, and transporta-tion). According to the increase of anthropogenic emis-sions in Asia from 2001 to 2006 (Q. Zhang et al., 2009), we calculate the increasing rate for each species of anthro-pogenic emissions per year to be 3.36 % for CO, 9.16 % for NOx, 6.34 % for SO2, 5.22 % for VOC, 2.66 % for BC, OC
and PM2.5, and 2.47 % for PM10, and project the emissions
for 2007 and 2008. As there is no NH3 emission in the
David Streets’ 2006 emission inventory, we use the 2008 NH3 emission from Regional Emission inventory for Asia
domain (REAS, http://www.jamstec.go.jp/frsgc/research/d4/ emission.htm). Biomass burning emission is obtained from the Global Fire Emissions Database, Version 2 (GFEDv2.1), which has one-month temporal resolution (Randerson et al., 2005). Biogenic emission is from the Model of Emission of
Gases and Aerosol from Nature (MEGAN) (Guenther et al., 2006). Dust emission is calculated online following Zhao et al. (2011). There is no information available for the verti-cal distribution of anthropogenic emissions over East Asia, so we emitted the emissions into the lowest model layer. For horizontal distribution, the anthropogenic emissions are in-terpolated from the raw data grids (0.5×0.5 degree) into our domain grids (36×36 km). As far as we know, the diurnal or daily emission inventory is not available over East Asia. We thus assumed no temporal variation of anthropogenic emissions in this study. Only the temporal change of an-thropogenic emissions due to emission control is considered (i.e. different percentage of emission reductions for different periods).
According to the study by S. Wang et al. (2010) for the emission reduction in Beijing during the Olympics, (and per-sonal communication, K. He of Tsinghua University, 2011), we estimate that from 20 July to 7 August prior to the Olympic Games and from 25 August to 6 September after the Olympic Games, anthropogenic emissions decreased by 35 % for Beijing, 20 % for Hebei province (the province im-mediately surrounding Beijing) and 10 % for other places in China. During the Olympic Games (8–24 August) and Paralympics (7–19 September), anthropogenic emissions de-creased by 50 % for Beijing, 35 % for Hebei province and 10 % for other places in China. The restrictions on coal burn-ing pollution in the provinces (Hebei, Shanxi, Inner Mon-golia, Shandong, etc.) surrounding Beijing were conducted based on the air quality status in Beijing, which worked to-gether to protect Beijing’s air quality. Thus, we estimate that the emission control in Hebei province (the province imme-diately surrounding Beijing) was weaker than that in Beijing, but stronger than the emission control in other provinces. These estimated emissions are used in our numerical experi-ments listed in Table 1. We note that there are uncertainties with the actual starting date of emission controls and exact emission reduction percentages in Beijing and surrounding provinces. We will discuss their impact on our conclusions in Sect. 5.
3 Observational Data
3.1 Beijing-Tianjin-Hebei Atmospheric Environment
Monitoring Network
Observations of PM2.5 (Xin et al., 2010) from July to
Table 1.Numerical experiments performed in this study.
Experiment Emission used in the WRF-Chem simulation
CTL 2008 emission with emission controls from 20 Jul–2 Sep
CTL-BJ0 2008 emission over Beijing is set to zero and with emission control over the rest of the model domain from 20 Jul–2 Sep
CTL-RD0 2008 emission with emission control over Beijing and emission over the rest of model domain is set to zero from 20 Jul–2 Sep
NO-CTL 2008 emission without emission control from 20 Jul–2 Sep NO-CTL07 2007 emission from May to Sep
SO2 Analyzer, a Model 49C&49I O3 Analyzer, and a
Model RP 1400-PM2.5. The four sites in the network
are T1 (40.00◦N, 116.38◦E), T2 (40.13◦N, 116.13◦E), T3
(40.42◦N, 117.48◦E), and T4 (39.60◦N, 116.75◦E), which
are shown in Fig. 1b as blue triangles. T1 is an urban site lo-cated between the North Third Ring road and the North Forth Ring road. T2, T3 and T4 are suburban sites, which are more than 35 km away from Beijing urban area and distributed in different directions of Beijing.
3.2 Olympic monitoring campaign by China
Meteorological Administration (CMA)
The 2008 Olympic Monitoring Campaign was operated by CMA from June to September 2008 (X.-Y. Zhang et al., 2010). Various atmospheric components including SO4,
NO3, NH4, and BC were measured at three urban stations
and four rural stations in Beijing and its vicinity. The obser-vations at CMA (39.95◦N, 116.33◦E) site, which is located
in the urban area of Beijing, are available to us and used in this study.
3.3 PERSIANN
We use the PERSIANN hourly precipitation data (Hsu et al., 1999; Sorooshian et al., 2000) during July and August of 2008 on a 0.25◦ grid (60◦S–60◦N). In the PERSIANN
system, a neural network trained by precipitation from the TRMM Microwave Imager (TMI) and other microwave mea-surements (Hsu et al., 1997, 1999) was used to estimate 30 min precipitation rates from infrared (IR) and visible im-agery from geostationary satellites.
4 Results
4.1 Reduction of aerosol concentrations during the Olympic Games
Time series of PM2.5concentration at the surface layer
dur-ing July and August of 2008 are shown in Fig. 2 to illustrate
Fig. 2.Daily PM2.5from observations and the corresponding
WRF-Chem simulations in CTL and NO-CTL cases from 1 July to 31 August at the four sites (T1, T2, T3 and T4).
the change of air quality during the Olympics. This figure compares the observed and simulated PM2.5 concentration
in the CTL and NO-CTL cases at four sites (T1, T2, T3, and T4) of the Beijing-Tianjin-Hebei Atmospheric Environment Monitoring Network. These four sites are chosen as they can represent different areas of Beijing (Fig. 1b). In general, model simulation in the CTL case captures the daily vari-ations of observed PM2.5concentration at the four sites in
July and August. For all the sites, there are four PM2.5
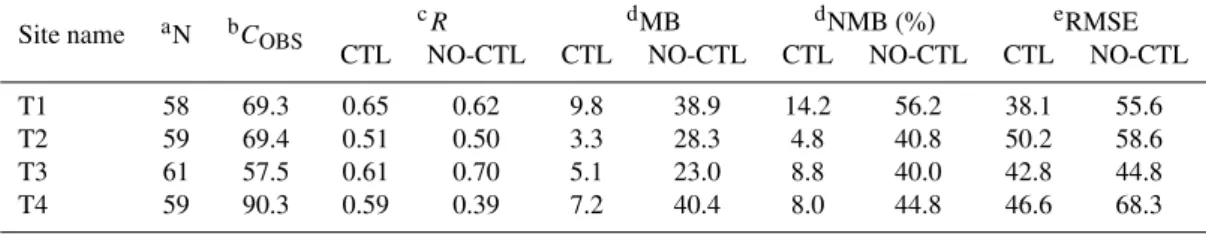
Table 2.Statistical analysis of the comparisons between simulated and observed PM2.5concentrations (µg m−3) in July and August 2008.
Site name aN bCOBS
cR dMB dNMB (%) eRMSE
CTL NO-CTL CTL NO-CTL CTL NO-CTL CTL NO-CTL T1 58 69.3 0.65 0.62 9.8 38.9 14.2 56.2 38.1 55.6 T2 59 69.4 0.51 0.50 3.3 28.3 4.8 40.8 50.2 58.6 T3 61 57.5 0.61 0.70 5.1 23.0 8.8 40.0 42.8 44.8 T4 59 90.3 0.59 0.39 7.2 40.4 8.0 44.8 46.6 68.3
aNis the number of daily samples between observations and model results in July and August. bC
OBSis the daily value of observations averaged in July and August.
cRis the correlation coefficient between observations and model results of CTL and NO-CTL, respectively.
dMB is the mean bias between model results of CTL and NO-CTL and observations, respectively. NMB is the normalized mean bias between model results of CTL and NO-CTL
and observations, respectively.
eRMSE is the root mean square error between model results of CTL and NO-CTL and observations, respectively.
and 28 August. Observed PM2.5concentrations at T1 site are
120–180 µg m−3at these peaks. During other periods, PM
2.5
concentrations are much lower, especially for the Olympic period with values of 40–70 µg m−3. Both simulations and
observations show that PM2.5concentrations at T2 site have
almost the same fluctuations as those at T1 site and also have the similar values of PM2.5concentrations, although T2 is a
suburban site. Both observed and simulated PM2.5
concen-trations at T3 site are the lowest during the Olympic period compared to other sites as it is located in the northeast di-rection of Beijing, which is a mountain area with relatively clean background. Observed and simulated PM2.5
concen-trations at T4 site are similar to or often higher than those at the urban site (T1) because T4 site is surrounded by sev-eral other industrial cities such as Tianjin and Tangshan. At all the four sites, PM2.5concentrations are significantly
un-derestimated by the model during 24–28 July while overes-timated during 24–30 August. The underestimation might be due to the incorrect emissions. The overestimation is as-sociated with the bias in simulated grid-scale precipitation, which will be discussed in Sect. 4.2.2. Modeled PM2.5
con-centrations from the CTL case agree with observations rea-sonably well during the Olympic period, although the model results slightly overestimate the observations. In compari-son modeled PM2.5 concentrations from the NO-CTL case
significantly overestimate the observations. The compari-son between the CTL and NO-CTL case will be discussed in Sect. 4.2.1 to illustrate the impact of emission controls.
Table 2 summarizes the statistical analysis between ob-served and simulated daily PM2.5 concentrations in both
CTL and NO-CTL cases at the four sites (in Fig. 2) from July to August 2008. N is the number of daily samples be-tween observations and simulations at each site in July and August. The correlation coefficients (R) between observa-tions and model simulaobserva-tions in both cases range from 0.5 to 0.7. The similarRvalues for both cases indicate that emis-sion controls have a limited impact on the co-variation of modeled and observed PM2.5concentrations. There is
pos-itive mean bias (MB) of PM2.5concentration from the CTL
case compared to observations with values of 9.8, 3.3, 5.0, and 7.2 µg m−3 for the four sites, respectively, which are,
however, substantially lower than the values of 38.9, 28.3, 23.0, and 40.4 µg m−3 from the NO-CTL case. In
addi-tion, the normalized mean bias (NMB) ranges from 4.8 % to 14.2 % in the CTL case, which is much lower than the cor-responding NMB of 40.0 % to 56.0 % in the NO-CTL case for the four sites. The root mean square error (RMSE) is also reduced in the CTL case. The improvement of model simula-tion in the CTL case compared to the NO-CTL case indicates that emission controls effectively reduce the aerosol particle concentrations.
Table 3 shows the PM2.5 concentrations at the above
sites from observations and simulations in the CTL, NO-CTL and NO-NO-CTL07 cases averaged for the four sub-periods from July to August (i.e. prior to emission controls: 1–19 July; with emission controls prior to Olympic Games: 20 July–7 August; with emission controls during the Olympic Games: 8–24 August; and with emission controls post-Olympic Games: 25–31 August). At T1 site, the observed PM2.5concentration is 42.4 µg m−3during the Olympic
pe-riod, lower than the values of 68.2–92.4 µg m−3 (40–50 %
lower) during the other periods from July to August 2008. The CTL case also simulates the lowest PM2.5
concentra-tion of 54.5 µg m−3 during the Olympic period, compared
to the values of 78.0–112.2 µg m−3 (30–50 % lower)
dur-ing the other periods from June to August 2008. At T2 site, the observed PM2.5 concentration is 35.3 µg m−3
dur-ing the Olympic period, which is lower than the values of 48.7–109.6 µg m−3 (30–70 % lower) during the other
peri-ods from July to August 2008. PM2.5concentration from the
CTL case is 49.9 µg m−3 during the Olympic period,
com-pared to the values of 68.8–107.3 µg m−3 (30–50 % lower)
during the other periods from July to August 2008. At T3 site, the observed PM2.5concentration is 23.5 µg m−3during
Table 3.Comparisons of observed and modeled averaged PM2.5concentrations (µg m−3) during four sub-periods at four sites. The column
with numbers in bold denotes the PM2.5concentration during Beijing Olympic Games (8–24 August).
Site name 1–19 Jul 20 Jul–7 Aug 8–24 Aug 25–31 Aug
T1
OBS 70.9 92.4 42.4 68.2 CTL 92.8 78.0 54.5 112.2 NO-CTL 92.8 112.9 95.2 159.7 NO-CTL07 90.1 104.1 73.7 56.4
T2
OBS 66.7 109.6 35.3 48.7 CTL 86.2 68.8 49.9 107.3 NO-CTL 86.2 99.0 85.5 149.6 NO-CTL07 80.2 94.3 58.6 46.8
T3
OBS 48.5 92.6 23.5 64.2 CTL 74.7 63.2 38.9 81.6 NO-CTL 74.7 89.6 63.0 111.6 NO-CTL07 74.7 84.1 65.0 49.3
T4
OBS 109.8 117.5 47.2 77.8 CTL 114.8 94.6 70.2 129.1 NO-CTL 114.8 135.2 120.4 183.6 NO-CTL07 96.5 124.0 107.9 81.8
case simulated PM2.5concentration is 38.9 µg m−3, which is
35–50 % lower than the values of 63.2–81.6 µg m−3during
the other periods. At T4 site, the observed PM2.5
concen-tration is 47.2 µg m−3during the Olympic period, which is
40–60 % lower than the values of 77.8–117.5 µg m−3during
the other periods. Simulated PM2.5concentration in the CTL
case is 70.2 µg m−3during the Olympic period, which is 25–
50 % lower than the values of 94.6–129.1 µg m−3during the
other periods. From the above discussion, modeled PM2.5
concentration from the CTL case during the Olympic period is 25–50 % lower than the values during the other periods. Observations show even larger reductions (by up to 75 %). This is because the model simulation (CTL) underestimates PM2.5concentration during 20 July–7 August (Fig. 2). Thus
the modeled difference between this period and the Olympics period is underestimated. Some measurement studies (e.g. Y. Wang et al., 2009) reported the effectiveness of emission controls by comparing aerosol and/or precursor concentra-tions during the Olympic period with those of the same pe-riod in 2006 and 2007 (same as our NO-CTL07 case). We note that the conclusion drawn from such comparisons may not be robust since there are strong inter-annual variations of meteorological conditions. As shown in Table 3, PM2.5
con-centrations are significantly different between the NO-CTL case during the Olympic period and the NO-CTL07 case dur-ing the same period at T1, T2 and T4 sites. Without emission control, we would not expect much difference between the emissions in 2007 and 2008. Thus aerosol concentration dif-ferences between NO-CTL and NO-CTL07 are mainly due to the difference in meteorological conditions between 2007 and 2008.
Table 4 lists the aerosol concentrations of SO4, NH3, NH4,
BC, and OC from observations at the CMA site (39.95◦N,
116.33◦E) (X.-Y. Zhang et al., 2010) and model simulations
in the CTL and NO-CTL cases averaged for the five sub-periods from 1 June to 31 August 2008. In general, the model underestimates observed SO4, which may be caused
by the underestimation of SO2emission in the model. Both
observations and model simulations in the CTL case show that the aerosol species concentrations are much lower dur-ing the Olympic period (8–24 August) than those durdur-ing the pre- and post-Olympic periods. The observed SO4
concen-tration is 12.0 µg m−3during the Olympic period, lower than
the values of 19.9–25.2 µg m−3(35–50 % lower) during the
other periods from June to August 2008. The CTL case also simulates the lowest SO4 concentration of 9.4 µg m−3
dur-ing the Olympic period, compared to the values of 15.2– 18.6 µg m−3(40–60 % lower) during the other periods from
June to August 2008. For NO3, model results are higher than
observations, reflecting the difficulty of model to simulate the partitioning of HNO3 (g) into aerosol phase. The
ob-served NO3concentration is 7.0 µg m−3during the Olympic
period, which is also 30–60 % lower than the values of 11.4– 20.4 µg m−3 during the other periods from July to August
2008. In the CTL case, NO3concentration is also the lowest
with the value of 15.5 µg m−3during Olympic period,
com-paring to 21.6–40.8 µg m−3 (30–60 % lower) during other
periods from June to August 2008. The observed NH4
con-centration is 6.6 µg m−3during the Olympic period, which
is 30–50 % lower than the values of 9.4–12.7 µg m−3during
during the Olympic period, compared to the values of 12.1– 18.8 µg m−3(30–50 % lower) during the other periods from
June to August 2008. The model simulated BC concentra-tions for the CTL case agree well with observaconcentra-tions. The ob-served BC concentration is 3.0 µg m−3during the Olympic
period, lower than the values of 4.8–6.5 µg m−3 (35–50 %
lower) during other periods from June to August 2008. The CTL case also simulates the lowest BC concentration of 3.8 µg m−3during the Olympic period, compared to the
val-ues of 5.6–7.3 µg m−3(35–50 % lower) during the other
pe-riods from June to August 2008. For OC, model significantly underestimates observations because of the incomplete treat-ment of secondary organic aerosol (SOA) in the WRF-Chem model (e.g. Li et al., 2010; Shrivastava et al., 2010). OC concentrations from both model simulations for the CTL case and observations during the Olympics are about 60 % of those prior to the Olympics. As discussed above, both ob-servations and model results show that the concentrations of all the aerosol species are about 35 %–50 % lower during the Olympic period than those in the other periods from June to August 2008.
4.2 Factors for aerosol concentration reduction during the Olympic Games
4.2.1 Emission controls
Both observations and model simulations show that aerosol concentrations decreased significantly during the Olympic period compared to the values during the other periods of June–August 2008. In the following, we will investigate the relative roles of emission controls and meteorological con-ditions in affecting this reduction. Comparing model results between CTL and NO-CTL, emission controls significantly reduce PM2.5and aerosol species concentrations during the
Olympic period (Fig. 2, Table 3 and Table 4). PM2.5
concen-tration is reduced by∼40 % for all the four sites (Fig. 2 and Table 3), while the concentration of SO4, NO3, NH4, BC,
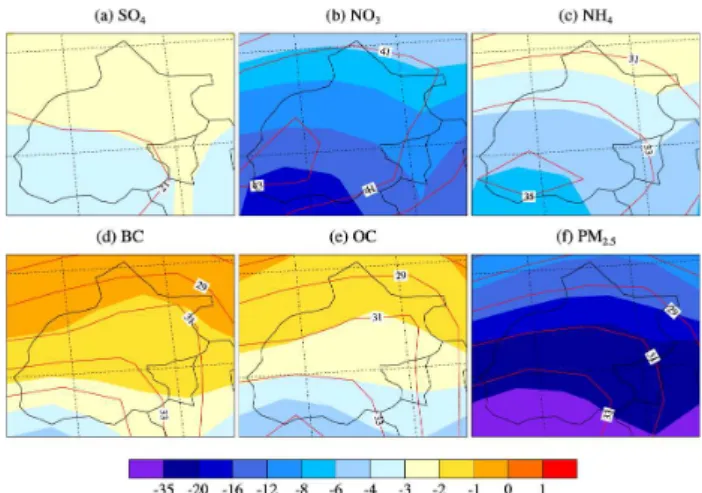
and OC is reduced by 26 %, 53 %, 44 %, 46 %, and 44 %, respectively at the CMA site (Table 4). Figure 3 shows the spatial distribution of the concentration difference of SO4,
NO3, NH4, BC, OC, and PM2.5 between the CTL case and
the NO-CTL case averaged from 20 July to 31 August (i.e. including both the Olympic period and pre-Olympic period but with full-scale emission controls) over Beijing. The re-duction of SO4 is about 2–3 µg m−3 over north of Beijing
and 3–4 µg m−3 over south of Beijing and the relative
re-duction is ∼20 % over Beijing. The reduction of NO3 is
the most among all the species, which is about 6–12 µg m−3
over north of Beijing and 12–18 µg m−3over south of
Bei-jing. The relative reduction of NO3is∼40 % over Beijing.
Reduction of NH4is about 3–4 µg m−3over north of Beijing
and 4–6 µg m−3over south of Beijing, and the relative
reduc-tion is 30–35 % over Beijing. The reducreduc-tion of BC is about 1–3 µg m−3over Beijing, and the reduction of OC is about
Fig. 3. Spatial distribution of the difference of time-averaged
con-centration between CTL case and NO-CTL case for(a)SO4, (b)
NO3,(c)NH4,(d)BC,(e)OC, and(f)PM2.5from 20 July to 31
August over Beijing. The color fill is the absolute difference in µg m−3and the red solid contour lines with number are the relative
differences in percentage (%).
1–4 µg m−3over Beijing. The relative reduction of BC and
OC are ∼30 %. For PM2.5, the reduction is 16–20 µg m−3
over north of Beijing and 20–40 µg m−3 over south of
Bei-jing. The relative reduction of PM2.5is about 30 % over
Bei-jing.
Generally, the emission control is efficient for the reduc-tion of concentrareduc-tions of all the aerosol species, including SO4 (20 %), NO3 (40 %), NH4 (30 %), BC (30 %) and OC
(30 %) during the period from 20 July to 31 August. The reduction in NO3 concentration is most sensitive while the
reduction in SO4concentration is the least for the same scale
of emission reductions of all the anthropogenic pollutants. In addition, the reduction in aerosol concentrations from emis-sion controls over south of Beijing is larger than that over north of Beijing as south of Beijing is the urban area and the concentrations of aerosol pollution are higher there. It is noted that although the WRF-Chem simulated PM2.5
con-centration is higher than observation during the Olympic and post-Olympic period (Table 3 and Fig. 2), this study focuses more on the relative impact of the emission controls versus meteorological conditions during the Olympic Games. The uncertainty of emissions can affect the absolute values of aerosol concentrations, but not the relative changes, since we apply the percentage reduction of emissions in the CTL case to the NO-CTL case.
4.2.2 Meteorological conditions
Table 4. Comparisons of observed and modeled averaged concentrations (µg m−3) of aerosol species during five sub-periods at CMA
(39.95◦N, 116.33◦E) site (observations from X.-Y. Zhang et al., 2010). The column with numbers in bold denotes the PM
2.5concentration
during Beijing Olympic Games (8–24 August).
Species June 1–19 Jul 20 Jul–7 Aug 8–24 Aug 25–31 Aug
SO4
OBS 25.2 19.9 24.0 12.0
CTL 16.4 17.4 15.2 9.4 18.6 NO-CTL 16.4 17.4 19.0 12.7 23.2
NO3
OBS 20.4 12.4 11.4 7.0
CTL 21.6 27.3 22.1 15.5 40.8 NO-CTL 21.6 27.3 36.8 33.1 64.3
NH4
OBS 12.7 9.4 11.6 6.6
CTL 12.4 14.4 12.1 8.0 18.8 NO-CTL 12.4 14.4 17.8 14.4 27.4
BC OBSCTL 6.56.8 5.07.3 4.85.9 3.03.8 5.6 NO-CTL 6.8 7.3 8.5 7.0 8.4
OC
OBS 33.6 24.2 20.7 14.8
CTL 10.6 11.0 8.9 5.8 8.9 NO-CTL 10.6 11.0 12.6 10.3 13.0
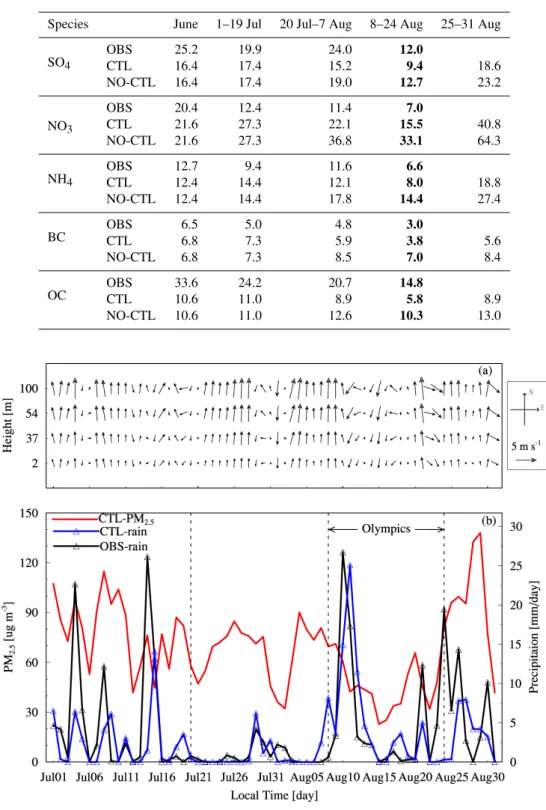
Fig. 4. Time series of(a)daily mean and grid averaged horizontal wind speed and direction from CTL case at the lowest three layers
over Beijing and(b)daily mean and grid averaged PM2.5concentration, daily sum and grid averaged precipitation rate from CTL case and
than those from the simulation without emission controls (the NO-CTL case) (Fig. 3), we argue that meteorological condi-tions play a key role in producing the low aerosol concentra-tions in most of the Olympic period. It is shown that aerosol concentrations from the NO-CTL case during the Olympic period are lower than those from 24 to 26 July, 4 to 7 Au-gust, and 28 August (peaks in Fig. 2). In addition, daily variations of aerosol concentration are large with very high PM2.5concentrations up to 150 µg m−3in the first two days
of Olympics (8–9 August) and in the period of 24 to 26 July when the full-scale emission controls are already enforced. We further suggest that emission controls have a small im-pact on the daily variations of aerosol concentration during the Olympic period, which, instead, results from the meteo-rological impact, as will be discussed below.
Figure 4 shows daily averaged horizontal wind speed and direction at the lowest three layers, daily averaged surface PM2.5concentration from the CTL case, and daily
precipita-tion rate over Beijing from 1 July to 31 August 2008. The direction of arrows in Fig. 4a denotes the horizontal wind direction on the three vertical planes and the length of the arrows denotes the horizontal wind speed. The observed 0.25◦×0.25◦precipitation data is from PERSIANN hourly
precipitation data, shown in Fig. 4b. The model generally captures the observed precipitation events in July and Au-gust 2008. PM2.5concentrations are reduced during and
im-mediate after precipitation events (e.g. 29–31 July, 9–11 Au-gust) due to the scavenging of aerosols by precipitation. The large fluctuations of PM2.5 concentration during 1–19 July
are caused by the frequent occurrence of precipitation events. The few amounts of precipitation around 26 July and 4–8 August contribute to the high PM2.5 concentration during
these periods while the heavy precipitation during 9–11 Au-gust decreases the PM2.5concentration during the Olympics.
The model underestimation of observed precipitation after 22 August results in the overestimation of PM2.5concentration
during that period (Fig. 2)
The change of PM2.5concentrations is also related to the
variation of wind direction, which, together with the occur-rence of precipitation, is associated with the weather pat-terns in Beijing. As shown in Fig. 4, high PM2.5
concen-trations always correspond to the southeasterly, southerly, or southwesterly wind, while low PM2.5 concentrations
al-ways correspond to the reverse wind direction (e.g. north-easterly wind). Beijing is surrounded by Yanshan Mountain to the northeast, Taihang Mountain to the west, and Mongo-lian plateau to the northwest, thus northerly wind blow clean air into Beijing, whereas aerosol particles can be transported by the southerly wind from the southern polluted regions and accumulated over the Beijing area. Figure 4 shows that the dominated southerly wind during 22–26 July and during 4–9 August leads to high PM2.5concentrations during these
pe-riods, while the northeasterly wind during 11–20 August re-sults in a continuous period with low aerosol concentrations for the Olympic Games.
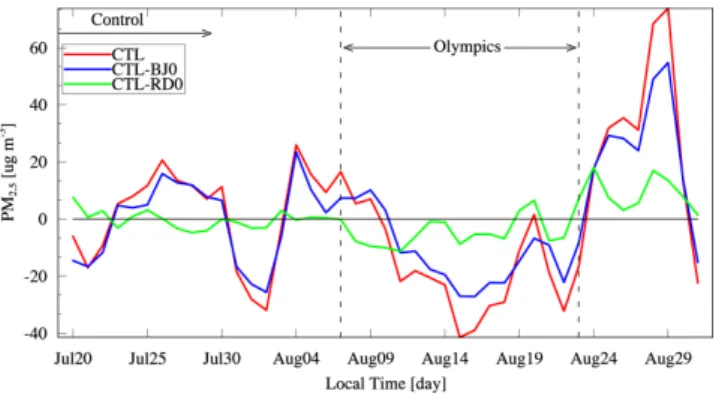
Two sensitivity simulations (CTL-BJ0 and CTL-RD0) are conducted to investigate the relative impact of emissions of Beijing and its surrounding regions on the air quality in Beijing. Figure 5 shows the daily mean and grid averaged anomalies of surface PM2.5 concentration from 20 July to
31 August (the emission control period prior to and during the Olympics) over Beijing from model simulations in the CTL, CTL-BJ0, and CTL-RD0 cases. Anomaly is calcu-lated by subtracting the mean PM2.5 concentration during
20 July–31 August from its daily values. Figure 5 shows that in the CTL-RD0 case with emissions in the regions out-side Beijing turned off, fluctuations of PM2.5concentration
become much smaller compared to those in the CTL and CTL-BJ0 cases. In comparison, PM2.5 concentration from
CTL and CTL-BJ0 cases has strong correlation (correlation coefficients are 0.98), indicating that pollutants transported from the regions surrounding Beijing dominate the fluctua-tions of PM2.5 concentration in Beijing. The anomalies of
CTL and CTL-BJ0 are almost the same with large positive value around 26 July and 4 August indicating that the trans-port from regions outside of Beijing is the main cause for the high PM2.5concentration during these periods. The
anoma-lies of PM2.5concentrations in the CTL-RD0 case with all
emissions outside Beijing turned off (the green line) change from positive to negative on 8 August, indicating the effect of enhanced emission controls in Beijing during the Olympics. From 8 to 24 August, the averaged anomalies in the CTL-BJ0 case are about−10.6 µg m−3, while the averaged anomalies
in the CTL-RD0 case are about−3.1 µg m−3. This indicates
that the transport of pollutants from regions outside Beijing has a larger impact on the daily variations of aerosol con-centration than the emission controls in Beijing during the Olympic period. The above results suggest that meteoro-logical conditions determine the daily fluctuations of aerosol concentration, although emission controls reduce the aver-aged aerosol concentrations by 30–50 % during the Olympic period.
Fig. 5.Time series of the anomaly of daily PM2.5surface concen-tration in CTL, CTL-BJ0 and CTL-RD0 case from 20 July to 31 August. Anomaly is calculated by subtracting the averaged surface PM2.5concentration during 20 July–31 August from its daily
val-ues.
Final reanalysis data at the lowest three layers over Beijing is shown in Fig. S2 of the Supplement. The same comparison as Fig. S2 but with a WRF simulation at a higher horizontal resolution (4 km) with cumulus parameterization turned off is shown in Fig. S3 of the Supplement. The variation of wind speed and direction from the CTL case is similar to that from the 4 km simulation. Therefore, the relatively coarser reso-lution (36 km) in the CTL case is not going to affect our re-sult in terms of the pollution transport surrounding Beijing. It’s noteworthy that 4 km simulation of precipitation rate be-comes worse, reflecting the precipitation bias from the mi-crophysics scheme (i.e. Lin scheme used in this study). The investigation of the sensitivity of precipitation rate to differ-ent microphysics schemes is beyond the scope of this paper.
We further compare model simulated hourly wind speed, wind direction, temperature, relative humidity, and daily pre-cipitation from both the CTL case and 4 km WRF simula-tion with observasimula-tions at seven other sites in Beijing for July and August 2008. Generally, model reproduces the tempo-ral variation of observations at different sites (see Fig. S5 in the Supplement). Wind speed from the 4 km WRF simula-tion agrees better with observasimula-tions than that from the CTL case by producing lower wind speed. The temporal variation of wind direction is also smaller in 4 km simulation. How-ever, temperature from the 4 km simulation is systematically higher (especially at daytime) than that from the CTL case and observations, along with its lower relative humidity. For precipitation, both CTL case and 4 km simulation can capture the main precipitation events at each site in July and August, but underestimate observed precipitation especially for 4 km simulation.
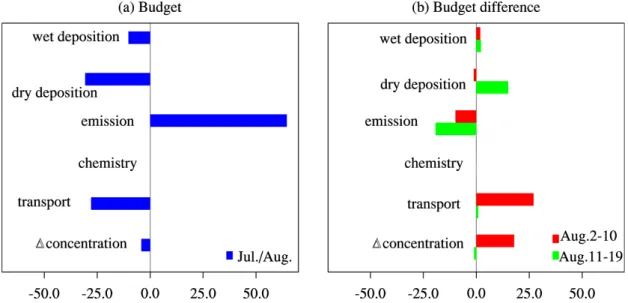
4.2.3 Budget analysis
In order to further understand the source of variations of aerosol concentrations during the Olympic period, the
bud-gets of BC from emission, chemistry, transport, and dry and wet deposition are calculated for the CTL case. BC is cho-sen since it has no chemical production/loss in the model, which makes it simple for the analysis of the relative con-tribution from the transport and emission. Figure 6 shows the July-August budgets for BC and budget differences be-tween the periods of 2–10 August and 11–19 August and the period of July-August. The positive value denotes increase to concentration and the negative value denotes decrease to concentration over Beijing. “1-concentration” equals to the net contributions of the five budget terms. Among the five budget terms (Fig. 6a), emission contribution is always pos-itive, contribution from wet and dry deposition are always negative and transport contribution depends on meteorolog-ical conditions. In Fig. 6a, for the budgets in the whole July-August period, the source term of BC is emission and the loss terms of BC are transport and dry and wet deposi-tion. 1-concentration is −4.2 ton day−1. Emission has the contribution of 64.5 ton day−1. The contribution of transport
is−27.9 ton day−1indicating that in July and August 2008, meteorological conditions are favorable for the decrease of air pollutants. The dry deposition loss is −30.7 ton day−1
and wet deposition loss is−10.3 ton day−1for BC.
In Fig. 6b, comparing with the BC budgets in July–August 2008, for the period of 2 to 10 August (red bars), the negative contribution of transport to BC concentration in Fig. 6a is reduced by 27.1 ton day−1 and the positive contribution of
emission is reduced by 9.8 ton day−1indicating the
unfavor-able meteorological conditions and effectiveness of emis-sion controls in this period. The negative contribution of dry deposition is slightly increased by 1.2 ton day−1 (more
negative) and the negative contribution of wet deposition slightly reduced by 1.9 ton day−1 (less negative) indicating
the contributions of these two terms in this period are sim-ilar to the average conditions in July and August. There-fore, the transport that is not favorable for ventilating the air pollutants during 2–10 August makes BC concentration increase by 17.9 ton day−1. For the period of 11–19
Au-gust (green bars), the positive contribution of emission in Fig. 6a is reduced by 19.2 ton day−1indicating the enhanced
emission controls during this period. The negative contri-bution of transport is only reduced by a very small amount (about 1.0 ton day−1, thus the transport loss is 26.9 ton day−1
for this period) indicating that meteorological conditions in this period are as favorable as the average conditions in July and August to ventilate the air pollutants in Beijing. As dry deposition is proportional to the concentrations and the BC concentration decrease significantly in this period, the neg-ative contribution of dry deposition in Fig. 6a is reduced by 15.1 ton day−1. The change of negative contribution of wet
deposition is also very small at about 2.2 ton day−1.
There-fore, during 11–19 August, under favorable meteorological conditions (26.9 ton day−1for transport loss), large decrease
in emission (19.2 ton day−1) is effective for the improvement
Fig. 6. (a)Budgets in July–August 2008 (blue) and(b)budget differences of the period 2–10 August (red) and 11–19 August (green) with July-August for BC over Beijing.1-concentration denotes variation of concentration. The positive value denotes increase to concentration and the negative value denotes decrease to concentration over Beijing. Unit: ton day−1.
there are emission controls during the July–August period (e.g. 35 % reduction after 20 July and 50 % reduction dur-ing the Olympics in Beijdur-ing), the emission reduction for the 11–19 August period compared to the no-control case can be larger. Even so, however, the magnitude of transport loss (26.9 ton day−1) is still comparable to that of emission
reduction.
From the above analysis, comparing with the average con-ditions in July and August in 2008, when meteorological conditions are not favorable (e.g. for the period of 2–10 Au-gust), BC concentration could still be high even though full-scale emission controls are enforced. On the other hand, when the meteorological conditions are favorable (for the pe-riod of 11–19 August), emission controls can be effective for decreasing the air pollutants in Beijing.
5 Summary and conclusions
To improving the air quality during the 2008 Beijing Olympic Games, emission control measures have been im-plemented by the City Government of Beijing. This provides a unique opportunity for examining the emission control pol-icy on air quality in megacities. By using the fully coupled meteorology-chemistry model (WRF-Chem), we conducted several numerical experiments: NO-CTL, CTL, CTL-BJ0, CTL-RD0, and NO-CTL07 for the period of July to Septem-ber in 2008 to investigate the factors contributing to the ob-served aerosol concentration reduction during the Olympic Games.
In general, the modeled results of PM2.5 and aerosol
species concentrations in the CTL case during the Olympic Games can reproduce the observations, providing the basis of the following sensitivity analysis. During the Olympic pe-riod from 8 to 24 August 2008, aerosol species and PM2.5
concentrations were significantly reduced compared to the concentrations in the other periods from June to August in 2008: at the CMA site, SO4, NH4, NH4, BC, and OC
de-creased by 35 %–50 %, and at T1, T2, T3, and T4 sites of the Beijing-Tianjin-Hebei Atmospheric Environment Moni-toring Network, PM2.5decreased by about 30 %–50 %. The
model simulations also show that the PM2.5, NH4, BC, and
OC concentrations decreased by about 30 % over Beijing due to emission controls. The reduction of NO3and SO4is about
40 % and 20 %, respectively.
Although the mean aerosol concentrations are lower dur-ing the Olympic period, there are still occasional high PM2.5
concentrations (above 150 µg m−3) during the emission
con-trol. The meteorological condition is found to be the cause for the daily fluctuations of aerosol concentrations. Southerly winds are always associated with high concentrations and northeasterly winds with low concentrations. Southerly and southwesterly winds and low precipitation around 26 July and 4–9 August are the reasons for the high concentrations before the Olympic Games, while northeasterly winds on 11– 20 August and precipitation around 10 August contribute to the low concentrations during the Olympic period. The sen-sitivity simulations showed that the pollutant transport from the regions surrounding Beijing determines the fluctuation of PM2.5concentrations. The emissions over the
concentrations than do the emissions over Beijing. Although emission controls result in a∼30 % reduction of particle con-centrations, the air pollutants surrounding Beijing along with the unfavorable meteorological conditions contribute to the occasional high concentrations during the emission control.
Furthermore, the budget analysis shows that the contribu-tion of emission, transport, and dry and wet deposicontribu-tion are 64.5,−27.9,−30.7, and−10.3 ton day−1respectively to the
BC burden, resulting in a reduction of−4.2 ton day−1in July
and August 2008. The budget difference between the period of 2–10 August and July–August shows that the ventilation effect of transport is weakened by 27.1 ton day−1, reflecting
that the unfavorable transport is the main reason for the high aerosol concentrations on 2–10 August. On the other side, the budget difference between the period of 11–19 August and July–August shows that the emission control with favor-able transport condition can effectively improve the air qual-ity, particularly for particle matter, over Beijing. This study suggests that the emission control on regional scale is neces-sary in order to improve the air quality over Beijing. Since aerosol concentrations in Beijing are to a large extent, in-fluenced by the surrounding areas when the southerly winds prevail with clear-sky conditions, it is critical to strength the emission control over the surrounding areas of Beijing (es-pecially in the South) under these meteorological conditions. We concluded that in addition to emission controls meteo-rological conditions (e.g. wind direction and precipitation) were also important in producing the low aerosol concentra-tions appearing during the Olympic period. Emission con-trols decreased the average concentrations of aerosol species, while meteorological conditions were response for the daily fluctuations of aerosol concentrations during the Olympic Games.
There are uncertainties with the emissions used in our model simulations. First, some emission control measures started before 20 July 2008 (M. Wang et al., 2009), and the actual dates of emission control are different from what officially reported. However, in this study we focus our anal-ysis on the period of August 2008 for the importance of me-teorological conditions. Since aerosol has a lifetime of a few days in the lower atmosphere, the uncertainties with the ac-tual dates of emission control will not change our conclu-sions. Second, there are uncertainties with the emission re-ductions in Beijing and in the provinces outside Beijing dur-ing the full-scale emission control period (i.e. after 20 July 2008). The model simulation in the CTL case has a positive bias during the Olympic period and for the period of July and August as indicated in Table 2 and Fig. 2, which may result from uncertainties in the emission estimations. How-ever, our analysis in Fig. 3 depends on the relative differ-ence of emissions used in the CTL and NO-CTL cases, rather than on the absolute emissions in each case (i.e. emission in the CTL case is estimated from that in the NO-CTL case). Likewise, analysis shown in Fig. 5 examines the anomaly of PM concentrations by subtracting the averaged concentration
from its daily values for different cases (CTL, CTL-BJ0 and CTL-RD0) rather than the daily values to show the effect of transport on daily variations of PM concentration in Beijing. For the analysis shown in Fig. 6 we compare the BC budget differences between different time periods. Thus, although the absolute values of aerosol concentrations from each sim-ulation can be impacted by the emission uncertainties, our conclusion regarding the role of meteorological conditions versus emission controls in determining the aerosol concen-trations during the Olympics will not change.
Supplementary material related to this article is available online at:
http://www.atmos-chem-phys.net/11/12437/2011/ acp-11-12437-2011-supplement.pdf.
Acknowledgements. X. Liu acknowledges the funding support
from the US Department of Energy (DOE), Office of Science, Scientific Discovery through Advanced Computing (SciDAC) Program M. Zhang was funded by the National Natural Science Foundation of China (No. 20937001) and the National Department Public Benefit Research Foundation (Ministry of Environmental Protection of China) (No. 201009001 and 201109002). The Pacific Northwest National Laboratory is operated for DOE by Battelle Memorial Institute under contract DE-AC06-76RLO 1830.
Edited by: T. Zhu
References
Ackermann, I. J., Hass, H., Memmesheimer, M., Ebel, A., Binkowski, F. S., and Shankar, U.: Modal aerosol dynamics model for Europe: Development and first applications, Atmos. Environ., 32, 2981–2999, 1998.
An, X., Zhu, T., Wang, Z., Li, C., and Wang, Y.: A modeling anal-ysis of a heavy air pollution episode occurred in Beijing, At-mos. Chem. Phys., 7, 3103–3114, doi:10.5194/acp-7-3103-2007, 2007.
Beijing Environmental Bulletin, 1994–2005, Beijing Municipal En-vironmental Protection Bureau, Beijing, http://www.bjepb.gov. cn/, last access: 11 November 2010.
Binkowski, F. S. and Shankar, U.: The regional particulate matter model, 1. mode desription and preliminary results, J. Geophys. Res., 100, 26191–26209, 1995.
Brown, J. F., Loveland, T. R., Merchant, J. W., Reed, B. C., and Ohlen, D. O.: Using multi-source data in global land-cover char-acterization: concepts, requirements, and methods, Photogram. Eng. Remote Sensing, 59, 977–987, 1993.
Cermak, J. and Knutti, R.: Beijing Olympics as an aerosol field experiment, Geophys. Res. Lett., 36, L10806, doi:10.1029/2009GL038572, 2009.
Chan, C. K. and Yao, X.: Air pollution in mega cities in China, Atmos. Environ., 42, 1–42, 2008.
of Aerosols and Trace Gases, J. Geophys. Res., 109, D20210, doi:10.1029/2004JD004571, 2004.
Fast, J. D, Gustafson Jr., W. I., Easter, R. C., Zaveri, R. A., Barnard, J. C., Chapman, E. G., and. Grell, G. A.: Evolution of ozone, particulates, and aerosol direct forcing in an urban area using a new fully-coupled meteorology, chemistry, and aerosol model, J. Geophys. Res., 111, D21305, doi:10.1029/2005JD006721, 2006. Ghan, S., Laulainen, N., Easter, R., Wagener, R., Nemesure, S., Chapman, E., Zhang, Y., and Leung, R.: Evaluation of aerosol di-rect radiative forcing in MIRAGE, J. Geophys. Res., 106, 5295– 5316, 2001.
Grell, G. A., Peckham, S. E., Schmitz, R., and McKeen, S. A., Frost, G., Skamarock, W. C., and Eder, B.: Fully coupled “online” chemistry within the WRF model, Atmos. Environ., 39, 6957– 6976, 2005.
Guenther, A., Karl, T., Harley, P., Wiedinmyer, C., Palmer, P. I., and Geron, C.: Estimates of global terrestrial isoprene emissions using MEGAN (Model of Emissions of Gases and Aerosols from Nature), Atmos. Chem. Phys., 6, 3181–3210, doi:10.5194/acp-6-3181-2006, 2006.
Gustafson, W. I., Chapman, E. G., Ghan, S. J., Easter, R. C., and Fast, J. D.: Impact on modeled cloud characteristics due to simplified treatment of uniform cloud condensation nu-clei during NEAQS 2004, Geophys. Res. Lett., 34, L19809, doi:10.1029/2007GL0300321, 2007.
Han, Z. W., Zhang, R. J., Wang, Q. G., Wang, W., Cao, J. J. and Xu, J.: Regional Modeling of Organic Aerosols over China in summertime, J. Geophys. Res., 113, D11202, doi:10.1029/2007JD009436, 2008.
Hsu, K., Gao, X., Sorooshian, S., and Gupta, H. V.: Precipitation es-timation from remotely sensed information using artificial neural networks., J. Appl. Meteorol., 36, 1176–1190, 1997.
Hsu, K., Gupta, H., Gao, X., and Sorooshian, S.: Estimation of physical variables from multi-channel remotely sensed imagery using a neural network: application to rainfall estimation., Water Resour. Res., 35, 1605–1618, 1999.
Kulmala, M., Laaksonen, A., and Pirjola, L.: Parameterizations for sulphuric acid/water nucleation rates, J. Geophys. Res., 103, 8301–8307, 1998.
Li, G., Zavala, M., Lei, W., Tsimpidi, A. P., Karydis, V. A., Pan-dis, S. N., Canagaratna, M. R., and Molina, L. T.: Simulations of organic aerosol concentrations in Mexico City using the WRF-CHEM model during the MCMA-2006/MILAGRO campaign, Atmos. Chem. Phys., 11, 3789–3809, doi:10.5194/acp-11-3789-2011, 2011.
Loveland, T. R., Merchant, J. W., Ohlen, D. O., and Brown, J. F.: Development of a land-cover characteristics database for the con-terminous US Photogram, Eng. Remote Sens., 57, 1453–1463. 1991.
McKeen, S. A., Wotawa, G., Parrish, D. D., Holloway, J. S., Buhr, M. P., Hubler, G., Fehsenfeld, F. C., and Meagher, J. F.: Ozone production from Canadian wildfires during June and July of 1995, J. Geophys. Res., 107, 4192, doi:10.1029/2001JD000697, 2002.
Randerson, J. T., Van der Werf, G. R., Giglio, L., Collatz, G. J., and Kasibhatla, P. S.: Global Fire Emissions Database, Ver-sion 2 (GFEDv2. 1), Available at: http://daac.ornl.gov/ from Oak Ridge National Laboratory Distributed Active Archive Center, Oak Ridge, Tennesse, USA, doi:10.3334/ORNLDAAC/849, last
access: 14 July 2010.
Schell, B., Ackermann, I. J., Hass, H., Binkowski, F. S., and Ebel, A.: Modeling the formation of secondary organic aerosol within a comprehensive air quality modeling system, J. Geophys. Res., 106, 28275–28293, 2001.
Shrivastava, M., Fast, J., Easter, R., Gustafson Jr., W. I., Zaveri, R. A., Jimenez, J. L., Saide, P., and Hodzic, A.: Modeling organic aerosols in a megacity: comparison of simple and complex rep-resentations of the volatility basis set approach, Atmos. Chem. Phys., 11, 6639–6662, doi:10.5194/acp-11-6639-2011, 2011. Sorooshian, S., Hsu, K., Gao, X., Gupta, H., Imam, B., and
Braith-waite, D.: Evaluation of PERSIANN system satellite-based es-timates of tropical rainfall., B. Am. Meteorol. Soc., 81, 2035– 2046, 2000.
Stauffer, D. R. and Seaman, N. L.: Use of four-dimensional data as-similation in a limited-area mesoscale model, Part I: Experiments with synoptic-scale data, Mon. Weather Rev., 118, 1250–1277, 1990.
Stauffer, D. R., Seaman, N. L., and Binkowski, F. S.: Use of four-dimensional data assimilation in a limited-area mesoscale model, Part II: Effects of data assimilation within the planetary boundary layer, Mon. Weather Rev., 119, 734–754, 1991.
Stauffer, D. R. and Seaman, N. L.: Multi-scale four-dimensional data assimilation, J. Appl. Meteorol., 33, 416–434, 1994. Stockwell, W. R., Middleton, P., Chang, J. S., and Tang, X.:
The second generation regional acid deposition model chemical mechanism for regional air quality modeling, J. Geophys. Res., 95, 16343–16367, 1990.
Streets, D. G., Fu, J. H. S., Jang, C. J., Hao, J. M., He, K. B., Tang, X. Y., Zhang, Y. H., Wang, Z. F., Li, Z. P., Zhang, Q., Wang, L. T., Wang, B. Y., and Yu, C.: Air quality during the 2008 Beijing Olympic Games, Atmos. Environ., 41, 480–492, 2007.
Tang, Y., Carmichael, G. R., Seinfeld, J. H., Dabdub, D., Weber, R. J., Huebert, B., Clarke, A. D., Guazzotti, S. A., Sodeman, D. A., Prather, K. A., Uno, I., Woo, J.-H., Streets, D. G., Quinn, P. K., Johnson, J. E., Song, C.-H., Sandu, A., Talbot, R. W., and Dibb, J. E.: Three-dimensional simulations of inorganic aerosol distributions in east Asia during spring 2001, J. Geophys. Res., 109, D19S23, doi:10.1029/2003JD004201, 2004.
Wang, M., Zhu, T., Zheng, J., Zhang, R. Y., Zhang, S. Q., Xie, X. X., Han, Y. Q., and Li, Y.: Use of a mobile laboratory to evaluate changes in on-road air pollutants during the Beijing 2008 Summer Olympics, Atmos. Chem. Phys., 9, 8247–8263, doi:10.5194/acp-9-8247-2009, 2009.
Wang, S., Zhao, M., Xing, J., Wu, Y., Zhou, Y., Lei, Y., He, K., Fu, L., and Hao, J.: Quantifying the air pollutants emission re-duction during the 2008 Olympic games in Beijing, Environ. Sci. Technol., 44, 2490–2496, 2010.
Wang, T. and Xie, S. D.: Assessment of traffic-related air pollution in the urban streets before and during the 2008 Beijing Olympic Games traffic control period, Atmos. Environ., 43, 5682–5690, 2009.
Wang, T., Nie, W., Gao, J., Xue, L. K., Gao, X. M., Wang, X. F., Qiu, J., Poon, C. N., Meinardi, S., Blake, D., Wang, S. L., Ding, A. J., Chai, F. H., Zhang, Q. Z., and Wang, W. X.: Air quality during the 2008 Beijing Olympics: secondary pollu-tants and regional impact, Atmos. Chem. Phys., 10, 7603–7615, doi:10.5194/acp-10-7603-2010, 2010.
D., and Nielsen, C. P.: Ozone air quality during the 2008 Beijing Olympics: effectiveness of emission restrictions, Atmos. Chem. Phys., 9, 5237–5251, doi:10.5194/acp-9-5237-2009, 2009. Wesley, M. L.: Parameterization of surface resistance to gaseous
dry deposition in regional numerical models, Atmos. Environ., 16, 1293–1304, 1989.
Whitby, E. R., McMurry, P. H., Shankar, U., and Binkowski, F. S.: Modal aerosol dynamics modeling, Rep. 600/3-91/020, At-mospheric Research and Exposure Assessment Laboratory, US Environmental Protection Agency, Research Triangle Park, NC, 1991 (Available as NTIS PB91-1617291AS from National Tech-nical Information Service, Springfield, VA, USA), 1991. Xin, J. Y., Wang, Y. S., Tang, G. Q., Wang, L. L., Sun, Y., Wang, Y.
H., Hu, B., Song, T., Ji, D. S., Wang, W. F., Li, L., and Liu, G. R.: Variability and reduction of atmospheric pollutants in Bei-jing and its surrounding area during the BeiBei-jing 2008 Olympic Games, Chinese Sci. Bull., 55, 1937–1944, doi:10.1007/s11434-010-3216-2, 2010.
Yang, Q., Wang, Y., Zhao, C., Liu, Z., Gustafson, Jr., W. I., and Shao M.: NOx emission reduction and its effects on ozone during the 2008 Olympic Games, Environ. Sci. Technol., 45, 6404–6410, 2011.
Zaveri, R. A. and Peters, L. K.: A new lumped structure photochem-ical mechanism for large-scale applications, J. Geophys. Res., 104, 30387–30415, 1999.
Zaveri, R. A., Easter, R. C., Fast, J. D., and Peters, L. K.: Model for simulating aerosol interactions and chemistry (MOSAIC), J. Geophys. Res., 113, D13204, doi:10.1029/2007JD008792, 2008.
Zhang, Q., Streets, D. G., Carmichael, G. R., He, K. B., Huo, H., Kannari, A., Klimont, Z., Park, I. S., Reddy, S., Fu, J. S., Chen, D., Duan, L., Lei, Y., Wang, L. T., and Yao, Z. L.: Asian emis-sions in 2006 for the NASA INTEX-B mission, Atmos. Chem. Phys., 9, 5131–5153, doi:10.5194/acp-9-5131-2009, 2009. Zhang, X. Y., Wang, Y. Q., Lin, W. L., Zhang, Y. M., Zhang, X.
C., Gong, S., Zhao, P., Yang, Y. Q., Wang, J. Z., and Hou, Q.: Changes of Atmospheric Composition and Optical Prop-erties Over BEIJING-2008 Olympic Monitoring Campaign, B. Am. Meteorol. Soc., 90, 1633–1651, 2009.
Zhao, C., Liu, X., Leung, L. R., Johnson, B., McFarlane, S. A., Gustafson Jr., W. I., Fast, J. D., and Easter, R.: The spatial distribution of mineral dust and its shortwave radiative forcing over North Africa: modeling sensitivities to dust emissions and aerosol size treatments, Atmos. Chem. Phys., 10, 8821–8838, doi:10.5194/acp-10-8821-2010, 2010a.
Zhao, C., Wang, Y., Yang, Q., Fu, R., and Choi, Y.: Im-pact of East Asia summer monsoon on the air quality over China: The view from space, J. Geophys. Res., 115, D09301, doi:10.1029/2009JD012745, 2010b.