Gulf of Guinea maritime criminality analysis with
Geographic Information Systems
Miguel Bessa Pacheco 1)
1)
Portuguese Navy, CINAV, Portugal, bessa.pacheco@marinha.pt
Abstract
Over the past few years, the Gulf of Guin-ea has been incrGuin-easing its world share of oil production. At the same time, armed robbery and piracy attacks have become a permanent threat to the maritime agents in the region. Oil theft, crew kidnapping for ransom and robbery of crew and ship val-uables are the most common outcomes of successful attacks.
To better understand the phenomena, a political, economic, social and environ-mental analysis of the region was per-formed, and a geographic information sys-tem was developed to provide a deeper analysis and understanding of the correla-tion between geographical and scope fac-tors of this criminal activity, considering the period from January 2012 to May 2015. The system integrates the land and maritime boundaries, population, religion, oil/gas platforms, oil/gas fields, reported attacks on ships and spatial analysis re-sults.
Several factors are pointed out as major contributors to today’s maritime criminality in the Gulf of Guinea. The geographic in-formation system analytical outputs pro-vide a view of the geographical concentra-tion, trends and perceive a slow decreas-ing of this threat until 2014 and a slow growing tendency in 2015.
Keywords
Gulf of Guinea; maritime piracy; maritime assaults; shipping; oil.
1. Introduction
production, and fishing is also not to be neglected. Over the last few years, the shipping and fishing activities have been under piracy (outbound the territorial sea) and armed robbery assaults (inbound the territorial sea limits). To deal with these illicit activities several national, interna-tional and multinainterna-tional strategies have been designed. To better understand the maritime criminality problem of the GoG, and decide on the best lines of action to take, a geospatial analysis of the area and its maritime criminality was performed us-ing a COTS geographic information sys-tem (ArcGIS). The piracy and armed rob-bery assault data was acquired from the monthly IMO reports on acts of piracy and armed robbery against ships, from Janu-ary 2012 until December 2014 and from the US Navy Office of Naval Intelligence worldwide threat to shipping reports from January to May 2015.
2. The Golf of Guinea
The GoG area shipping (Halpern & Wal-bridge, 2008) follows two major routes. One goes down to the Cape of Good Hope and around Africa (outbound) and the other follows the coast of the GoG countries and dissipates as it reaches Ni-geria (fig. 1). The GoG maritime routes to Europe and the USA are of great value for there are no chokepoints between their coasts, and sailing distances are shorter than the ones to the Middle East great oil producing countries. These factors are major in transportation costs and security attractiveness.
Fig. 1: GoG shipping, 2005
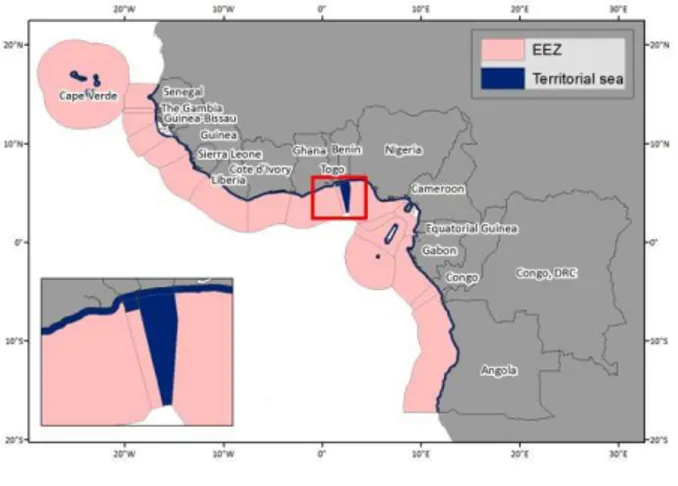
The maritime illicit activities are to be dealt differently according to littoral countries sovereignty and jurisdiction areas. All GoG countries have signed the United Nations Convention on the Law of the Sea (UNCLOS). Although UNCLOS sets a maximum width of the territorial sea to 12 nautical miles from the base lines, Togo still claims a width of 30 NM and Benin a width of 200 NM (fig. 2). This fact has im-plications in the classification of maritime illicit activities such as piracy or armed robbery assaults, and in the way an event can be dealt with by local authorities and the international community.
Fig. 2: GoG maritime boundaries
The Exclusive Economic Zone (EEZ) of the GoG litoral countries sums up 3.3 mil-lion km2, first ranking Cape Verde, Angola and Equatorial Guinea. The territorial seas add about 208 thousand km2 and the con-tinental shelf claims, so far presented to the United Nations, represent an area of about 1.1 million km2.
In 2014 the GoG littoral countries sum up about 287 million people (fig. 3), repre-senting about one third of the African’s continent. Nigeria is at the same time the most populated and the country with the highest population density (CIESIN & CIAT, 2005).
Fig. 3: Population (millions)
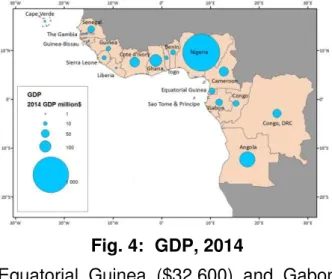
Fig. 4: GDP, 2014
Equatorial Guinea ($32.600) and Gabon ($21.600) had the highest GDP per capita, between 2,5 and 4 times higher than An-gola ($8.200), the third in rank (fig. 5).
Fig. 5: GDP per capita, 2014
In 2013 Africa produced 10.1% of world’s oil and 6.0% of gas (British Petroleum, 2014). Africa’s proven reserves of oil and gas represent 7.7% and 7.6% of the world’s, most of them located in the GoG area. In 2013 Nigeria produced a daily average of 2322 thousand barrels of oil and Angola reached 1801 (fig. 6). These figures and the fact that there are no major international conflicts between GoG coun-tries have led several analysts to flag a growing strategic role of the GoG in the energy market. Also, the grade of GoG oil is very good. Crude oil is evaluated ac-cording to its sweetness (sulphur content) and weight (API gravity degree). The best
Fig. 6: Oil fields & production, 2013
For oil and gas production, in 2009, there were 801 fixed platforms off the GoG countries (Saldanha Bay IDZ, 2012, p. 15), and it is expected that this number is higher today. Pipelines and floating units are used to store and transport crude and gas from the platforms to terminals and to shore. In 2014, 37 of the world’s 151 oil floating production storage and offloading units were operating in the GoG. To dig new wells, the offshore oil and gas indus-tries use rigs. In 2014, the GoG rig fleet was of about 100 vessels and platforms, which had a utilization rate of 65%. Alto-gether it is a very significant and expen-sive infrastructure.
Fig. 7: Resource Governance Index
International, regional and local criminal activities are intrinsically related with the incapacity of states to make and/or en-force their laws. This was clear when So-malia government collapsed and maritime piracy went off the roof. The fragile states index is published annually and it ranks the world countries regarding their col-lapse probability (Fund for Peace, 2014). This index takes into account, among oth-er indicators, the demographic pressure, group grievance, uneven development, poverty and economic decline, human rights and security apparatus. The political reality in the GoG is generally evaluated as fragile due to regime challenge or in-stability, generalized poverty and high lev-els of criminality. In the GoG countries there are five that figure within the 20th most fragile states in the world. Democrat-ic RepublDemocrat-ic of Congo is the 4th most frag-ile, being included in a set of countries in very high alert. Guinea, Ivory Coast and Guinea-Bissau are in the high alert list and Nigeria, in the 17th place, is in the simple alert list (fig. 8).
Among the GoG countries, Angola is the one with the most uneven development, followed by Equatorial Guinea and Nige-ria. Guinea, Guinea-Bissau and Sierra Leone are the ones with more poverty. Democratic Republic of Congo, Equatorial Guinea and Nigeria are the worst evaluat-ed considering human rights.
Despite its richness in natural resources, the GoG area is experiencing maritime safety and security problems that might affect future investments in the oil and gas industries. Security in the GoG is a major problem, namely due to ship robbery, kid-napping or host taking and oil theft.
The number of piracy and armed robbery attacks in the GoG, from 2012 until May 2015, reached a total of 172 (fig. 9), in many of which hostages were taken. In 2013, the GoG piracy and armed robbery assaults estimation of primary economic costs to stakeholders were between $565 million and $681 million (Oceans Beyond Piracy, 2014, p. 55). These numbers still differ significantly from the 2013 Somali piracy economic costs that were estimated between $3.000 million and $3.200 million (ibidem, p. 7).
Fig. 9: Piracy and assaults 2012-2015(May)
re-servative.
The GoG is an area of open waters in the Atlantic, and attacks to ships are mainly made inside or near the countries’ territo-rial seas, when they are anchored or slow moving. In Somalia, attacked ships and their whole crew are taken for ransom and can be held hostage for very long periods of time, sometimes years. In the GoG, criminals select high value crew members (i.e. the captain and the head of engineer-ing) and take them to land for ransom. Ships are not held for more than a few days, just enough to transfer the oil into a ship enrolled in the black market or to a store site ashore. Attackers in the GoG are more violent than in the Indian Ocean. They also are very well armed and have some capability to directly fight law en-forcement authorities.
When analyzing the maritime illicit activi-ties in the GoG there are two major ena-blers: the limited authority capabilities of coastal states and the resources govern-ance. The first includes limited coopera-tion between states, limited maritime situa-tional awareness and limited navies and coast guards capabilities. The latter in-cludes all the factors that affect fragile states, corruption and low natural re-sources revenue transparency.
The problems that arise from the maritime illicit activities can be grouped in five dif-ferent areas: illegal, unreported and un-regulated fishing that damages local economies and contribute to the degrada-tion of natural resources sustainability; environment degradation by toxic waste dumping; trafficking & smuggling of drugs, arms and people; damaging of the oil & gas infrastructures for oil theft, specially pipelines (which is also a source of major inland and near shore oil spills); and ship-ping that is affected by robbery, crew kid-napping for ransom, oil theft and oil smug-gling that is sold to the oil black market.
Data mining and analyzing the GoG piracy and armed robbery assault database one can verify that attacks are more frequent from February to September (fig. 10).
Fig. 10: Attacks “years by months”
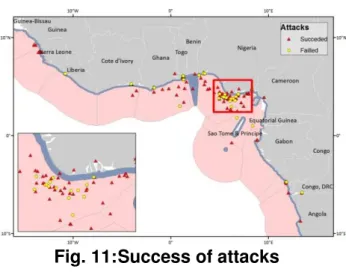
Considering the maritime areas where the 172 attacks occurred, 88 took place inside the countries’ territorial or interior waters (33 in 2012, 23 in 2013, 23 in 2014 and 9 in 2015) and 84 outside. Of all these at-tacks, 65 were attempts that for some rea-son had no consequences on ships, their crew or cargo (fig. 11).
Fig. 11: Success of attacks
(fig. 12), 7 of which occurred in Nigerian waters.
Fig. 12: Attacks outcome
The number of attacks to ships that had major consequences has fallen down in the period between 2012 and 2014 (18, 12, 9), but by May 2015 the number of these occurrences was already 7, reflect-ing a tendency to increase.
Of all GoG maritime attacks to ships, about 46% (79) occurred in the Nigerian EEZ, territorial sea or interior waters. Most of these attacks occurred in the Lagos anchorage site or between the two major oil and gas exploring areas off the Bayelsa state (fig. 13).
Fig. 13: Attacks in Nigerian waters
In order to better understand the geo-graphic tendencies of the attacks, a spa-tial density analysis was performed for each year and also the whole period from 2012 until May 2015.
Figure 14 shows the density analysis of the attacks in 2012. The highest concen-tration is in the Togo anchorage off Lomé, followed by the Nigerian waters offshore Bayelsa and the Ivory Coast anchorage of Abidjan, the Nigerian anchorage of Lagos
Noir.
Fig. 14: Density of attacks in 2012
In 2013 the highest density of attacks oc-curred on the waters off the Nigerian Bayelsa state, followed by the Togo chorage of Lomé and the Nigerian an-chorage of Lagos (fig. 15). The figures at Abidjan and Point Noir anchorage sites didn’t change much from the previous year.
Fig. 15: Density of attacks in 2013
centration of attacks took place at the La-gos anchorage site and the waters off the Akwa Ibom Nigerian state, near the border with the Cameroon, where there is a very large number of oil and gas industry infra-structures (fig. 17).
Fig. 17: Density of attacks in 2015
Considering the period from 2012 to May 2015, the density of attacks analysis shows that the hotspots of the GoG piracy and armed robbery assaults are four an-chorage sites (Abidjan, Lomé, Lagos and Point Noir) and the waters off the Nigerian state of Bayelsa (fig. 18).
Fig. 18: Density of attacks 2012-2015
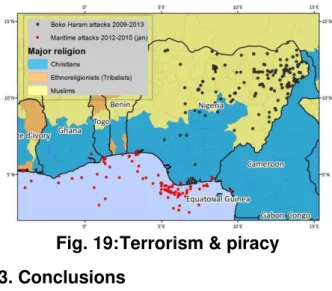
One of the major concerns related to oil theft is that at some point in time the Is-lamic group Boko Haram, which terrorizes the north of Nigeria, could be able to get control of some parcels of land in the south and finance its activities with oil. This would lead to a different scale of in-security in the region and the establish-ment of links with other terrorist
organiza-GoG (Muslims, Christians and Tribalists). The map shows a very big geospatial gap between the locations where the two dif-ferent types of attacks occur. Also it is vis-ible that, at this time, Boko Haram has a particular focus on Nigerian states of Mus-lim religion and that the Christian states represent a geospatial break in its territo-rial activities.
Fig. 19: Terrorism & piracy
3. Conclusions
The strategic value of the GoG is growing due to its richness in natural resources, especially oil and gas. For the last few years, the shipping activity in the GoG has been targeted by piracy and armed rob-bery assaults.
maritime criminality.
The illicit maritime activity in the GoG has the main objectives to steal the cargo from tankers, to sell it in the oil black market, and to kidnap high valued crew members for ransom.
The geospatial gap between Boko Haram attacks and maritime attacks is very big. This gap suggests that, for the time being, there is no connection between the two phenomena.
The use of a geographic information sys-tem for the GoG maritime criminality anal-ysis was very useful to discover both tem-poral and spatial patterns and tendencies of the attacks.
References
Allen, Fidelis (2012). “Oil and Security in the Gulf of Guinea: Reflections on the External and Domestic Linkages”, Journal of Sustainable Development, vol. 5, n. 4, April 2012.
British Petroleum (2014). "BP statistical review of world energy".
Center for International Earth Science In-formation Network - CIESIN - Columbia University and Centro Internacional de Agricultura Tropical - CIAT (2005). “Gridded Population of the World,
Ver-sion 3 (GPWv3): Population Density Grid”. Palisades, NY, NASA Socioeco-nomic Data and Applications Center (SEDAC).
Fund for Peace (2014). "Fragile States Index 2014".
Halpern, B., Walbridge, S. et al, (2008). "A Global Map of Human Impact on Ma-rine Ecosystems ", Science, vol. 319, n. 5865, pp. 948-952.
International Maritime Organization (2012-2015). “IMO reports on acts of piracy and armed robbery against ships”, nº 182 to nº 220.
Oceans Beyon Piracy (2014). “The state of maritime piracy 2013”, [S.l.], Oceans Beyond Piracy.
Office of Naval Intelligence (2015). “Worldwide Threat to Shipping (WTS) reports”, January to May 2015.
Revenue Watch Institute (2013). "The 2013 Resource Governance Index. A Measure of Transparency and Ac-countability in the Oil, Gas and Mining Sector“.
Saldanha Bay IDZ (2012). Environmental Impact Assessment For The Proposed Oil & Gas Off-Shore Supply Base And Marine Repair Complex At The