International Journal of Advanced Robotic Systems
Development, Test and Validation
of a Mechatronic Device for
Spasticity Quantification
Regular Paper
João F. Ferreira
1, Vitor Moreira
2, Carlos S. Lima
1,
Filomena Soares
1, José Machado
3,*and Celina P. Leão
41 Industrial Electronics Department, ALGORITMI Research Centre, University of Minho, Guimarães, Portugal 2 Hospital of Braga, Braga, Portugal
3 Mechanical Engineering Department, CT2M Research Centre, University of Minho, Guimarães, Portugal 4 Production and Systems Department, ALGORITMI Research Centre, University of Minho, Guimarães, Portugal * Corresponding author E-mail: [email protected]
Received 3 Aug 2012; Accepted 5 Mar 2013
DOI: 10.5772/56334
© 2013 Ferreira et al.; licensee InTech. This is an open access article distributed under the terms of the Creative Commons Attribution License (http://creativecommons.org/licenses/by/3.0), which permits unrestricted use, distribution, and reproduction in any medium, provided the original work is properly cited.
Abstract Spasticity is a common pathological
phenomenon in clinical practices, frequently expressed as a stroke, multiple sclerosis or cerebral palsy. The accurate quantification of spasticity allows early action to prevent the potentially irreversible consequences.
The aim of this work is to develop and implement a mechatronic device for the accurate quantification of spasticity, which is able to differentiate spasticity from other motor disorders. The proposed method is based on the quantification of the tonic stretch reflex threshold (TSRT) for the assessment of the range of motion of the limb affected by spasticity. In order to validate the developed device, experimental trials have been conducted, considering the flexor muscle of the elbow joint. The developed device was tested, first in a laboratory environment with healthy subjects and secondly, in a clinical environment with the collaboration of patients with spasticity. The evaluations in th clinical environment were performed on three different days in order to evaluate the reproducibility of the obtained
results. The experimental trials confirm the sensibility, reproducibility and reliability of spasticity quantification based on the TSRT method. This project has been developed in cooperation with the Hospital of Braga and Fisimaia rehabilitation clinic, both in Portugal.
Keywords Mechatronic Device, Spasticity Quantification,
Improvement of Quality of Life, Human Safety
1. Introduction
Spasticity is a disabling motor disorder integrated in the Upper Motor Neuron (UMN) resulting from neurological diseases. The pathophysiology of spasticity leads to the appearance of functional loss, postural disorders and pain [1, 2]. This pathology occurs with lesions in the first motoneuron of the pyramidal tract. In spasticity, the principal mechanism that determines the appearance of clinical manifestations is the deregulation/hyper
excitability of the stretch reflex (SR), causing to muscle hyperton, reflexive hyperactivity and muscle spasms [1, 3‐6]. The definition of spasticity aims to differentiate this pathophysiology from other motor disorders, associated with changes in the intrinsic properties of muscles and joint tissue [7]. The definition proposed by Lance [8] persists today as one of the most frequently cited and consensually accepted by the scientific community [6]. According to this definition, “spasticity is a motor disorder characterized by a velocity‐dependent increase in tonic stretch reflexes (muscle tonus) with exaggerated tendon jerk, resulting in hyper excitability of the stretch reflexes, as one of the components of the upper motor neuron syndrome” [9]. It is therefore a motor disorder and potentially disabling motor function that is already commonly characterised by paresis and decreased muscle strength [3, 6]. The clinical manifestation of spasticity seriously affects the quality of life, social participation and professional performance of patients [1, 3 , 9].
Spasticity actually has a remarkable social and economic impact affecting approximately 1.9% of the world population [9, 19, 11]. Medical science currently has several alternative therapies, medical and surgical treatments, which allow the effective control of spasticity. There is, however, a recognition that the treatment commonly used is costly both for the patient and for the health system [9]. A growing clinical interest in the detection and quantification of spasticity, which derives from the necessity to early act allowing controlling the success of the treatment and the associated costs, has been observed [9].
2. Methods for spasticity quantification
Therapeutic efficacy is highly variable between patients, for different therapeutic approaches [13, 14]. The quantification of spasticity can be useful for the selection of an adequate therapeutic technique that suitable for each patient and for measuring the effectiveness of the clinical decisions implemented. These tools enable the standardization of procedures and data collection, contributing to a broader understanding among clinicians and with clear benefits in providing a standardization of health care to the patients [12, 13, 15]. However, the methods for spasticity quantification currently available do not provide a satisfactory level of sensitivity, specificity and reproducibility [12]. An undeniable interest in the development of a device that optimizes these requirements is therefore recognized [15].
The methods for spasticity quantification have been the subject of extensive studies, carried out by the scientific community. Despite steady progress, there is still no consensual method suitable for the quantification of this disorder [15] .
The identification of the ideal variable that will be assessed and quantified is crucial for the development of an appropriate method. This variable must reflect the physiological mechanism of motor control in healthy subjects, in order to identify the perturbations in this mechanism that contribute to the appearance of motor impairments [15, 16]. On the other hand, the approach for the quantification must reflect the clinical pattern of spasticity, providing the specificity that characterizes and distinguishes spasticity from other disorders [15].
Currently, the modified Ashworth scale remains the reference method for clinical assessment of spasticity [10]. This scale assesses the resistance to passive muscle stretch as the expression of muscle tone. There are several limitations to the use of this scale, especially high inter‐ observer variability due to the subjective rating, limiting reproducibility [6]. In addition to this clinical assessment, there are other instrumental methods:
mechatronic devices, based on the assessment of muscle stiffness, for the evaluation of involuntary resistance to passive muscle stretch as a quantitative expression of the muscle tone
devices based on the evaluation of the velocity dependence of the stretch reflex, such as the method of the pendulum of Wartenberg, for the identification of muscle activity [15, 16, 17, 18].
However, these methods only have an experimental application, due to the complexity of implementation, failing to assess the properties of spasticity and lacking validation in different muscle groups [6, 15].
3. Velocity dependent approach
relation to the joint configuration within a body frame of references in a 2D orthogonal plane (Figure 1) [19].
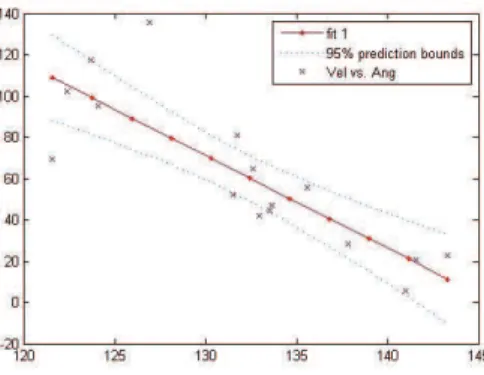
Figure 1. 2D orthogonal plane according to the body frame of references Example of the TSRT estimation; calculation of the regression line through the regression line of the DSRT that intersects the X axis at the value of 145° and presents a r2 =0.7075.
Figure 1 presents the estimated values of TSRT and Dynamic SRT (DSRT). DSRT corresponds to the SRT values determined by moving the limb at different velocities. The TSRT corresponds to an SRT value at 0m/s. When this threshold coincides with the biomechanical range (maximum flexion of the limb θ‐, maximum extension of the limb θ+) the individual has no freedom of movement in the limb. The regression line of the DSRT values separates the angle joint configuration in which the target muscle is spastic. The right side of this line corresponds to the biomechanical range at which the muscle presents a spastic resistance to motion; the left side relates to the biomechanical range without spastic resistance to motion [19]. In Figure 1 it can be seen that the angle joint position corresponding to TSRT (145°) lies within the biomechanical range of the limb, indicating that this patient has limitations of their movements from this amplitude. The regression line, originating from the TSRT, establishes the limit related to the velocity of the muscle stretch from which a spastic resistance to movement originates. In this example, it can be observed that the patient has restrictions of movements from 145° (from rest) to approximately 120°.
For each trial a prediction interval of 95% is considered (Figure 2) for the distribution of the results. The DSRTs that do not belong to the considered prediction interval are considered “false detections” and are classified as “technical errors” that occurred as consequences of artefacts associated with the system.
Following this method, the level of spasticity is higher for lower TSRT values, indicating a lower freedom of limb movements. On the other hand, a higher value of TSRT indicates a superior freedom of motion, corresponding to a lower level of spasticity [10].
Figure 2 Data distribution of the DSRT in comparison with linear regression, with 4 DSRT outside the considered range.
In the case of healthy individuals, both the regression line and the TSRT do not coincide with the biomechanical range, providing full freedom of movement [19]. However, the results of previous studies indicate that it is possible to evoke involuntary muscle resistance in healthy individuals, promoting passive muscle stretch from approximately 500°/s [20].
In summary, the quantification of spasticity is based on the physiological process, according to the definition proposed by Lance, taking into account the physiological mechanism of motor control in healthy subjects and registering the possible changes in these mechanisms [10, 19, 21].
4. Experimental set‐up
The proposed method considers spasticity evaluation based on the velocity dependence of the stretch reflex. The methodology identifies the DSRT at different velocities for subsequent estimation of the TSRT value. To implement this approach a portable device was designed and developed [22, 23, 24].
The muscle activity, corresponding to an SR, is acquired by using surface Electromyography (sEMG) sensors (Kendall). In this approach, passive surface Ag/AgCL electrodes are used together with a conductive gel to reduce signal noise by ensuring better contact between the electrode and the skin. The signal muscle when measured using surface electrodes has amplitude to 5mV. The frequency range of the EMG signal for the correct analysis is limited to between 20Hz and 500Hz, since frequencies below 20Hz tend to fluctuate and be unstable.
The electrodes have a bipolar configuration, enabling a high rate of common mode rejection and easily eliminating/reducing signal noise. They should be placed at a 20mm distance from each other.
Acquired Signals Range sEMG 20 Hz – 500 Hz Angle joint trajectory 0 ° –180 °
Angular velocity 0 °/s – 500°/s Range of movement 30 ° – 180 °
Table 1. Acquired signals and respective range
The raw signals are detected, amplified and sampled with
an analogue to digital converser (ADC), after filtering
with an anti‐aliasing filter. The detection algorithm is
implemented using LabVIEW Software from National
Instrument. The developed software includes a user
interface and the sEMG and kinematic signal processing
algorithms. The user interface provides the real‐time
display and the storage of sEMG, angle joint position and
the velocity of movement signals. The implemented
algorithm for signal processing provides the
identification of SR activation during the process of
muscle stretch. This identification is performed by an
algorithm that identifies the time muscle activation in the
raw sEMG signal during limb extension indicated by the
kinematic signal (angle joint position in function of time).
The angle joint position, at which SR is identified, is
correlated with the movement velocity to estimate the
DSRT values. The DSRT distribution is placed in a 2D
orthogonal graphic with the angle in the horizontal axis
versus angular velocity in the vertical axis. The regression
line is then computed and the TSRT value is estimated
(assumed at the point where the regression line intersects
the horizontal axis, corresponding to a stretch velocity
equal to zero[10, 19]). In this analysis the angle is
considered as the dependent variable and the angular
velocity as the independent variable.
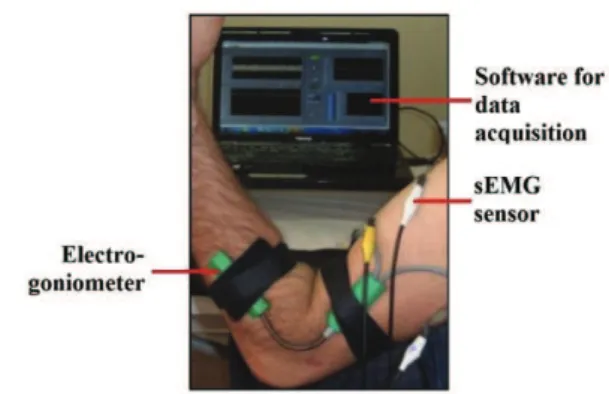
Figure 3 presents a simplified diagram of the device and
Figure 4 shows the developed experimental setup.
Figure 3. Simplified diagram of the device.
Figure 4. Experimental setup.
4.1 Experimental procedure
The experimental procedure (Figure 4) consists of
promoting a manual passive muscle stretch and moving
the limb, at different velocities in order to consider the
velocity dependence of the SRT. The velocity of the
stretch is visually controlled by the evaluator at the
velocity indicator present in the user interface.
The electrogoniometer placed in line with the joint axis of
the limb records the trajectory (angle joint position, in
degrees) and the angular velocity of the movement
(degrees per second). The velocity of the movement
derives from the digital signal recorded by the
electrogoniometer. Simultaneously, the muscle activity is
recorded by sEMG, with surface sensors placed at the
muscle surface, in order to observe the presence of an SR
[10, 19]. The velocity of the muscle stretch at which an SR
response is evoked defines each SRT. The SR is
characterized by a sustained increase in muscle activity
that corresponds to the beginning of a reflective activity
(Figure 5). The presence of muscle activations
(characteristics of an SR) are detected in the EMG signal
recorded by the algorithm specifically developed for this
purpose [25] and not detailed in this paper. It analyses
the sEMG power in signal segments and takes the
minimum value obtained out of all segments, estimating
the noise power. SNR is estimated by subtracting the
noise power from the power of the maximum value
obtained from all segments. In severe spasticity muscle
activations are not governed by zero mean Gaussian
processes. Tri‐modal distributions can be determined,
where the strongest is a zero mean with power higher
than the noise power and the other two are almost
Gaussian distributions (one centred at positive values and the other at negative values, approximately symmetric).
The approach followed in this paper disconnects the first
and second thresholds of the classical double threshold
protocol. Instead of computing the first threshold based
on the required false alarm probability, the first threshold
is computed on the basis of the estimated SNR, which is
optimal, according to simulation tests on different SNRs.
muscle dynamics regarding false positives from very short artefacts and muscle activation slicing by false negative detections. The proposed algorithm improves muscle activation detection in moderate to severe spastic conditions in more than 23% of our current database.
In each experimental assessment the DSRT values were determined, the regression line was computed and the TSRT value was determined. The assessments where less than six DSRTs were computed were considered unsatisfactory and were discarded. For all the other tests, the regression line and the coefficient of determination (r2) were determined. The value of r2 is used to measure the quality and reliability of each regression line [26]. In accordance to previous works, in this application the value of r2 was considered significant when it was higher or equal to 0.2, enabling the assessment, insignificant when less or equal to 0.1, disabling the assessment [10] and medium significant when comprised between 0.1 and 0.2, revealing a low reliability of the assessment.
Figure 5. SR response, recorded in the biceps. Signal
corresponding to the limb trajectory, in a), velocity of stretch, in b), and EMG, in c) [10].
Correlation analysis was applied to verify whether the values of the two variables (velocity and angle) were associated. A prediction interval of 95% was considered in order to evaluate the correlation between the samples and consider the possibility of a false DSRT [27]. The DSRTs plotted outside the prediction bands are considered to be false DSRTs, probably originating from artefacts in the signals or technical errors during the tests. The coefficient of determination and the prediction interval were used to evaluate the reliability of each assessment. If the coefficient of determination and the number of DSRT values outside the prediction band are unsatisfactory, the assessment should be repeated.
The variability of the TSRT value observed between assessments was evaluated and interpreted according with the analysis of variance (ANOVA) [28].
4.2 Target Group
The developed device was tested in clinical environments, evaluating the biceps braquial (elbow flexor), due to the high freedom of the limb movements.
30° was considered to be the maximum flexion of the elbow and 180° to be the full extension of the elbow [29].
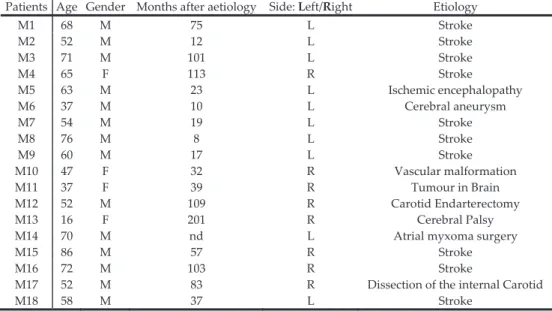
To participate in this study, patients were recruited (Table 2) from two Portuguese institutions, one public and one private.
The patients were selected taking into account the following considerations: spasticity symptoms in the flexor muscle in at least one of the elbows (if spasticity was present in both limbs, the limb with most severe symptoms was selected), absence of effect of any drugs (it can influence the experimental results), absence of cognitive impairment, manifesting clear inability to collaborate and absence of pain in the elbow. After a period of reflection, each patient signed the term of Informed Consent, in accordance to the code of ethics prevailing in Portugal [30].
Each patient was assessed in three different sessions, separated by two to five days in the same daily period (morning or afternoon). In each assessment, each patient performed two to three assessments, in order to consider the variability shown by the clinical symptoms of spasticity and to safeguard against technical errors, in accordance to the conclusions of previous studies [31].
4.3 Experimental protocol
The patient was sitting on a chair and all instrumentation was placed according to the instrumental protocol. With one hand the evaluator stabilized the elbow of the patient and with the other stabilized the forearm. At the beginning of each evaluation the initial position of the passive movement (θ‐) was defined as the maximum flexion allowed by the limb without contact between the limb segments and the final position of the passive movement (θ+) was defined as the maximum extent allowed by the joint. Each passive movement was promoted from the initial position (θ‐) to the final position (θ+). In each evaluation 30 passive muscle stretches were promoted, which were divided into: ten stretches at low velocity (0°/s to 200°/s), ten stretches at moderate velocity (200°/s to 400°/s) and ten stretches at fast velocity (above 400° /s).
4.4 Instrumental protocol
The electrogoniometer was fixed to the limb to be assessed, with its axis of rotation in concordance with the axis of rotation of the limb. One of the arms of the electrogoniometer was aligned and fixed with Velcro and adhesive tape to the patient´s forearm the other one was aligned and fixed to the patient´s arm (Figure 4).
Patients Age Gender Months after aetiology Side: Left/Right Etiology
M1 68 M 75 L Stroke
M2 52 M 12 L Stroke
M3 71 M 101 L Stroke
M4 65 F 113 R Stroke
M5 63 M 23 L Ischemic encephalopathy
M6 37 M 10 L Cerebral aneurysm
M7 54 M 19 L Stroke
M8 76 M 8 L Stroke
M9 60 M 17 L Stroke
M10 47 F 32 R Vascular malformation
M11 37 F 39 R Tumour in Brain
M12 52 M 109 R Carotid Endarterectomy
M13 16 F 201 R Cerebral Palsy
M14 70 M nd L Atrial myxoma surgery
M15 86 M 57 R Stroke
M16 72 M 103 R Stroke
M17 52 M 83 R Dissection of the internal Carotid
M18 58 M 37 L Stroke
Table 2. Data of selected patients
P
at
ie
n
ts
Evaluation 1 Evaluation 2 Evaluation 3
N ° D S R T T S R T S lo p e r 2 r >9 5% N ° D S R T T S R T S lo p e r
2 r
>9 5% N ° D S R T T S R T S lo p e r
2 r
>9
5%
M1 8 157 ‐7.93 0.37 0.61 1 15 175 ‐1.78 0.32 0.57* 3 9 156 ‐12.17 0.74 0.88** 2
M2 3 nd nd nd nd 8 185 ‐7.22 0.36 0.60 1 5 nd nd nd nd
M3 10 157 ‐5.28 0.40 0.63* 3 11 151 ‐6.20 0.65 0.81** 4 11 156 ‐5.35 0.48 0.69* 5
M4 9 147 ‐8.74 0.37 0.60 2 19 184 ‐5.23 0.38 0.62** 10 20 181 ‐6.93 0.52 0.72** 10
M5 8 180 ‐1.87 0.20 0.45 1 16 170 ‐5.16 0.32 0.56* 6 5 nd nd nd nd
M6 7 187 ‐3.92 0.87 0.93** 1 9 147 ‐8.74 0.37 0.60 2 7 231 ‐0.85 0.19 0.43 1
M7 12 191 ‐1.83 0.38 0.62* 5 8 174 ‐6.53 0.21 0.46 1 8 196 ‐5.38 0.41 0.64 1
M8 8 213 ‐1.21 0.48 0.69 0 10 165 ‐6.33 0.75 0.86* 3 6 157 ‐8.07 0.84 0.92* 0
M9 12 168 ‐3.23 0.30 0.55* 2 7 145 ‐8.23 0.76 0.87* 0 14 161 ‐3.78 0.71 0.84** 2
M10 13 191 ‐5.01 0.32 0.56* 2 6 184 ‐1.58 0.46 0.68 0 8 194 ‐2.16 0.21 0.46 1
M11 14 211 ‐1.55 0.33 0.58* 2 13 233 ‐0.71 0.20 0.45 3 13 180 ‐2.62 0.49 0.70** 3
M12 19 251 ‐0.54 0.20 0.45 10 18 230 ‐0.62 0.21 0.46* 4 9 152 ‐2.03 0.19 0.44 1
M13 10 176 ‐3.20 0.58 0.76* 3 13 157 ‐5.12 0.27 0.52 5 17 181 ‐2.97 0.41 0.64* 2
M14 10 258 ‐0.47 0.27 0.52 3 9 316 ‐0.68 0.02 0.16 3 11 220 ‐1.64 0.18 0.43 2
M15 15 150 ‐4.72 0.57 0.76** 4 17 177 ‐2.19 0.18 0.42 6 8 192 ‐6.95 0.51 0.71* 2
M16 2 nd nd nd nd 22 183 ‐3.90 0.45 0.67** 8 26 207 ‐3.42 0.38 0.62** 16
M17 10 143 ‐4.49 0.19 0.44 1 24 123 ‐11.55 0.75 0.87** 12 39 145 ‐4.60 0.53 0.73** 24
M18 7 218 ‐2.66 0.50 0.71 2 13 215 ‐2.40 0.11 0.32 6 7 215 ‐2.89 0.70 0.83* 1
* correlation is statistically significant at 0.05
** correlation is statistically significant at 0.01
Table 3. Obtained results for each patient in three evaluation sessions (“nd” indicates that the evaluation could not be performed due to
number of DSRT<6).
The pair of electrodes was placed in a region of the muscle
between the motor point and a region of the tendon
junction in the muscle and the reference electrode was
placed in the antagonist muscle [32, 33]. The instruments
were kept in the same position for each evaluation, in order
to guaranty reproducibility between assessments.
5. Results and discussion
Table 3 presents the results obtained in the tests performed with 18 patients. As expected, SR was observed in all the patients in proportion to the velocity of stretch. It was clear
that by increasing the velocity of muscle stretch, the SR is evoked in a short muscle length. This behaviour is clear evidence of the dependence of velocity of the SR.
The results demonstrate that there were evoked SRs
within the range of joint movements with stretch
velocities below 500°/s, indicating the presence of
spasticity in the studied muscle.
patient M5 in the third session and patient M16 in the
first session. In these sessions the number of DSRTs
obtained was less than six.
In the assessments where it was possible compute the
regression line, the coefficients of determination have
satisfactory values, between r2=0.20 and r2=0.92. An
exception is made to patients M12, M14, M15, M17 and
M18 in some sessions, where they presented coefficients
of determination of medium significance. In the second
assessment patient M14 presented an insignificant
coefficient of determination. Notice that for most of the
values of the correlation coefficients, the relationship is
significant (values marked with * and ** for 0.05 and 0.01
levels of significance, respectively).
It is important to note that, for some patients, variability
was observed between the TSRT values estimated in the
three sessions. This variability may be explained by the
difference in the coefficients of determination, changes in
the excitability of the Upper Motor Neuron (UMN) and
due to technical errors. For example, in the case of patient
M6 a medium coefficient of determination can be
observed in the third session, r2=0.19 and a significant
coefficient is also present in the second session, r2=0.37,
opposed to a very significant value in the first session,
r2=0.87. Despite the variability observed between
assessments, the analysis of variance ANOVA (Table 4)
shows that the differences obtained for the three
evaluations are not statistically significant (F(2,47) = 0.069,
p = .934).
The decrease in the number of DSRT observed is an
indicator of a lower excitability of the UMN [10]. For
example, in the case of patient M15 a significant
coefficient of determination can be observed in the first
and third sessions. In this case, the variability of the TSRT
can be explained by the wide discrepancy in the number
of DSRTs observed (15, 17 and 8). The lower excitability
of the UMN in the third assessment session,
demonstrated by the lower number of DSRT, justifies the
higher value of TSRT. Several factors may contribute to
changes in the excitability of the UMN, including:
emotional stress, discomfort or anxiety associated to the
participation in the trials, consumption of stimulants (for
example caffeine or tobacco) and the etiology of
spasticity[10, 34].
Beyond these factors, previous studies have
demonstrated that promoting repetitive passive muscle
stretch can lead to a situation of “muscle
accommodation” causing a decrease in the response of
the SR, especially in individuals with lower levels of
spasticity [33]. A low coefficient of determination may be
associated with the determination of a false DSRT, in
particular to the presence of artefacts, technical errors
and/or muscle activation originating in stretching
shortened muscles [33, 34].
The proposed approach allows the range of joint motion
at which a minimum muscle stretch velocity (near zero)
results in a spastic resistance to movement to be
determined. The graph shows the spatial aspect of the
motor control impairment. The slope of the regression
line also expresses the excitability of the UMN, for
example, for a given angle joint a slope of ‐1 suggests that
the SR was evoked at a lower velocity of muscle stretch.
Thus, a higher slope may indicate more excitability of the
UMN.
In order to validate the device in the clinical community,
tests will be performed with the device and the results
compared to clinician evaluation using traditional
methods.
6. Conclusions
Spasticity is a motor disorder of high incidence in clinical
practices. Due to its social and economic impact, there is a
growing interest in the development of a medical system
for its correct diagnosis and quantification. Spasticity is a
complex phenomenon, is difficult to quantify and may
present variability in results between evaluations.
The implemented system allows the identification of the
range of movement affected by spasticity. This
methodology operates based on the physiological process
that characterizes spasticity, according to the definition
proposed by Lance, avoiding the influence of other motor
disorders.
The obtained results, herein presented, validate the
estimation of TSRT based on the velocity dependence of
the SRT. Higher values of TSRT indicate a lower degree
of spasticity and vice‐versa. The analysis of variance
(ANOVA) confirmed the reproducibility of the results in
three different assessments. The experimental results
validate the quantification of spasticity based on the
TSRT. It was observed that the slope of the regression line
is a relevant parameter to the expression of the
excitability of the SR. This parameter allows the
differentiation of different patients with a similar TSRT.
squaresSum of df Average of
squares F Significance
Between
groups 178.777 2 89.39 0.069 0.934
Into groups 61096.583 47 1299.93
Total 61275.360 49
Table 4. Results of the analysis of variance ANOVA.
Throughout the tests, the system presented a sensitive,
reliable and objective quantification, independent of the
The average of three TSRT values, obtained in three
different assessments to quantify the degree of spasticity
is proposed. This average value allows the effect of
variability in the results associated to spasticity to be
minimized. The manual passive muscle stretch was
revealed to be efficient, permitting adjustment of the
velocity of stretch from the SR response observed in each
patient, therefore minimizing risks.
The experimental tests validated the developed prototype
as a medical and/or therapeutic system for supporting
decisions differentiating spasticity from other motor
disorder. In this work the system was applied in the
elbow joint, however it can be applied to the knee and
ankle joint.
7. Acknowledgements
The authors are grateful to the Portuguese Foundation for
Science and Technology (FCT) for funding through the
R&D project PTDC/CPE‐PEC/122329/2010.
8. References
[1] Wissel, J. et al., Management of Spasticity Associated
Pain with Botulinum Toxin A. Journal of Pain and
Symptom Management, 2000. 20(1): p. 44‐49.
[2] Moore, P. and M. Naumann, Handbook of botulinum
toxin treatment. 2003: Blackwell Science.
[3] Priori, A., F. Cogiamanian and S. Mrakic‐Sposta,
Pathophysiology of spasticity. Neurological Sciences,
2006. 27(0): p. s307‐s309.
[4] Brown, P., Pathophysiology of spasticity. J Neurol
Neurosurg Psychiatry, 1994. 57(7): p. 773‐7.
[5] Nielsen, J.B., C. Crone and H. Hultborn, The spinal
pathophysiology of spasticity‐from a basic science
point of view. Acta Physiol (Oxf), 2007. 189(2): p. 171‐
80.
[6] Le Cavorzin, P. et al., Évaluation de la mesure de la
spasticité par le pendulum test. Evaluation of
pendulum testing of spasticity. Annales de
Réadaptation et de Médecine Physique, 2002. 45(9):
p. 510‐516.
[7] Sindou, M. et al., Selective peripheral neurotomy
(SPN) for spasticity in childhood. Childʹs Nervous
System, 2007. 23(9): p. 957‐970.
[8] Lance, J.W., Spasticity: Disorder of Motor Control,
Chicago: Year Book Medical.
[9] Mahoney, J.S. et al., Spasticity Experience Domains in
Persons With Spinal Cord Injury. Archives of
Physical Medicine and Rehabilitation, 2007. 88(3): p.
287‐294.
[10] Calota, A., A.G. Feldman and M.F. Levin, Spasticity
measurement based on tonic stretch reflex threshold
in stroke using a portable device. Clinical
neurophysiology: official journal of the International
Federation of Clinical Neurophysiology, 2008.
119(10): p. 2329‐2337.
[11] Cohen, J.E., Human Population: The Next Half
Century. Science, 2003. 302(5648): p. 1172‐1175.
[12] Simpson, D.M. et al., Botulinum toxin type A in the
treatment of upper extremity spasticity. Neurology,
1996. 46(5): p. 1306.
[13] Lee, K.C. et al., The Ashworth Scale: A Reliable and
Reproducible Method of Measuring Spasticity.
Neurorehabilitation and Neural Repair, 1989. 3(4): p.
205‐209.
[14] Oderson. R.K.G.H., Applications of Botulunum
Toxin in Physical Medicine and Rehabilitation, 2003.
[15] Levin, M.F., On the nature and measurement of
spasticity. Clinical Neurophysiology, 2005. 116(8): p.
1754‐1755.
[16] Haas, B.M. and J.L. Crow, Towards a Clinical
Measurement of Spasticity? Physiotherapy, 1995.
81(8): p. 474‐479.
[17] Lee, H.M. et al., Validation of portable muscle tone
measurement device for quantifying velocity‐
dependent properties in elbow spasticity. J
Electromyogr Kinesiol, 2004. 14(5): p. 577‐89.
[18] Le Cavorzin, P. et al., A computed model of the
pendulum test of the leg for routine assessment of
spasticity in man. ITBM‐RBM, 2001. 22(3): p. 170‐177.
[19] Jobin, A. and M.F. Levin, Regulation of stretch reflex
threshold in elbow flexors in children with cerebral
palsy: a new measure of spasticity. Developmental
Medicine & Child Neurology, 2000. 42(8): p. 531‐540.
[20] Pisano, F. et al., Quantitative measures of spasticity
in post‐stroke patients. Clin Neurophysiol, 2000.
111(6): p. 1015‐22.
[21] Musampa, N., P. Mathieu and M. Levin, Relationship
between stretch reflex thresholds and voluntary arm
muscle activation in patients with spasticity.
Experimental Brain Research, 2007. 181(4): p. 579‐593.
[22] Ferreira, J., Mechatronic device for spasticity
quantification, Master Thesis on Biomedical
Engineering, 2011, University of Minho, Braga.
[23] Ferreira, J., P. Rodrigues, F.O. Soares and J. Machado,
An approach for spasticity quantification based on
the stretch reflex threshold, Romanian Review
Precision Mechanics, Optics and Mecatronics, 2010.
37: p.51‐56.
[24] Ferreira, J., V. Moreira, J. Machado and F. Soares,
Biomedical device for spasticity quantification based
on the velocity dependence of the Stretch Reflex
threshold, IEEE Symposium on Emerging
Technologies and Factory Automation, ETFA, 2011.
[25] Ferreira, J., V. Moreira, F. Soares, J. Machado, P.R.
Gomes and C. Lima, An Adapted Double Threshold
Protocol for Spastic Muscles, submitted for
publication in IEEE EMBC´13, 3‐7 July 2013, Osaka,
Japan.
[26] Motulsky, H. and A. Christopoulos, Fitting models to
biological data using linear and nonlinear regression:
a practical guide to curve fitting. 2004: Oxford
[27] Karris, S.T., Mathematics for business, science, and
technology: with MATLAB and spreadsheet
applications. 2 ed. 2003, California: Orchard
Publications.
[28] Starsky, A.J. et al., Reliability of Biomechanical
Spasticity Measurements at the Elbow of People
Poststroke. Archives of Physical Medicine and
Rehabilitation, 2005. 86(8): p. 1648‐1654.
[29] Black, K., Business Statistics: Contemporary Decision
Making. 2009: John Wiley & Sons.
[30] Ferreira João, Soares Filomena, Machado José,
Curado M., Ethical Aspects in the Design of Medical
Devices, TmSi 2010, 6th International Conference on
Technology and Medical Sciences, Porto, Portugal, 21
– 23 October, 2010.
[31] Park, B.K. et al., Anatomic Motor Point Localization
of the Biceps Brachii and Brachialis Muscles. J Korean
Med Sci, 2007. 22(3): p. 459‐462.
[32] Mesin, L., R. Merletti and A. Rainoldi, Surface EMG:
The issue of electrode location. Journal of
Electromyography and Kinesiology, 2009. 19(5): p.
719‐726.
[33] Vodovnik, L., B. Bowman and T. Bajd, Dynamics of
spastic knee joint. Medical and Biological
Engineering and Computing, 1984. 22(1): p. 63‐69.
[34] P. Wongphaet, K.C., S. Suarchawaratana, T.
Dangprasert and W. Wongphaet, Precise Localisation
of Motor Branching and Motor Points: A Cadaveric
Study. J Med Assoc Thai, 2005. 88(12).