, v.60, n.2, p.359-370, Abr./Jun. 2003
WHEAT CULTIVAR TOLERANCE TO BORON
DEFICIENCY AND TOXICITY IN NUTRIENT SOLUTION
Ângela Maria Cangiani Furlani1,4*; Cristiane Pierrotte Carvalho1; José Guilherme de Freitas2,4; Marcelo Fontanetti Verdial3
1
IAC - Centro de Pesquisa e Desenvolvimento de Solos e Recursos Ambientais, C.P. 28 - 13001-970 - Campinas, SP - Brasil.
2
IAC - Centro de Análise e Pesquisa Tecnológica do Agronegócio de Grãos e Fibras. 3
USP/ESALQ - Depto. de Produção Vegetal, C.P 9 - 13418-900 - Piracicaba, SP - Brasil. 4
CNPq scholar.
*Corresponding author <afurlani@iac.sp.gov.br>
ABSTRACT: Field symptoms of open spikelets in wheat were observed in specific cultivars and supposedly related to low B soils and differential B requirement among cultivars. This study aimed to evaluate the response of four wheat (Triticum aestivum L.) cultivars, IAC 24, IAC 60, IAC 287 and IAC 289, to increasing B concentrations in nutrient solution. The experiment was set up in a randomized complete block design, with four replicates and five B concentrations (0.0, 0.05, 0.2, 0.8 and 2.0 mg L-1
), during 1997/1998, in a greenhouse. Plants were grown to maturity and evaluated for plant height, spike number and length, open spikelet number, grains per spike, plant parts dry matter, B, P, K, Ca and Mg leaf concentrations and total nutrient contents. The visual symptoms of B deficiency consisted of open spikelets, distorted spikes without grains. ‘IAC 60’ and ‘IAC 287’ had higher B efficiency, with the highest grain yields in lower B concentrations. The ‘IAC 287’ and ‘IAC 24’ were more tolerant to the highest B concentrations. ‘IAC 24’ required more B for grain production as compared to the other cultivars. The critical leaf B concentration for deficiency was 25 mg kg-1
of dry matter tissue for all cultivars, and for toxicity were: 44 to 45 mg kg-1
for ‘IAC 60’ and ‘IAC 289’; 228 and 318 mg kg-1
for ‘IAC 24’ and ‘IAC 287’, respectively. Except for the highest B level in the nutrient solution, the leaf P, K, Ca and Mg concentrations and whole plant contents were in an adequate range in the plants and did not vary among cultivars.
Key words: Triticum aestivum L., boron nutrition, leaf B concentrations, critical limits
TOLERÂNCIA DE CULTIVARES DE TRIGO À DEFICIÊNCIA E
TOXICIDADE DO BORO EM SOLUÇÃO NUTRITIVA
RESUMO: Sintomas esporádicos de espiguetas sem grãos observados em campos de trigo apenas para determinadas cultivares induziram pesquisadores à hipótese de uma possível relação destes sintomas com baixo teor de boro (B) disponível no solo e com diferenças entre as cultivares na exigência a B. Este experimento foi realizado com o objetivo de estudar as cultivares IAC 24, IAC 60, IAC 287 e IAC 289, em concentrações de B em solução nutritiva. O ensaio foi instalado em casa de vegetação, durante 1997/1998, em blocos casualizados com quatro repetições e cinco concentrações de boro (0,00; 0,05; 0,20; 0,80 e 2,00 mg L-1). As plantas cresceram até a maturidade e foram avaliadas quanto à altura, número e comprimento das espigas, número de espiguetas sem grãos, grãos por espiga, matéria seca das partes das plantas, teores de B, P, K, Ca e Mg nas folhas e conteúdos totais desses nutrientes. Os sintomas visuais de deficiência de B consistiram de espiguetas abertas, retorcidas e sem grãos. ‘IAC 60’ e ‘IAC 287’ mostraram-se mais eficientes, apresentando as maiores produções de grãos nas concentrações mais baixas de B. ‘IAC 287’ e ‘IAC 24’ foram mais tolerantes às concentrações mais altas de B, sendo ‘IAC 24’ bem mais exigente. O teor limite de B nas folhas, para deficiência, foi de 25 mg kg-1
para todas as cultivares e, para toxicidade, foram de: 44 a 45 mg kg-1
para ‘IAC 60’ e ‘IAC 289’; e 228 e 318 mg kg-1
para ‘IAC 24’ e ‘IAC 287’, respectivamente. Exceto para o tratamento com a mais alta concentração de B, os teores e conteúdos de P, Ca, K e Mg encontrados nas plantas estavam dentro da normalidade e não variaram com os tratamentos.
Palavras-chave: Triticum aestivum, cultivares de trigo, nutrição com B, teores de B nas folhas, limites críticos
INTRODUCTION
Boron is essential for cell division and elonga-tion in meristematic tissues and floral organs, for flower
, v.60, n.2, p.359-370, Abr./Jun. 2003
whole plant and organ level, Dell & Huang (1997) state that deficiency of B inhibits root elongation through lim-iting cell enlargement and cell division in the growing zone of root tips. In the case of severe B deficiency, the root cap disappears and root growth ceases, leading to the death of root tips. This implies in an increase on the shoot: root ratio, which may enhance the susceptibility of plants to nutrient and water stresses. Vascular bundles are weakly developed in B-deficient roots, and early ef-fects on their initiation and differentiation is poorly un-derstood. Leaf expansion is also inhibited by low B and indirectly photosynthesis is decreased, though exact roles of B in photosynthesis remain to be explored. In the field, sexual reproduction is often more affected by low B and significant grain yield reductions may occur without visual symptoms expressed during vegetative growth. In flowers, low B reduces male fertility prima-rily by impairing microsporogenesis and pollen tube growth. Post-fertilization effects include impaired em-bryogenesis, resulting in seed abortion or the formation of incomplete or damaged embryos, and malformed fruits.
However, there is a great diversity of effects of low B on reproductive growth among species and within the same species in different sites and seasons. Weather conditions are reported as important factors for xylem B delivery into flowers, because of their impact on transpi-ration and internal sap transport from root to shoot.
Besides the diversity of effects, differential de-grees of B deficiency have been reported for many plant species and cultivars, evidencing different plant abilities in tolerating low B concentrations or in translocating B to the growing tissues (Gupta, 1993; Rerkasem & Jamjod, 1997b; Brown & Shelp, 1997; Furlani & Castro, 2001; Furlani & Machado, 2002). On the other hand, differen-tial tolerance to B toxicity among species and genotypes has also been reported in the literature, showing great di-versity of values for the critical tissue B concentration above which toxicity symptoms appear. Differences as large as ten times have been found in leaf B concentra-tions when comparing susceptible and tolerant species (Dechen, 1988a;b; Dechen et al., 1999; Gupta, 1993; Furlani & Castro, 2001).
An important aspect observed within a species is the narrow adequate range usually found between criti-cal levels for B deficiency and B toxicity, and that ad-equate range is not the same for different species and cul-tivars. Therefore, the evaluation of genotypes for their critical B levels are relevant for crop production. Another aspect is the difficulty to compare literature data, as B concentrations are expressed for different plant parts (leaf, shoot or whole plant B content) and/or for different plant ages. For wheat, higher functional B requirement for re-productive development than that for vegetative growth is indicated in tissue B concentrations in deficient plants.
Male sterility and grain set failure have been associated with 7-8 mg B kg-1DM in the anthers and 5-6 mg B kg-1 DM in the carpel, while no evidence of B deficiency has been seen in wheat leaves containing 4 mg B kg-1DM or in the spike vegetative parts (straw) with 2 mg B kg-1
DM (Rerkasem & Jamjod 1997a,b).
There is a general concept that wheat species would be more efficient the uptake and use of B in com-parison to other species, and more tolerant to low B soil concentration. However, this concept needs to be re-evaluated, since B efficiency or tolerance of wheat spe-cies depend strongly on the considered cultivars. Some wheat genotypes are more inefficient and susceptible to low B than many dicotyledones (Rerkasem & Jamjod, 1997b). Reports demonstrating differences among wheat cultivars in relation to B uptake and use efficiency un-der low-B soil conditions, have been found in papers from China, India, Nepal, Thailand (Rerkasem & Jamjod, 1997a,b) and Brazil (Silva et al., 1980; Silva & Andrade, 1983; Freitas et al., 1995; 1996). These countries have large extensions of low-B soils.
Boron deficiency impairs grain set in wheat, re-sulting in increased number of open spikelets and de-creased number of grains per spike. The difference in the number of open spikelets under normal and B-deficient soil conditions, has been used to compare wheat geno-types for B efficiency.
Boron inefficient and efficient wheat genotypes have not been distinguishable by the B concentration in their flag leaf (Rerkasem & Loneragan, 1994) or whole spike. The ranking of wheat genotypes for their responses to low external B has not shown any correlation with their ranking in reproductive responses. It appears that in re-lating B requirement with efficiency, it may sometimes be necessary to consider vegetative and reproductive ef-ficiency separately (Rerkasem et al., 1993).
, v.60, n.2, p.359-370, Abr./Jun. 2003
method for hybridization can be used, in which B defi-ciency is the fertility selective medium and male sterile female parents and fertile male parents are provided by genotypic variation in the response to low B (Rerkasem & Jamjod, 1997a; b).
Freitas et al. (1995; 1996) observed similar B de-ficiency symptoms in wheat grown in sandy soil, in the field, in two different counties of the State of São Paulo. Four wheat cultivars (‘IAC 24’, ‘IAC 60’, ‘IAC 227’ e ‘IAC 287’) presented different responses to three levels of boron applied to the soil (0; 0,55 e 1,10 kg ha-1). Open spikelets and empty spikes were observed in low B lev-els, similarly to the male sterile character observed in wheat material genetically obtained for this trait. ‘IAC 60’ and ‘IAC 227’ grain yields fit quadratic equations in re-sponse to the B applied to the soil; IAC 24’, had a linear response and ‘IAC 287’, apparently did not respond.
This paper reports results of experiments study-ing differences among four wheat cultivars (‘IAC 24’, ‘IAC 60’, ‘IAC 287’ e ‘IAC 289’) grown to maturity in nutrient solutions with four B concentrations, in regard as to grain and dry matter yield, B uptake and utilization, and possible B interactions with other nutrients, mainly Ca.
MATERIAL AND METHODS
The experiment was carried out in a greenhouse, at Campinas, SP, Brazil, during 1997-1998. Treatments were four wheat cultivars (‘IAC 24’, ‘IAC 60’, ‘IAC 287’ e ‘IAC 289’) grown under five rates of B in nutrient so-lution, with four replicates arranged in randomized com-plete block design. The B rates in the main plots consisted of: 0.0; 0.05; 0.2; 0.8 and 2.0 mg B L-1 of nutrient solu-tion (or 0.0; 4.6; 18.5; 74.0; and 185 µmol B L-1), added as boric acid. Three of these cultivars were chosen be-cause of previous observations of differentiated symptoms of open spikelets among them, related to low B under field conditions (Freitas et al., 1995; 1996). Those B con-centrations were chosen based on the recommendation for the full strength, normal nutrient solution.
Seeds were previously treated for disinfestation and break of dormency by immersion in a 10% Na-hy-pochlorite during 1 minute and rinsing with deionized water. Seeds were arranged in moist paper towels, rolled, and put in a becker partially filled with deionized water and then, taken to a refrigerator at 4oC for 24 hours and germinated in a germination chamber at 25°C. Two days later, three uniform-sized seedlings were transplanted to nutrient solution in 2.7 L containers, suspended from lids holding the plants. After three days, two seedlings were left in each container.
The base nutrient solution used was that proposed by Furlani & Furlani (1988), using p.a. reagents and deionized water. Nutrients were added in the following
concentrations (mg L-1): Ca = 151; K = 150.4; Mg = 18.9; N-NO3 = 138; N-NH4 = 20; S = 56.2; Cl = 2.5; P = 8.0; Fe = 3.7; Mn = 0.5; Zn = 0.15; Cu = 0.04 e Mo = 0.08. The solution pH was adjusted to 5.0 and monitored each other day. The aeration and the level of water were main-tained constant. The nutrient solution was changed each 20 days.
Temperature and humidity were registered daily and the following maximum and minimum averages were recorded, respectively: 25.7±3.1°C and 16.3±1.9°C, and 84.1± 10.1% and 37.5±13.1%. The maximum and minimum temperatures for optimum growth and devel-opment of the spring wheat range on 28 and 10°C. Above 28°C wheat plants (C3 type) present higher pho-torespiration rates than photosynthesis, and below 10 °C, drastic reduction in the root nutrient uptake rates (Evans et al., 1976).
Visual symptoms of B deficiency and toxicity were graded and plants were given scores: (0) = no open spikelets; (5) = all spikelets open, no grains. Harvest was made at stage 11 of Large (1954), when grains were solid, 112 days after emergence. Plants were evaluated for plant height; number of spikes; number of open spikelets; and number of grains per spike. Plants were rinsed in destilled and desionized water, blotted dry and separated into leaves, roots, stalks and spikes (straw and grain). After that, plants were dried in a forced air oven at 70°C until constant dry mass, for dry matter deter-mination, and grinding in a Whiley grinder. Plant part samples were digested in an oven at 450°C and analysed for boron, phosphorus, potassium, calcium and magne-sium contents. Boron was analysed by the Azomethin-A method; potassium by flame emission photometry; and the other nutrients by ICP-OES spectrometry. Data was submitted to analyses of variance and means were compared using the Tukey test and multiple regression analysis at P = 0.05.
RESULTS AND DISCUSSION
There were large differences in the variables evaluated between treatments with and without B in the nutrient solution, for all wheat cultivars (Tables 1 to 6, Figure 1). Plant height did not vary much in relation to increasing B concentrations, but there were differences among cultivars for this trait, which may be considered a genetic attribute of the plant: ‘IAC 287’ had the high-est values for plant height, followed by ‘IAC 60’, ‘IAC 24’ and ‘IAC 289’.
, v.60, n.2, p.359-370, Abr./Jun. 2003
*Significant at P < 0.05; ** Significant at P < 0.01; ns – non- significant; CV = coefficient of variation; F regr (B) = F-test for polinomial regression for boron rates, L = linear; and Q = quadratic; F (cult) = F test for cultivars; F(BvsCult) = interaction (B rates vs cultivars).
(1)Means followed by the same letters, in the column, do not differ by Tukey test (P = 0.05). (2)No grain yield obtained in the no-added B treatment.
Table 1- Plant height, number of open spikelets and number of grains per spike in four wheat cultivars grown in nutrient solution treated with five boron concentrations. Harvest at maturity, at 112 days of age.
Figure 1- a) Total dry matter yield (total DM) of wheat cultivars in relation to the leaf B concentration, grown in nutrient solution with B rates, harvested at 112 days of age; b) Total DM in relation to the the total B content in the plants; c) Variation in the spike-DM in relation to the spike-straw B concentration; d) Variation in the total B content of plants in relation to the B rates in the nutriente solution. In figure 1a and 1b, no equation fit the experimental points obtained for ‘IAC 60’, ‘IAC 287’ and ‘IAC 289’. In figure 1c, no equation fit the experimental points obtained for ‘IAC 60’ and ‘IAC 289’.
r a v i t l u
C Boronconcentration, mgL
1 -s n a e M (1)
0 0.05 0.20 0.80 2.0
-) m c ( t h g i e h t n a l P -4 2 C A
I 67.6 65.6 66.8 68.8 68.8 67.5C
0 6 C A
I 76.8 77.4 79.4 75.4 77.2 77.2B
7 8 2 C A
I 91.6 91.8 95.0 91.4 88.2 91.6 A
9 8 2 C A
I 70.6 59.8 75.8 66.4 64.0 67.3C
s n a e
M 76.6 73.6 79.2 75.5 74.6
s n 3 0 . 1 ) t l u C s v B ( F ; * * 6 . 0 7 ) t l u c ( F ; s n ) B ( . r g e r F ; % 0 . 9 = t l u c V C ; % 3 . 3 = n o r o b V C -e k i p s r e p s t e l e k i p s n e p o f o r e b m u N -4 2 C A
I 18.5 6.1 4.1 4.3 2.1 7.0AB
0 6 C A
I 19.5 4.4 3.6 7.0 3.9 7.7A
7 8 2 C A
I 16.0 1.5 2.0 1.7 1.5 4.5C
9 8 2 C A
I 17.2 2.1 1.6 3.3 3.3 5.5BC
s n a e
M 17.8 3.5 2.8 4.1 2.7
s n 4 6 . 0 ) t l u C s v B ( F ; * * 1 2 . 6 ) t l u c ( F ; * * 6 . 5 2 ) B ( . r g e r F ; % 4 . 6 4 = t l u c V C ; % 2 . 1 3 = n o r o b V C -e k i p s r e p s n i a r g f o r e b m u N -4 2 C A
I ---(2) 20.4 24.5 21.4 27.6 23.5B
0 6 C A
I --- 36.8 28.9 26.7 31.9 31.1 A
7 8 2 C A
I --- 31.6 34.0 34.8 35.1 33.9 A
9 8 2 C A
I --- 30.9 39.8 34.2 33.4 34.6 A
s n a e
M --- 29.9 31.8 29.3 32.0
, v.60, n.2, p.359-370, Abr./Jun. 2003
The number of open spikelets varied with B con-centrations and with the cultivar. Severe B deficiency symp-toms were observed in the no-added B treatment, which con-sisted of 100% open and distorted spikelets, for the four cul-tivars. ‘IAC 287’ was evidenced with the least number of open spikelets, when compared to the other cultivars in the B-added treatments (from 0.05 to 2.0 mg B L-1) (Table 1).
In the no-added B treatment there was higher dry matter (DM) of leaves, stalks and roots in detriment of
spikes and grains (no grains were formed) for all culti-vars. The regression analysis for DM of leaves, stalks and roots were significant, indicating a decrease in DM pro-duction of those parts in the B-added treatments in the nutrient solution, and a significant increase in DM of spikes and grains (Table 2).
Boron deficiency inhibits root elongation through limiting cell enlargement and cell division in the grow-ing zone of root tips. In the case of severe B deficiency,
r a v i t l u
C Boronconcentration,mgL
1 -s n a e M (1)
0 0.05 0.20 0.80 2.0
t o p g , r e t t a m y r d f a e L
-- -1---------------------------------------------------
-4 2 C A
I 11.8 10.8 11.9 12.8 11.6 11.8 B
0 6 C A
I 14.9 14.0 13.8 13.9 13.1 13.9A
7 8 2 C A
I 16.1 13.3 14.4 13.4 13.8 14.2A
9 8 2 C A
I 12.7 11.9 9.9 10.1 9.9 10.9B
s n a e
M 13.9 12.5 12.5 12.5 12.1
s n 6 5 . 1 ) t l u C s v B ( F ; * * 9 . 9 2 ) t l u c ( F ; * 1 4 . 5 ) B ( L r g e r F ; % 7 . 1 1 = t l u c V C ; % 3 . 6 = n o r o b V C t o p g , r e t t a m y r d k l a t S
-- -1--------------------------------------------------
-4 2 C A
I 17.7 12.2 11.6 11.3 11.2 12.8 C
0 6 C A
I 21.7 17.7 15.6 14.6 12.4 16.4B
7 8 2 C A
I 26.3 16.8 18.8 16.1 16.9 19.0A
9 8 2 C A
I 14.3 9.3 9.3 6.3 5.9 9.0D
s n a e
M 20.0 14.0 13.8 12.1 11.6
s n 2 0 . 1 ) t l u C s v B ( F ; * * 8 . 9 6 ) t l u c ( F ; * * 1 . 5 2 ) B ( Q r g e r F ; % 1 . 8 1 = t l u c V C ; % 2 . 9 = n o r o b V C t o p g . r e t t a m y r d t o o R
-- -1--------------------------------------------------
-4
2 C A
I 3.3 2.8 2.3 2.3 2.4 2.6 B
0 6 C A
I 4.3 3.5 3.1 3.0 2.5 3.3AB
7 8 2 C A
I 6.2 2.9 3.9 3.9 3.2 4.1 A
9 8 2 C A
I 4.7 2.7 2.5 2.1 1.9 2.8 B
s n a e
M 4.6 3.0 3.0 2.8 2.5
s n 1 5 . 1 ) t l u C s v B ( F ; * * 3 . 1 1 ) t l u c ( F ; * * 3 0 . 9 ) B ( Q r g e r F ; % 9 . 9 2 = t l u c V C ; % 4 . 7 1 = n o r o b V C t o p g , r e t t a m y r d e k i p S
-- -1--------------------------------------------------
-4 2 C A
I 8.6 18.4 17.9 18.2 20.7 16.8B
0 6 C A
I 10.7 29.7 24.9 19.9 21.3 21.3A
7 8 2 C A
I 9.2 23.8 24.9 21.0 26.9 21.2A
9 8 2 C A
I 9.2 18.8 19.1 13.1 13.1 14.7B
s n a e
M 9.4 22.7 21.7 18.1 20.5
s n 5 2 , 1 ) t l u C s v B ( F ; * * 4 , 8 ) t l u c ( F ; s n ) B ( r g e r F ; % 8 , 0 3 = t l u c V C ; % 0 , 5 1 = n o r o b V C t o p g , w a r t s -e k i p S
-- -1----------------------------------------------------
-4 2 C A
I 8.6 8.1 5.5 7.4 7.9 7.5
0 6 C A
I 10.7 9.2 7.3 7.4 6.0 8.1
7 8 2 C A
I 9.2 6.1 7.4 5.8 7.0 7.1
9 8 2 C A
I 9.2 8.3 9.9 3.8 5.2 7.3
s n a e
M 9.4 7.9 7.5 6.1 6.5
s n 5 . 1 ) t l u C s v B ( F ; s n 5 1 . 1 ) t l u c ( F ; * 7 . 4 3 ) B ( Q r g e r F ; % 6 . 9 3 = t l u c V C ; % 9 . 8 1 = n o r o b V C t o p g , r e t t a m y r d n i a r G
-- -1---------------------------------------------------
-4 2 C A
I (2) 10.3 12.4 10.8 12.8 11.6 B
0 6 C A
I 20.5 17.6 13.8 15.4 16.8A
7 8 2 C A
I 17.7 17.5 20.0 15.2 17.6A
9 8 2 C A
I 10.5 9.2 9.4 7.9 9.2B
s n a e
M 14.7 14.2 13.5 12.8
s n 5 5 . 0 ) t l u C s v B ( F ; * * 6 . 0 1 ) t l u c ( F ; s n 0 8 . 0 ) o r o b ( F ; % 4 . 0 4 = t l u c V C ; % 9 . 8 1 = n o r o b V C
Table 2- Dry matter of plant parts of four wheat cultivars grown in nutrient solution treated with five boron concentrations. Harvest at maturity, at 112 days of age.
*Significant at P < 0.05; ** Significant at P < 0.01; ns – non- significant; CV = coefficient of variation; F regr (B) = F-test for polinomial regression for boron rates, L = linear; and Q = quadratic; F (cult) = F test for cultivars; F(BvsCult) = interaction (B rates vs cultivars).
, v.60, n.2, p.359-370, Abr./Jun. 2003
the root cap disappears and root growth ceases, leading to the death of root tips. This implies in an increase of the shoot/root ratio, which may enhance the susceptibil-ity of plants to nutrient and water stresses. Vascular bundles are weakly developed in B-deficient roots (Dell & Huang, 1997); B-deficient seeds generate abnormal seedlings (Marschner, 1995).
Although solutions were prepared with pure re-agents and deionized water, B deficiency was not severe enough to impair root growth or xylem formation in the no-added B treatment. It might be that B content of origi-nal seeds were enough to provide adequate amount for plant growth, but not for spike and grain formation. The effects of low B reducing male fertility by impairing
mi-crosporogenesis and pollen tube growth is well known in wheat (Dell & Huang, 1997). Deficiency of B reduces grain set resulting in increased number of open spikelets and decreased number of grains per spike (Rerkasem & Jamjod, 1997a).
‘IAC 60’ and ‘IAC 287’ had higher dry matter production (DM) of plant parts in all B concentrations, and ‘IAC 24’ and ‘IAC 289’ were less productive, which may be considered, in the same way as plant height was, a genetic characteristic of the cultivars. Neverthless, in the B-added treatments, ‘IAC 60’ e ‘IAC 287’ had the highest DM of shoots, spikes and grains, presenting higher efficiency in the lower B concentrations as com-pared to the other cultivars. ‘IAC 287’ also had the least
r a v i t l u
C Boronconcentration,mgL
1 -s n a e M (1)
0 0.05 0.20 0.80 2.0
g k g m , s n o i t a r t n e c n o c B f a e L
-- -1----------------------------------------------
-4 2 C A
I 16.0a 25.8a 43.2a 117.1a 228.1c 86.1
0 6 C A
I 15.5a 27.0a 44.0a 111.4a 243.7c 88.3
7 8 2 C A
I 13.3a 30.1a 47.4a 121.2a 317.5a 105.9
9 8 2 C A
I 16.6a 27.6a 45.3a 124.9a 284.2b 99.7
s n a e
M 15.4 27.6 45.0 118.7 268.4
* * 7 9 . 5 ) t l u C s v B ( F ; * * 2 6 . 8 ) t l u c ( F ; * * ) B ( L r g e r F ; % 9 . 6 1 = t l u c V C ; % 1 . 0 1 = n o r o b V C g k g m , s n o i t a r t n e c n o c B k l a t S
-- -1----------------------------------------------
-4 2 C A
I 7.2 9.3 11.0 14.6 14.5 11.3AB
0 6 C A
I 5.3 9.1 8.2 11.9 15.7 10.0B
7 8 2 C A
I 9.4 11.1 10.1 15.1 18.4 12.8A
9 8 2 C A
I 7.6 8.7 10.5 13.1 21.4 12.3AB
s n a e
M 7.4 9.6 9.9 13.7 17.5
s n 5 8 . 0 ) t l u C s v B ( F ; * 1 7 . 2 ) t l u c ( F ; * * 7 . 6 4 ) B ( L r g e r F ; % 0 . 2 3 = t l u c V C ; % 8 . 1 2 = n o r o b V C g k g m , s n o i t a r t n e c n o c B t o o R
-- -1----------------------------------------------
-4 2 C A
I 17.1 18.3 24.6 19.0 25.1 20.8
0 6 C A
I 19.5 20.0 17.9 20.1 19.0 19.3
7 8 2 C A
I 13.6 17.1 12.7 21.4 22.1 18.8
9 8 2 C A
I 16.6 18.1 14.3 21.1 24.0 17.4
s n a e
M 16.7 18.4 17.4 20.4 22.5
s n 9 4 . 1 ) t l u C s v B ( F ; s n 7 7 . 1 ) t l u c ( F ; * 1 . 8 ) B ( L r g e r F ; % 8 . 7 2 = t l u c V C ; % 6 . 8 1 = n o r o b V C g k g m , s n o i t a r t n e c n o c B w a r t s -e k i p S
-- -1-------------------------------------------
-4 2 C A
I 7.2a 16.6a 32.0a 38.9b 74.4b 33.8
0 6 C A
I 8.3a 19.6a 22.7a 40.4b 87.3b 35.6
7 8 2 C A
I 8.9a 22.3a 25.9a 73.0a 129.0a 51.8
9 8 2 C A
I 10.0a 22.0a 24.3a 52.6ab 66.8b 35.1
s n a e
M 8.6 20.1 26.2 51.2 89.4
s * * 6 2 . 3 ) t l u C s v B ( F ; * * 5 9 . 6 ) t l u c ( F ; * * ) B ( L r g e r F ; % 3 . 1 4 = t l u c V C ; % 1 . 8 1 = n o r o b V C g k g m , s n o i t a r t n e c n o c B n i a r G
-- -1-----------------------------------------------
-4 2 C A
I (2) 3.9 3.9 4.8 5.4 4.5B
0 6 C A
I --- 4.3 3.8 2.9 5.4 4.1B
7 8 2 C A
I --- 3.5 4.2 5.0 4.6 4.3B
9 8 2 C A
I --- 6.2 6.2 6.1 6.8 6.3A
s n a e
M --- 4.5 4.5 4.7 5.5
s n 3 7 . 0 ) t l u C s v B ( F ; * * 4 0 . 8 ) t l u c ( F ; * * 3 . 8 ) B ( L r g e r F ; % 9 . 3 3 = t l u c V C ; % 5 . 3 1 = n o r o b V C
Table 3 - Boron concentrations in the dry matter of leaves, stalks, roots, spike-straw and grains of four wheat cultivars grown in nutrient solution treated with five boron concentrations. Harvest at maturity, at 112 days of age.
*Significant at P < 0.05; ** Significant at P < 0.01; ns – non- significant; CV = coefficient of variation; F regr (B) = F-test for polinomial regression for boron rates, L = linear; and Q = quadratic; F (cult) = F test for cultivars; F(BvsCult) = interaction (B rates vs cultivars).
, v.60, n.2, p.359-370, Abr./Jun. 2003
number of open spikelets even in lower B concentrations (Tables 1 and 2).
The shoot/root ratio of DM increased consistently with the increase in DM of spikes and grains and the de-crease of DM of roots in the B-added treatments. ‘IAC 24’ had an increasing shoot/root ratio of DM up to the highest B concentration in the solution: the ratio values varied from 11.5 (no B-added ); 14.8 (0.05 mg B L-1);
17.9 (0.2 mg B L-1); 18.4 (0.8 mg B L-1); to 21.8 (2.0 mg B L-1); total DM, spike and grain DM were not affected at the highest B concentration. ‘IAC 60’ and ‘IAC 289’ presented differences in shoot/root ratio between no-B (11.0 and 7.7, respectively) and B-added treatments only (17,5 and 14.8, respectively), not varying with the B con-centrations; ‘IAC 287’ had the highest ratio (18.6) at 0.05 mg B L-1.
r a v i t l u
C Boronconcentration,mgL
1 -s n a e M (1)
0 0.05 0.20 0.80 2.0
, t n e t n o c B f a e L
-- µgpot-1---------------------------------------------------
-4 2 C A
I 186a 275a 510a 1488a 2662c 1024
0 6 C A
I 224a 368a 598a 1539a 3182b 1182
7 8 2 C A
I 215a 398a 682a 1620a 4377a 1458
9 8 2 C A
I 207a 322a 454a 1263a 2829bc 1015
s n a e
M 208 341 561 1478 3262
* * 5 . 9 ) t l u C s v B ( F ; * * 4 . 9 1 ) t l u c ( F ; * * ) B ( r g e r F ; % 1 . 0 2 = t l u c V C ; % 5 . 5 1 = n o r o b V C , t n e t n o c B k l a t S
-- µgpot-1--------------------------------------------------
-4 2 C A
I 128 112 127 167 164 140BC
0 6 C A
I 114 161 124 172 195 153B
7 8 2 C A
I 260 192 194 247 305 240A
9 8 2 C A
I 99 79 96 84 129 98C
s n a e
M 150 136 136 168 199
s n 3 5 . 0 ) t l u C s v B ( F ; * * 4 . 7 1 ) t l u c ( F ; * * 9 . 8 ) B ( r g e r F ; % 3 . 5 4 = t l u c V C ; % 9 . 3 2 = n o r o b V C , t n e t n o c B w a r t s -e k i p S
-- µgpot-1----------------------------------------------
-4 2 C A
I 64a 137a 170a 282a 653ab 262
0 6 C A
I 81a 192a 157a 299a 530bc 252
7 8 2 C A
I 64a 117a 192a 432a 863a 333
9 8 2 C A
I 70a 182a 192a 246a 352c 208
s n a e
M 70 157 178 315 599
* 1 1 . 2 ) t l u C s v B ( F ; * 0 5 . 2 ) t l u c ( F ; * * ) L ( Q r g e r F ; % 1 . 2 6 = t l u c V C ; % 7 . 4 3 = n o r o b V C , t n e t n o c B n i a r G
-- µgpot-1--------------------------------------------------
-4 2 C A
I ---(2) 48 50 50 70 55
0 6 C A
I --- 87 66 42 85 70
7 8 2 C A
I --- 62 60 67 91 70
9 8 2 C A
I --- 69 56 56 54 58
s n a e
M --- 66 58 54 75
s n 0 7 . 0 ) t l u C s v B ( F ; s n 8 1 . 1 ) t l u c ( F ; * 4 . 5 ) B ( Q r g e r F ; % ; % 6 . 1 5 = t l u c V C ; % 5 . 9 1 = n o r o b V C , t n e t n o c B t o o R
-- µgpot-1--------------------------------------------------
-4 2 C A
I 54 49 55 44 62 53AB
0 6 C A
I 87 64 54 61 48 63AB
7 8 2 C A
I 77 50 48 69 82 65A
9 8 2 C A
I 73 46 37 44 45 49B
s n a e
M 73 52 49 54 59
s n 0 6 . 1 ) t l u C s v B ( F ; * * 5 4 . 4 ) t l u c ( F ; s n ) B ( r g e r F ; % 5 . 2 3 = t l u c V C ; % 3 . 7 1 = n o r o b V C , o i t a r t n e t n o c B l a t o t / f a e L
-- µgmg-1--------------------------------------------
-4 2 C A
I 0.45 0.46 0.56 0.74 0.75 0.61
0 6 C A
I 0.45 0.43 0.60 0.73 0.79 0.60
7 8 2 C A
I 0.36 0.48 0.59 0.67 0.78 0.59
9 8 2 C A
I 0.46 0.47 0.51 0.77 0.82 0.57
s n a e
M 0.44 0.49 0.57 0.73 0.78
s n 4 3 . 1 ) t l u C s v B ( F ; s n 6 9 . 0 ) t l u c ( F ; * * 3 . 7 4 ) B ( Q r g e r F ; % 6 . 2 1 = t l u c V C ; % 3 . 7 = n o r o b V C
Table 4 - Boron content in leaves, stalks, spike-straw and grains of four wheat cultivars grown in nutrient solution treated with five boron concentrations. Harvest at maturity, at 112 days of age.
*Significant at P < 0.05; ** Significant at P < 0.01; ns – non- significant; CV = coefficient of variation; F regr (B) = F-test for polinomial regression for boron rates, L = linear; and Q = quadratic; F (cult) = F test for cultivars; F(BvsCult) = interaction (B rates vs cultivars).
, v.60, n.2, p.359-370, Abr./Jun. 2003
The relation between DM and leaf content of B indicated for ‘IAC 60’ a decrease in total DM production, for B leaf contents below 27 mg kg-1, and a decrease in spike DM for B contents in the spike straw below 20 mg kg-1
(Figures 1a, 1c). For the other cultivars, B contents below 25 to 30 mg kg-1 limited plant growth and spike yield. ‘IAC 60’ had a 26% increase in total DM and 20 times more grain DM, when leaf B contents varied from 15 to 27 mg kg-1. The critical B deficiency leaf content for all the wheat cultivars used in this experiment is between 25 and 30 mg kg-1 DM.
The critical level for B toxicity varied depend-ing on the wheat cultivar, evidencdepend-ing different plant abili-ties to tolerate B: ‘IAC 60’ had a reduction in total DM yield between 0.2 and 2.0 mg B L-1
, corresponding to a leaf B content above 44 mg kg-¹ or 1.0 mg total B in the plant (Figures 1a e 1b). The ‘IAC 60’ wheat cultivar had also reductions in spike and grain DM, for spike-straw (vegetative parts: glumes, rachis) B contents above 23 mg kg
-¹ (Tables 2 and 3, Figure 1c). Boron toxicity was also evident for ‘IAC 289’, which had a reduction in dry mat-ter yield of stalks, roots and spikes when B was above 0.2 mg L-1, corresponding to a leaf B content of 45 mg kg-¹, and in the spike-straw of about 24 mg kg-¹.
The wheat cultivars IAC 287 and IAC 24 were more tolerant to the highest B concentration in solution,
not presenting any toxicity symptoms or alteration in the evaluated variables (Tables 2 and 3, Figures 1a and 1b). In field experiments, Freitas et al. (1995; 1996) observed differentiated response in grain yield of wheat cultivars (IAC 24, IAC 60, IAC 227 and IAC 287) in relation to B applied to a low B sandy soil, at the rates of 0.0; 0.55 and 1.10 kg ha-1. ‘IAC 60’and ‘IAC 227’ grain yields fit-ted quadratic regression models, and ‘IAC 24’ yield re-sponse, a linear model; ‘IAC 287’ did not respond to B application. In the present experiment, the relation be-tween total DM yield of ‘IAC 24’ and its leaf B content best fit a quadratic model (through a reciprocal equation). This response was obtained over a large B concentration range in the nutrient solution. However, the response in the initial range fit a linear model (Figure 1b). Data ob-tained for ‘IAC 60’ and ‘IAC 287’ in nutrient solution presented also similar tendencies as compared to those obtained in the field. In nutrient solution and field, ‘IAC 60’ was more productive in conditions of low B.
Boron concentrations in plant parts increased lin-early with the B-added treatments in nutrient solution for all wheat cultivars, with highly significant coefficients for the linear regression equations. Differences among wheat cultivars were observed for the B concentrations in leaves, stalks, spike-straw and grains, evidencing differencial B accumulation among them in relation to the
r a v i t l u
C Boronconcentrations, mgL
1
-s n a e M (1)
0 0.05 0.20 0.80 2.0
g k g , n o i t a r t n e c n o c P f a e L
-- -1-------------------------------------------------------
-4 2 C A
I 1.6a 1.4a 1.2a 1.1b 1.2b 1.3
0 6 C A
I 1.4a 0.8a 0.9a 1.2b 1.2b 1.1
7 8 2 C A
I 1.7a 0.8a 0.8a 1.0b 1.1b 1.1
9 8 2 C A
I 1.7a 1.1a 1.2a 2.5a 2.7a 1.9
s n a e
M 1.6 1.0 1.0 1.5 1.5
g k g , n o i t a r t n e c n o c K f a e L
-- -1------------------------------------------------------
-4 2 C A
I 40.2 43.5 44.2 44.0 47.3 43.9B
0 6 C A
I 38.2 38.2 44.1 45.6 46.4 42.7BC
7 8 2 C A
I 39.8 40.5 39.7 40.2 41.5 40.3C
9 8 2 C A
I 47.3 44.0 49.4 55.6 56.2 50.6A
s n a e
M 41.7 41.5 44.5 46.3 47.9
g k g , n o i t a r t n e c n o c a C f a e L
-- -1 -----------------------------------------------------
-4 2 C A
I 12.0 12.8 11.9 14.4 11.6 12.5B
0 6 C A
I 12.9 14.4 14.6 15.7 13.7 14.3B
7 8 2 C A
I 12.6 18.2 19.7 17.8 17.4 17.1A
9 8 2 C A
I 12.0 16.9 19.1 16.0 16.6 16.1A
s n a e
M 12.4 15.6 16.3 16.0 14.8
g k g , n o i t a r t n e c n o c g M f a e L
-- -1 -----------------------------------------------------
-4 2 C A
I 2.7 2.6 2.5 2.8 2.4 2.6BC
0 6 C A
I 3.3 3.6 3.4 3.3 2.9 3.3A
7 8 2 C A
I 2.2 2.8 3.5 2.9 2.9 3.9B
9 8 2 C A
I 2.2 2.6 2.6 2.2 2.1 2.3C
s n a e
M 2.6 2.9 3.0 2.8 2.5
Table 5 - P, K, Ca and Mg concentrations in the dry matter of leaves of four wheat cultivars grown in nutrient solution treated with five boron concentrations. Harvest at maturity, at 112 days of age.
, v.60, n.2, p.359-370, Abr./Jun. 2003
B-added treatments (Table 3, Figura 1c), which was con-firmed by the data on B accumulation in plant parts (Table 4). ‘IAC 287’ had the highest B contents, mainly in leaves and spike-straw, evidencing greater ability of roots in B acquisition. Although the higher B accumulation in plant parts observed in ‘IAC 287’, in relation to increasing B-added treatments, this wheat cultivar did not presented reduction on DM and grain yield under high B in the so-lution (Table 4 and Figure 1d).
It is suggested that the B content of original seeds might be enough to provide adequate amount of B for plant growth, but not for spike and grain formation. An estimation of B from original seeds may be inferred from the total B contents found in plants from the no-B-added treatments. The total B contents in these plants were, re-spectively, inµgB pot-1
: 434 (‘IAC 24’); 500 (‘IAC 60’); 617 (‘IAC 287’); and 450 (‘IAC 289’), corresponding to a total average B content = 500 µg, for an average total DM = 47.8 g pot-1, or 10.5 µg B g-1 DM (or 10.5 mg B kg-1 whole plant DM). Data from the literature confirm a higher functional B requirement for reproductive
devel-opment than for vegetative growth, and male sterility and grain set failure have been associated to 7-8 mg B kg-1 DM in the anthers and 5-6 mg B kg-1 DM in the carpel, while no evidence of B deficiency has been found in wheat leaves containing 4 mg B kg-1 DM or in the spike vegetative parts (straw) with 2 mg B kg-1 DM (Rerkasem & Jamjod 1997 a; b). These values permit to infer that the average B concentration found in the plants grown with no-added B in this experiment (10 mg kg-1 in a whole plant DM basis, estimated to be available from original seeds), was enough to avoid visual symptoms of B defi-ciency in the vegetative parts, although a leaf critical limit around 25 mg kg-1 was determined, below which there was reduction of whole plant DM yield (Figure 1a, 1c).
Since B-inefficient and efficient wheat genotypes are not distinguishable by the B concentration in their flag leaf or the whole spike, and that wheat genotype re-sponses to low external B do not show correlation with their reproductive responses, it may sometimes be nec-essary to consider vegetative and reproductive efficien-cies separately (Rerkasem et al., 1993; Rerkasem &
Table 6 - P, K, Ca and Mg total plant contents of four wheat cultivars grown in nutrient solution treated with five boron concentrations. Harvest at maturity, at 112 days of age.
*Significant at P < 0.05; ** Significant at P < 0.01; ns – non- significant; CV = coefficient of variation; F regr (B) = F-test for polinomial regression for boron rates, L = linear; and Q = quadratic; F (cult) = F test for cultivars; F(BvsCult) = interaction (B rates vs cultivars).
, v.60, n.2, p.359-370, Abr./Jun. 2003
Loneragan, 1994). The transport of B to the upper parts of plants is known to be essential for plant efficiency in B utilization and differential B mobility in plant species and cultivars have been recently demonstrated (Brown & Shelp, 1997).
The wheat cultivars showed that the leaf-con-tent/total-content ratio increased with the increasing B-added treatments, indicating a progressively higher B transport to leaves, neverthless the magnitude of this pro-cess was similar for all wheat cultivars. There was no evi-dence of differential B transport to leaves among culti-vars (Table 4). However, a highly significant differential transport of B to spikes was observed among cultivars, evidenced by the B content in the spike-straw and the sig-nificant interaction between B treatments and cultivars for this variable. ‘IAC 287’ evidenced higher B content in the stalks and spike-straw (Table 4), what may indicate better ability of this wheat cultivar in translocating B to the spike. A similar relation tendency to that observed in Figure (1a), between total DM yield and leaf B concen-tration, was also observed between DM and spike-straw B concentration (Figure 1c). ‘IAC 24’ actually re-quires more B for growth and grain yield, as inferred from the gradually higher response obtained for the total-plant-DM and spike-total-plant-DM in relation to the spike-straw B con-centration (Figura 1c) and from the gradual increase in the number of grains per spike with increasing B concen-tration (Table 1). ‘IAC 60’ followed by ‘IAC 287’ pre-sented the best responses to the lower rates of B added to the solution, having the highest values for total-DM and spike-DM and grain-DM (Table 2) related to low leaf B and spike B concentrations in the DM (Figures 1a, 1b, 1c). As these two cultivars presented the highest dry mat-ter yields of plant parts, they also accumulated larger B amounts, although the differences among cultivars for leaf, stalk, spike and grain B contents were only signifi-cant for the highest concentration of B in the solution. That means, the B contents were not different among cul-tivars in the lower B treatments, however, ‘IAC 287’ and ‘IAC 60’ tended to accumulate more B than the other cul-tivars, and differences increased as B increased in the nu-trient solution, which might be an evidence of their bet-ter ability to translocate B to the reprodutive parts of the plants (Table 4).
Leaf concentrations of P, Ca, K and Mg (average sample of all shoot leaves) were considered within ad-equate limits as compared to data found in the literature for the flag leaf of plants grown in the field (Cantarella et al., 1997), although P values were higher (young leaves usually present higher P concentrations) and the K, Ca and Mg values were lower than the average concentra-tion for all the leaves found in plants grown in this nu-trient solution experiment. P, K, Ca and Mg leaf concen-trations of wheat cultivars did not vary significantly with the increasing B treatments (Table 5).
These results confirmed those obtained by Yamagishi & Yamamoto (1994) and Furlani et al. (2001), who observed no interactions between B con-tents and K, Ca and Mg concon-tents in plant DM of soy-bean cultivars grown under increasing B concentrations. These wheat and soybean experiments indicated that in-creasing external B concentrations did not interfere on the uptake of other nutrients, mainly on the B/Ca ratio. In the field, this ratio is particularly important, since B and Ca have similar process of movement by mass flow in the soil to the root system which depends on soil con-ditions, soil water content and the plant species or cul-tivar. Interaction between liming and B availability has been observed and B deficiency may be induced by liming (Bataglia, 1988; Dechen, 1988 a; b; Gupta, 1993).
Neverthless, B deficiency is not induced by in-creasing Ca/B ratio by liming as supposed, but by the ex-ternal pH, since plants selectively absorb the uncharged molecular form of boric acid (H3BO3), which predominates at pH< 7, in detriment of the ionic form (H2BO3-), which predominates at pH> 7. Therefore, boric acid neither com-petes with other anionic nutrients for the binding sites in the plasma membrane, nor depends on the cell energy to enter against the negative electropotential in the vacuole, and bypass passively through the membrane. As an un-charged solute, boric acid is absorbed and transported into the plant by the transpiration flow much easier than cal-cium cations (Ca2+) that are divalent and have their move-ment into the plant in disavantage, because of the nega-tive charges of cell walls and membranes (Marschner, 1995).
The wheat cultivars ‘IAC 287’ and ‘IAC 60’ had higher K, Ca and Mg total plant contents. ‘IAC 289’, grown in the 0.8 and 2.0 mg B L-1
treatments, presented a decrease in total plant DM yield, grain yield and total content of K, Ca and Mg which are evidences of B tox-icity effects. ‘IAC 24’ and ‘IAC 60’ had a reduction in total Mg content of plants grown with high B in the so-lution (Table 6).
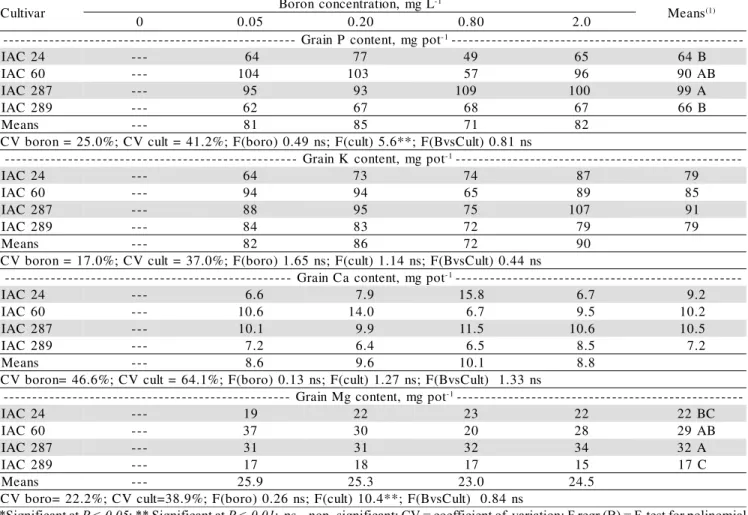
The P, K, Ca and Mg total content of grains did not vary with the rates of B-added. However ‘IAC 60’ and ‘IAC 287’ accumulated higher amount of nutrients in the grains (Table 7).
, v.60, n.2, p.359-370, Abr./Jun. 2003
The critical limits for B deficiency and toxicity for the wheat cultivars ‘IAC 60’ and ‘IAC 289’ are within a very narrow range, a fact that encourages careful moni-toring of the soil B content. These cultivars indicated for low B soils, present higher efficiency for B uptake un-der low B concentrations, having good chances for bet-ter grain yield under these conditions. ‘IAC 287’ is effi-cient at low B conditions and more tolerant to higher B concentrations, presenting adaptation to a larger range of soil B contents.
CONCLUSIONS
The wheat cultivars presented a lower B require-ment for dry matter yield than for grain yield.
B content in original seeds was enough for plant growth and there were no visual symptoms of B defi-ciency in the vegetative parts. The reproductive parts, consisting of grain, were affected.
The critical level for B deficiency for the stud-ied wheat cultivars was 25 mg kg-1 in leaf dry matter, and
the critical level for B toxicity varied from 44 to 45 mg kg-1
for ‘IAC 60’ and ‘IAC 289’; 228 and 318 mg kg-1
for ‘IAC 24’ and ‘IAC 287’, respectively.
ACKNOWLEDEGMENTS
To FAPESP and CNPq for financial support. To Carlos Aparecido Fernandes, José Norberto da Silva and Maria de Fátima Monteiro Borges for the participation in the experiments.
REFERENCES
BATAGLIA, O.C. Micronutrientes: disponibilidade e interações. In: BORKERT, C.C; LANTMANN, A.F. (Ed.) Enxofre e micronutrientes na agricultura brasileira. Londrina: Embrapa; IAPAR; SBCS, 1988. p.121-132.
BROWN, P.H.; SHELP, B.J. Boron mobility in plants. Plant and Soil, v.193, p. 85-101, 1997.
CANTARELLA, H.; RAIJ, B.van; CAMARGO, C.E. de O. Cereais. In: RAIJ, B. van; CANTARELLA, H.; QUAGGIO, J.A.; FURLANI, A.M.C. (Ed.) Recomendações de adubação e calagem para o Estado de São Paulo. 2. ed. Campinas: Instituto Agronômico, 1997. p-45-49. (IAC. Boletim Técnico, 100 ).
Table 7 - P, K, Ca and Mg content in the grains of four wheat cultivars grown in nutrient solution treated with five boron concentrations. Harvest at maturity, at 112 days of age.
*Significant at P < 0.05; ** Significant at P < 0.01; ns – non- significant; CV = coefficient of variation; F regr (B) = F-test for polinomial regression for boron rates, L = linear; and Q = quadratic; F (cult) = F test for cultivars; F(BvsCult) = interaction (B rates vs cultivars).
(1)Means followed by the same letters, in the column, do not differ by Tukey test (P = 0.05). (2)No data; no grain yield obtained in the no-added B treatment.
r a v i t l u
C Boronconcentration, mgL
1 -s n a e M (1)
0 0.05 0.20 0.80 2.0
t o p g m , t n e t n o c P n i a r G
-- -1--------------------------------------------------
-4 2 C A
I --- 64 77 49 65 64 B
0 6 C A
I --- 104 103 57 96 90AB
7 8 2 C A
I --- 95 93 109 100 99A
9 8 2 C A
I --- 62 67 68 67 66 B
s n a e
M --- 81 85 71 82
s n 1 8 . 0 ) t l u C s v B ( F ; * * 6 . 5 ) t l u c ( F ; s n 9 4 . 0 ) o r o b ( F ; % 2 . 1 4 = t l u c V C ; % 0 . 5 2 = n o r o b V C t o p g m , t n e t n o c K n i a r G
-- -1-------------------------------------------------
-4 2 C A
I --- 64 73 74 87 79
0 6 C A
I --- 94 94 65 89 85
7 8 2 C A
I --- 88 95 75 107 91
9 8 2 C A
I --- 84 83 72 79 79
s n a e
M --- 82 86 72 90
s n 4 4 . 0 ) t l u C s v B ( F ; s n 4 1 . 1 ) t l u c ( F ; s n 5 6 . 1 ) o r o b ( F ; % 0 . 7 3 = t l u c V C ; % 0 . 7 1 = n o r o b V C t o p g m , t n e t n o c a C n i a r G
-- -1-------------------------------------------------
-4 2 C A
I --- 6.6 7.9 15.8 6.7 9.2
0 6 C A
I --- 10.6 14.0 6.7 9.5 10.2
7 8 2 C A
I --- 10.1 9.9 11.5 10.6 10.5
9 8 2 C A
I --- 7.2 6.4 6.5 8.5 7.2
s n a e
M --- 8.6 9.6 10.1 8.8
s n 3 3 . 1 ) t l u C s v B ( F ; s n 7 2 . 1 ) t l u c ( F ; s n 3 1 . 0 ) o r o b ( F ; % 1 . 4 6 = t l u c V C ; % 6 . 6 4 = n o r o b V C t o p g m , t n e t n o c g M n i a r G
-- -1-------------------------------------------------
-4 2 C A
I --- 19 22 23 22 22BC
0 6 C A
I --- 37 30 20 28 29AB
7 8 2 C A
I --- 31 31 32 34 32A
9 8 2 C A
I --- 17 18 17 15 17 C
s n a e
M --- 25.9 25.3 23.0 24.5
, v.60, n.2, p.359-370, Abr./Jun. 2003
Received August 19, 2002 DECHEN, A.R. Mecanismos de absorção e de translocação de nutrientes.
In: SIMPÓSIO SOBRE MICRONUTRIENTES NA AGRICULTURA, 1., Jaboticabal, 1988. Anais. Jaboticabal: UNESP, 1988a. p.133-168. DECHEN, A.R. Micronutrientes: funções nas plantas. In: SIMPÓSIO
SOBRE MICRONUTRIENTES NA AGRICULTURA, 1., Jaboticabal, 1988. Anais. Jaboticabal: UNESP, 1988b. p.111-132.
DECHEN, A.R.; FURLANI, A.M.C.; FURLANI, P.R. Tolerância e adaptação de plantas aos estresses nutricionais. In: SIQUEIRA, J.O; MOREIRA, F.M.S.; LOPES, A.S.; GUILHERME, L.R.G.; FAQUIN, V.; FURTINI-NETO, A.E.; CARVALHO, J.G. (Ed.) Inter-relação fertilidade, biologia do solo e nutrição de plantas. Viçosa: SBCS; Lavras: UFLA - Depto. de Ciência do Solo, 1999. p.337- 361. DELL, B.; HUANG, L.B. Physiological response of plants to low boron.
Plant and Soil, v.193, p.103-120, 1997.
EVANS, L.T.; WARLAN, I.F.; FISHER, R.A. Wheat. In: EVANS, L.T. (Ed.)
Crop physiology. London: Cambridge University, 1976. p. 101-149. FREITAS, J.G. de; CAMARGO, C.E. de O.; CANTARELLA, H.;
FERREIRA FILHO, A.W.P.; PETTINELLI JR., A. Resposta de genótipos de trigo ao boro em condições de sequeiro. (CD-ROM) In: CONGRESSO LATINOAMERICANO DE CIENCIA DO SOLO, 13., Águas de Lindóia, 1996. Anais. Águas de Lindóia: USP; Sociedade Latinoamericana de Ciência do Solo; SBCS; Sociedade Brasileira de Microbiologia, 1996.
FREITAS, J.G. de; CAMARGO, C.E. de O.; FERREIRA FILHO, A.W.P.; CANTARELLA, H.; KANTHACK, R.A.D. Produtividade e resposta de genótipos de trigo ao boro em solo arenoso do Estado de São Paulo. In: CONGRESSO BRASILEIRO DE CIÊNCIA DO SOLO, 25., 1995, Viçosa. Anais.Viçosa: SBCS, 1995. p.1200-1201.
FURLANI, A.M.C.; MACHADO, C.T.T. Variabilidade e herança da eficiência na absorção e utilização de nutrientes em ambientes marginais, em germoplasma de soja, trigo, arroz e milho. In: ALVARES V., V.H.; SCHAEFER, C.E.G.R.; BARROS, N.F. de; MELLO, J.W.V. de; COSTA, L.M. da (Ed.) Tópicos em ciência do solo, Viçosa: SBCS, 2002. v.2, p.337-391.
FURLANI, A.M.C.; CASTRO, C.E.F. Plantas ornamentais e flores. In: FERREIRA, M.E.; CRUZ, M.C.P. da; RAIJ. B.van; ABREU, C.A. de (Ed.) Micronutrientes e elementos tóxicos na agricultura. Jaboticabal: CNPq; FAPESP; POTAFOS, 2001. p.533-552.
FURLANI, A.M.C.; FURLANI, P.R. Composição e pH de soluções para estudos fisiológicos e seleção de plantas em condições nutricionais adversas. Campinas: Instituto Agronômico. 1988. 34p. (IAC. Boletim Técnico, 121).
FURLANI, A.M.C.; TANAKA, R.T.; TARALLO, M.; VERDIAL, M.F.; MASCARENHAS, H.A.A. Exigência a boro em cultivares de soja.
Revista Brasileira de Ciência do Solo, v.25, p.929-937, 2001.
GUPTA, U.C. Deficiency, sufficiency, and toxicity levels of boron in crops. In: GUPTA, U.C. (Ed.) Boron and its Role in Crop Production. Boca Raton: CRC Press, 1993. p.137-145.
LARGE, E. C. Growth stages in cereals. Illustration of the Feeks scale.
Plant Pathology, v.3, p.128-129, 1954.
MARSCHNER, H. Mineral nutrition of higher plants, 2. ed. New York: Academic Press, 1995. 889p.
RERKASEM, B.; JAMJOD, S. Boron deficiency induced male sterility in wheat (Triticum aestivum L.) and implications for plant breeding.
Euphytica, v.96, p.257-262, 1997a.
RERKASEM, B.; JAMJOD, S. Genotypic variation in plant response to low boron and implications for plant breeding. Plant and Soil, v.193, p.169-180, 1997b.
RERKASEM, B.; JAMJOD, S. Overcoming wheat sterility problem with boron efficiency. In: HORST, W.J.; SCHENK, M.K.; BÜRKERT, A.; CLAASSEN, N.; FLESSA, H.; FROMMER, W.B.; GOLDBACH, H.; OLFS, H.-W.; RÖMHELD, V.; SATTELMACHER, B.; SCHMIDHALTER, U.; SCHUBERT, S.; WIRÉN, N.v.; WITTENMAYER, L. (Ed.) Plant nutrition: food security and sustainability of agro-ecosystems through basic and applied research. Dordrecht: Kluwer Academic, 2001. p.82-83.
RERKASEM, B.; LONERAGAN, J.F. Boron deficiency in two wheat genotypes in a warm, subtropical region. Agronomy Journal, v.86, p.887-890, 1994.
RERKASEM, B.; NETSANGTIP, R.; LORDKAEW, S.; CHENG, C. Grain set failure in boron deficient wheat. Plant and Soil, v.155/156, p.309-312, 1993.
SILVA, A.R. da; ANDRADE, J.M.V. de. Efeito de micronutrientes no chochamento do trigo de sequeiro e nas culturas da soja e arroz em Latossolo Vermelho-Amarelo- fase arenosa. Pesquisa Agropecuária Brasileira, v.18, p.593-601, 1983.
SILVA, A.R. da; ANDRADE, J.M.V. de; SANTOS, H.P. O chochamento do trigo e suas possíveis soluções. Ciência e Cultura, v.32, p.72-78, 1980.