Soybean growth under stable versus peak salinity
Carolina Bustingorri*; Raúl Silvio Lavado
Universidad de Buenos Aires/Facultad de Agronomía – INBA y Cátedra de Fertilidad y Fertilizantes, Av. San Martín 4453, C1417DSE - Buenos Aires, Argentina.
*Corresponding author <[email protected]>
ABSTRACT: The production of soybean (Glycine max L.) has doubled in the last two decades. It is now being grown on both traditional arable lands and on marginal soils, including saline soils, in various parts of the world. Most research on crop tolerance to salinity has been performed using soils with stable levels of salinity. However, there are soils that undergo sudden increases in topsoil salinity for short periods of time. The aim of this study was to compare the effect of stable salinity concentrations with peaks of salinity for their effects on soybean vegetative growth, grain yield, and the accumulation of chlorides. The response of soybean growth was evaluated in pot experiments with the following treatments: Control (non saline soil), soil salinity level of 0.4 S m–1
(0.4S) or 0.8 S m–1
(0.8S), and soil subjected to salinity peaks of 0.4 S m–1
(0.4P) and 0.8 S m–1 (0.8P). The salinity levels were obtained by application of saline irrigation water. Soybean responded differently to stable salinity levels versus peaks of salinity. When salinity was a permanent stress factor, regardless of the salinity level (i.e. 0.4 and 0.8 S m–1
), biomass production and differentiation of reproductive organs was greatly affected. For 0.8S treated plants, they never reached the reproductive phase. Conversely, only small differences in growth data were found between 0.4P and Control treatments, although an 80% decrease in yield was associated with the 0.4P treatment. To obtain a reasonable soybean yield, a leaf chloride concentration of 1 mg g–1 of Cl– in dry matter should be considered a maximum threshold.
Key words: NaCl, Glycine Max L., saline irrigation, yield loss, chloride accumulation
Crescimento da soja sob salinidade estável ou em forma de pulsos
RESUMO: A produção de soja (Glycine max L.) duplicou nas últimas duas décadas. Atualmente está sendo cultivada em terras aráveis tanto nos solos tradicionais quanto marginais, incluindo solos salinos, em várias partes do mundo. A maioria das pesquisas sobre a tolerância das culturas à salinidade foi realizada utilizando solos com níveis estáveis de salinidade. No entanto, há solos que são sensíveis ao aumento brusco de salinidade do solo superficial por curtos períodos de tempo. Comparou-se o efeito das concentrações de salinidade estável com picos de salinidade no crescimento vegetativo da soja, na produção de grãos e no acúmulo de cloretos. A resposta do crescimento da soja à salinidade foi avaliada em experimentos em vasos com os seguintes tratamentos: irrigação com água destilada (Controle, C), a irrigação para alcançar a salinidade de 0,4 S m–1
(0,4S) ou 0,8 S m–1 (0,8S) e irrigação com picos para alcançar a salinidade 0,4 S m–1
(0,4P) e 0,8 Sm–1
(0.8P). A soja respondeu diferentemente aos níveis de salinidade estável contra picos de salinidade. Quando a salinidade foi um fator de estresse permanente, independentemente do nível de salinidade (ou seja, 0,4 e 0,8 S m–1), a produção da biomassa e a diferenciação dos órgãos reprodutivos foram muito afetadas, sendo que plantas tratadas (0,8S) nunca chegaram à fase reprodutiva. Pequenas diferenças nos resultados de crescimento foram encontradas entre 0,4P e tratamentos Controle, apesar de uma diminuição de 80% no rendimento estar associada com o tratamento 0,4P. Para obter uma produtividade de soja razoável, a concentração de cloreto de 1 mg g–1
de Cl–
na matéria seca de folha deve ser considerada um limite máximo.
Palavras-chave: NaCl, Glycine Max L., água de irrigação, produção de colheita, acumulação de cloreto
Introduction
Soybean (Glycine max L.), one of the main crops of the world, has doubled its production in the last two de-cades in parallel with a rising food demand, increasing the pressure on the world’s availability of arable land (USDA, 2008). This is the main reason soybean is now being established not only on traditional arable lands, but also on marginal soils. The expansion of soybean has been documented on saline soils in various parts of the world (Essa, 2002; Scanlon et al., 2005) including Ar-gentina (Nosetto et al., 2009).
the topsoil salinity and return back to its low level after rainfall. This situation is known as salinity peaks, and is often found during the summer season in soils of wet areas and arid areas as well (Dang et al., 2008; Lavado and Taboada, 1988). Another context for the presence of salty peaks is soils suffering an increase in salinity either by irrigation or waterlogging from a saline water source (Chauhan et al., 2008; Gowing et al., 2009; Gupta, 1985).
Sodium (Na) and chloride (Cl) are the major ions in saline soils. Chloride is phytotoxic, however there is great variability in the sensitivity of plants to it, depend-ing on differences in species and genotypes (Brinkman, 1988; Xu et al., 2000). The minimum concentration of soil chloride that has phytotoxic effects on soybeans is still unknown (Dabuxilatu and Ikeda, 2005a; Yang and Blanchar, 1993). The aim of this work was to compare the effect of salinity peaks on soybean growth, grain yield, and the accumulation of Cl– compared to soybean growth under stable salinity levels.
Material and Methods
A pot experiment was established following a com-pletely randomized 2 × 2 factorial design with an addi-tional treatment (Control), 12 replicates for each treat-ment group were setup. Two soil salinity levels (0.4 vs 0.8 S m–1) and two salinity moments (stable vs peaks) were tested, resulting in the following treatments: i) soil irrigated with distilled water during the whole crop cycle as a Control (C); ii) soil irrigated with saline water of electrical conductivity (EC) of 0.4 S m–1 maintained throughout the crop cycle for a medium stable salinity treatment (0.4S); iii) same as (ii) for 0.8 S m–1 (0.8S) ; iv) a medium salinity peak treatment (0.4P), soil irrigated with distilled water for 35 days after sowing , then sub-jected to 15 days of irrigation saline water of 0.4 S m–1 and after that irrigation with distilled water; v) a high salinity peak (0.8P), same as (iv) for 0.8 S m–1 . Saline wa-ter was obtained by addition of NaCl to distilled wawa-ter with the purpose of reaching the desired EC level. When soybeans reached the flowering stage (R1) salty peaks had already ended. To avoid salt accumulation within the pots, the irrigation volume was allowed to exceed field capacity by 20%, all treatments received the same volume of water (0.8 L per pot). To avoid surpassing the desired soil salinity level for each treatment, soil EC within the pots was monitored periodically.
Pots were installed under a shelter with the inten-tion of controlling rainfall but not light. Three soybean seeds (maturity group IV, cultivar: NA 4613) that were previously inoculated were sown in 8 L plastic pots filled with a soil mixture composed by 300 g kg–1 sand, 200 g kg–1 perlite, and 500 g kg–1 A horizon. The former was a sandy loam soil (180 g kg–1 clay, 170 g kg–1 silt, 630 g kg–1 sand) (Typic Argiudoll). Following standard soil test methods (Sparks et al., 1996) it was determined that the soil (A horizon) contained 12.6 g kg–1 of total carbon (Walkey and Black method), a neutral pH of 7.56, a good
content of available P (Kurtz and Bray method), 32.8 mg kg–1, and a low EC
S (0.04 S m
–1). After 15 days, plants were thinned to one plant per pot. To prevent a nutritional deficit, each pot was supplemented with 2 g of triple su-perphosphate and 0.125 g of an all micronutrients mix before sowing. At four intervals during the crop cycle, all pots had 1 g of a soluble fertilizer (N: P: K 25-10-10) added.
At bloom (R1-R2); pod (R3-R4) and maturity (R8) stages (50, 70 and 130 days after sowing, respectively), plant and soil mixture samples were collected from four pots of each treatment group. Plant height, number of flowers, number of pods, and number of grains were re-corded. Aerial biomass, previously rinsed with distilled water, was divided into green and senescent leaves, shoots, pods, and grains. Roots were washed and har-vested. All vegetative samples were dried at 60ºC for 72 h and then weighed. Plant samples were reduced to ashes with Na2CO3 and the remaining residue was ignited and then dissolved with HNO3 and filtered. Both filtrates were analyzed for total chloride content by a volumet-ric titration (AOAC, 1965). After each harvest, soil samples were analyzed for the presence of specific cat-ions (Ca, Mg, K, Na) and ancat-ions (Cl–, SO
4, HCO3) and EC was determined in soil saturation extracts. (Sparks et al., 1996).
The results were evaluated using individual analysis of variance (ANOVA) for each sampling date (R1-R2; R3-R4; R8), corresponding to a factorial design. Treat-ment differences were analyzed by orthogonal contrasts. A regression analysis was used to identify the relation-ship between measured chloride content and soybean grain yield, and the best-fit linear regression was cho-sen (Table Curve 2D; AISN Software, 2000).
Results
For the Control treatment soil ECwas ~0.08 S m–1 throughout the crop cycle. Stable salinity treatments rap-idly reached levels of 0.41 S m–1 and 0.76 S m–1 in average for the 0.4S and 0.8S treatments, respectively. These lev-els were maintained throughout the crop cycle. For treat-ments 0.4P and 0.8P, salinity was initially low, and then reached EC levels of 0.33 and 0.74 S m–1 in average, re-spectively, during the salinity peak, and then the EC lev-els decreased markedly thereafter, reaching similar EC values than those obtained for Control soils. Table 1 pre-sents the soil ionic composition of saturation extracts for each treatment at the first sampling date.
plants and these differences became larger as the growth cycle progressed. At R8, plants subjected to either stable salinity treatments only reached half their height com-pared to the Control. On the contrary plants that un-derwent salinity peak treatments (0.4P and 0.8P) showed differences only 70 days after sowing. Control and 0.4P plants grew at a similar rate (1.2 cm d–1), whereas 0.8P plants did not increase in height.
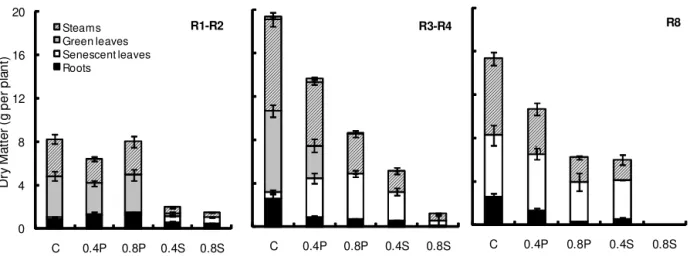
Soybean biomass was drastically reduced by salin-ity. Figure 2 shows the evolution of dry matter produc-tion along the crop cycle; for all saline treatments a re-duction in biomass was evident in all vegetative compo-nents. The results from the ANOVA are presented in table 3. Compared to the Control plants, all saline treated plants showed a 50% reduction in root biomass at all sampling dates. In general, the inhibition of root growth by salinity was less severe than its effect on aerial com-ponents (i.e. green and senescent leaves and shoots), al-though reduced root biomass was particularly evident in plants that underwent stable salinity treatments. Se-nescence occurred suddenly during stable salinity treat-ments with > 70% of the leaf biomass drying out be-fore the second sampling date. On plants receiving a high salinity treatment (0.8S), whole portions of the shoot suf-fered premature onset of senescence. For peak salinity treated plants, senescence became evident at pod stage (R3-R4) with more than 50% of the leaves becoming se-nescent. For Control plants and plants receiving salin-ity peak treatments, 4.5 times more aboveground biom-n
o
I Salinitytreatments
C 0.4P 0.8P 0.4S 0.8S
L q e
m -1
s e t a n o b r a c i
B 3.94 7.92 8.57 9.49 8.18
s e d i r o l h
C 3.28 16.06 61.10 23.14 44.75
m u i d o
S 3.79 19.35 61.43 27.08 47.28
m u i c l a
C 2.04 3.28 5.21 4.13 4.28
m u i s e n g a
M 1.28 2.51 2.85 2.59 2.48
m u i s s a t o
P 0.31 0.25 0.74 0.31 0.31
s e t a h p l u
S ND ND ND ND ND
Table 1 – Soil saturation extract ionic composition 50 days after sowing for Control, (C = 0 S m–1) both salinity peak treatments (0.4P = 0.4 S m–1 and 0.8P = 0.8 S m–1) and both stable salinity treatments (0.4S = 0.4 S m–1 and 0.8S = 0.8 S m–1).
ND = not determined.
s t s a r t n o
C Plantheight
s a d 0
5 70das 130das C×SalinityTreatments ** ** **
l e v e l C
E ×Salinitymoment ns 0.05 ** 4
. 0 ( l e v e l C
E ×0.8Sm–1) ns ns ns
S ( t n e m o m y t i n i l a
S ×P) ** ** **
Table 2 – ANOVA for plant height. Probability values for each analysed contrast.
Significance level: ** = p < 0.01; ns = non significant; das = days after sowing
0 10 20 30 40 50 60 70 80
P
lant
heig
h
t
(c
m
)
days af ter sowing
0.8S 0.4S 0.4P
0.8P
stable salinity
salinity peak
R1-R2 R3-R4 R8
C
Table 3 – ANOVA for biomass production per sampling date and organ. Probability values for each of the analysed contrasts.
Significance level: ** = p < 0.01; ns = non significant; das = days after sowing
s t s a r t n o
C 50das 70das 130das
s t o o
R Leaves Shoots Roots Leaves Shoots Roots Leaves Shoots
C×SalinityTreatments ** ** ** ** ** ** ** 0.07 **
l e v e l C
E ×Salinitymom ns ns ns ns ** ** ns ns ns
4 . 0 ( l e v e l C
E ×0.8Sm–1) ns ns ns ns ns ns ns ns ns
S ( t n e m o m y t i n i l a
S ×P) ** ** ** ns ** ** 0.01 ns 0.02
0 4 8 12 16 20
C 0.4P 0.8P 0.4S 0.8S
D
ry
M
a
tt
e
r (
g per
pl
a
nt
)
Steams Green leaves Senescent leaves Roots
R1-R2
C 0.4P 0.8P 0.4S 0.8S
R3-R4
C 0.4P 0.8P 0.4S 0.8S
R8
b
Figure 2 – Soybean root, leaf and shoot biomass for each treatment (C, 0.4P, 0.8P, 0.4S and 0.8S).
ass had been generated at R1-R2 than for plants under stable salinity. The differences in leaf- and stem-derived dry matter between Control, 0.4P and 0.8P treatment groups grew larger as the growth cycle progressed. Even after salinity was restored back to normal levels, the damage caused by the salinity peak had a long-lasting effect on soybean plants with little or no recovery ob-served for the 0.4P and 0.8P treatments. Finally at R8, 0.4P plants produced 25% less aboveground biomass and around 50% less for 0.8P plants compared to the Con-trol treatment.
Plants in the 0.8S treatment never reached the repro-ductive phase (Table 4). The soybean pod number and its weight for both salinity peaks (0.4P and 0.8P) and stable salinity (0.4S) was reduced (ranging from 30 to 80%, respectively). On the other hand, reduction in yield was more severe; representing between 66 – 86% yield losses compared to the Control. The salinity treatments 0.4S, 0.4P, and 0.8P were not different. Final grain size was not affected by salinity and only some changes be-tween seed weight in favour of the salinity peak treat-ments compared to Control plants (163 vs. 132 g 1000 seeds–1) were found. However due to a great variability in this parameter no differences were found. Total plant yield was strongly correlated with grain number (Y = 0.135x; R2 = 0.99), but no relation was found between grain size and plant yield.
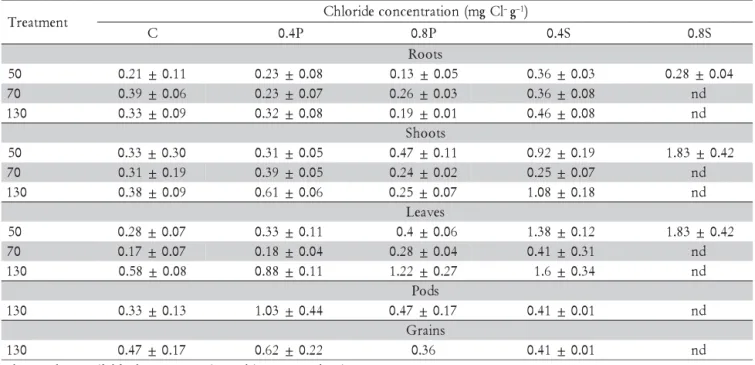
The chloride content in root samples was low and did not vary among treatments (Tables 5 and 6). The
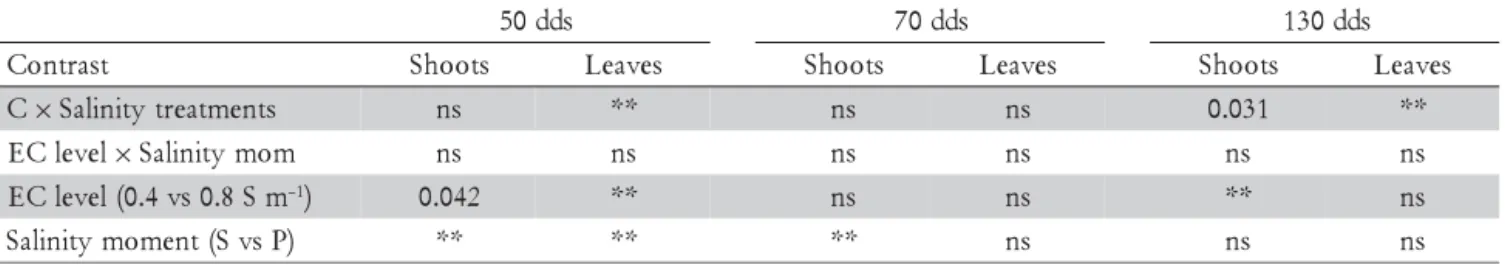
highest overall chloride concentrations were associated with plants receiving stable salinity treatments, with plant leaves and shoots containing greater amounts than the other organs. Stable salinity treatments showed the chloride concentration in leaves to be 2.5 and 3.6 times higher in the 0.4S and 0.8S treatment, respectively, compared to the Control plants. In contrast, the chlo-ride concentrations in the salinity peak treated plants were not different from that levels measured in the Control plants. As leaf chloride concentrations in-creases, crop yield abruptly decreases (Figure 3). A limit value concentration was determined to be ap-proximately 1 mg g–1 Cl in dry matter. Surpassing this threshold would result in severe yield reductions. There was no relationship between chloride content in grains and grain yield.
Discussion
Table 5 – Mean values and standard error for soybean Chloride concentration per organ for all treatments (C, 0.4P, 0.8P, 0.4S and 0.8S) at 50, 70 and 130 days after sowing (das).
nd = no data available due to non existent biomass production.
Figure 3 – Relationship between soybean leaf Chloride concentration for the third sampling date and grain yield.
nd = no data available due to non existent biomass production. Significance level: ** = p < 0.01; ns = non significant.
Table 4 – Mean number of pods and grains per plant; pods and grains dry weight (g DM per plant) and standard errors for each treatment (C, 0.4P, 0.8P, 0.4S and 0.8S) and probability values obtained from the ANOVA.
t n e m t a e r
T Pods Grains
r e b m u
N Weight Number Weight
C 46.0±8.16 58±0.60 96.5±9.45 12.8±1.27 P
4 .
0 34.8±3.65 3.5±0.25 27.2±5.87 4.3±0.36 P
8 .
0 11.4±2.77 1.6±0.11 18.5±7.19 3.1±0.41 S
4 .
0 5.0±0.31 0.8±0.15 13.0±3.00 1.7±0.68 S
8 .
0 nd nd nd nd
A V O N A
C×Salinitytreatments ** ** ** **
l e v e l C
E ×Salinitymom ns ns ns ns
4 . 0 ( l e v e l C
E ×0.8Sm–1) ns ns ns ns
) P s v S ( t n e m o m y t i n i l a
S ** ** ** ns
reports more pronounced effects. Roots seem to be more resistant to soil salinity than aerial biomass which could be linked to its low chloride levels. In this study clear symptoms of the effect of salinity on aerial biom-ass were leaf senescence and premature leaf abscission. These processes had been hypothesized to be part of a plant strategy to adapt to high soil salinity (Larcher, 2003; Maggio et al., 2007; Tardieu and Davies, 1993).
Salt damage in soybean results from the accumula-tion of chloride in stems and leaves (Parker et al., 1983; Wang and Shannon, 1999). Other authors found chloride accumulation in leaves increased with salinity. Leaf chlo-ride values obtained in this work were markedly lower than those found for other soybean cultivars, ranging from 0.7 to 4.45 mg g–1 (Essa, 2002; Jeong-Dong et al., t
n e m t a e r
T Chlorideconcentration(mgCl –g–1)
C 0.4P 0.8P 0.4S 0.8S
s t o o R 0
5 0.21±0.11 0.23±0.08 0.13±0.05 0.36±0.03 0.28±0.04 0
7 0.39±0.06 0.23±0.07 0.26±0.03 0.36±0.08 nd 0
3
1 0.33±0.09 0.32±0.08 0.19±0.01 0.46±0.08 nd s
t o o h S 0
5 0.33±0.30 0.31±0.05 0.47±0.11 0.92±0.19 1.83±0.42 0
7 0.31±0.19 0.39±0.05 0.24±0.02 0.25±0.07 nd 0
3
1 0.38±0.09 0.61±0.06 0.25±0.07 1.08±0.18 nd s
e v a e L 0
5 0.28±0.07 0.33±0.11 0.4±0.06 1.38±0.12 1.83±0.42 0
7 0.17±0.07 0.18±0.04 0.28±0.04 0.41±0.31 nd 0
3
1 0.58±0.08 0.88±0.11 1.22±0.27 1.6±0.34 nd s
d o P 0
3
1 0.33±0.13 1.03±0.44 0.47±0.17 0.41±0.01 nd s
n i a r G 0
3
1 0.47±0.17 0.62±0.22 0.36 0.41±0.01 nd
0 5 10 15 20
0.0 0.5 1.0 1.5 2.0
G
ra
in
y
iel
d
(g
D
M
pe
r p
la
n
t)
Leaf chloride concentration (mg Cl–g–1)
2008), perhaps due to the different chloride extraction method used, in those studies different water extractions were performed whereas in this paper chloride was de-termined on ashed plant samples. However, despite the low values in chloride concentration, differences be-tween treatments were found, and leaf chloride content can be used to predict yield under salinity better than other variables such as plant height, and biomass pro-duction.
When salinity was a permanent stress factor, either for our high or medium EC levels, biomass production markedly decreased and differentiation of reproductive organs was affected. Salt levels of 0.4 S m–1 or higher resulted in little or no grain production. Despite irri-gation with distilled water was re-established before the onset of blooming in both salty peak treatments (0.4P and 0.8P) yield production was markedly reduced. Re-markably, when the crop was subjected to medium level (0.4 S m–1) salinity peak neither size nor biomass was greatly affected, yet the magnitude of the reduc-tion in grain yield was significant. This observareduc-tion represents a dramatic agronomic consequence in the field, where crops may appear healthy, yet yields will be extremely low.
References
AISN Software. 2000. Table Curve 2D Release 5.0 SPSS AISN Software, Chicago, IL, USA.
Association of Official Analytical Chemists. [AOAC]. 1965. Official Methods of Analysis. 18ed. AOAC, Gaithersburg, MD, USA. Brinkman, R. 1988. Saline and sodic soils. p. 62-68. In: International
Institute for Land Reclamation and Improvement. Land Reclamation and Water Management, Wageningen, Netherlands.
Chauhan, C.P.S.; Singh, R.B.; Gupta, S.K. 2008. Supplemental irrigation of wheat with saline water. Agricultural Water Management 95: 253-258.
Cordovilla, M.P.; Ocana, A.; Ligero, F.; Lluch, C. 1995. Salinity effect on growth analysis and nutrient composition in four grain legumes - Rhizobium simbiosis. Journal of Plant Nutrition 18: 1595-1609.
Dabuxilatu; Ikeda, M. 2005a. Distribution of K, Na, Cl, root and leaf cells of soybean and cucumber plants grown under salinity conditions. Soil Science of Plant Nutrition 57: 1053-1057. Dabuxilatu; Ikeda, M. 2005b. Interactive effect of salinity and
supplemental calcium application on growth and ionic concentration of soybean and cucumber plants. Soil Science of Plant Nutrition 61: 549-555.
Dang, Y.P.; Dalal, R.C.; Mayer, D.G.; McDonald, M.; Routley, R.; Schwenke, G.D.; Buck, S.R.; Daniells, I.G.; Singh, D.K.; Manning, W.; Ferguson, N. 2008. High subsoil Chloride concentrations reduce soil water extraction and crop yield on Vertosols in north-eastern Australia. Australian Journal of Agricultural Research 59: 321-330.
Essa, T.A. 2002. Effect of salinity stress on growth and nutrient composition of three soybean (Glycine Max L. merrill) cultivars. Journal of Agronomy and Crop Science 188: 86-92.
Gowing, J.W.; Rose, D.A.; Ghamarnia, H. 2009. The effect of salinity on water productivity of wheat under deficit irrigation above shallow groundwater. Agricultural Water Management 96: 517-524.
Gupta, S.K. 1985. Dynamics of salts in saline water irrigated soils. Journal of the Institute of Engineering 66: 17-22.
Jeong-Dong, L.; Smothers, S.L.; Dunn, D.; Villagarcia, M.; Shumway, C.R.; Carter, T.E.J.; Shannon, J.G. 2008. Evaluation of a simple method to screen soybean genotypes for salt tolerance. Crop Science 48: 2194-2200.
Katerji, N.; van Hoorn, J.W.; Hamdy, A.; Mastrorilli, M.; Oweis, T.; Erskine, W. 2000. Salt tolerance classification of drops to soil salinity and to water stress index. Agricultural Water Management 43: 99-109.
Khajeh Hosseini, M.; Poweell, A.A.; Bingham, I.J. 2002. Comparison of the seed germination and early seedling growth of soybean in saline conditions. Seed Science Research 12: 165-172.
Larcher, W. 2003. Plants under stress. p. 345-450. In: Larcher, W., ed. Physiological plant ecology. 4ed. Springer, Germany. Lavado, R.S.; Taboada, M.A. 1988. Water, salt and sodium
dynamics in a Natraquoll in Argentina. Catena 15: 577-594. Maas, E.V.; Hoffman, G.J. 1977. Crop salt tolerance: current
assessement Journal of Irrigation and Drainage Division 103: 115-134.
Maggio, A.; Raimondi, G.; Martino, A.; De Pascale, S. 2007. Salt stress response in tomato beyond the salinity threshold. Environmental and Experimental Botany 59: 276-282. Nosetto, M.D.; Jobbágy, E.G.; Jackson, R.B.; Sznaider, G.A. 2009.
Reciprocal influence of crops and shallow ground water in sandy landscapes of the Inland Pampas. Field Crops Research 113: 138-148.
Parker, M.B.; Gascho, G.J.; Gaines, T.P. 1983. Chloride toxicity of soybeans grown on Atlantic coast flatwoods soils. Agronomy Journal 75: 439-443.
Scanlon, B.R.; Reedy, R.C.; Stonestrom, D.A.; Prudicz, D.E.; Dennehy, F.K. 2005. Impact of land use and land cover change on groundwater recharge and quality in the southwestern US. Global Change Boilogy 11: 1577-1593.
Shalhevet, J.; Huck, M.G.; Schroeder, B.P. 1995. Root and shoot growth responses to salinity in Maize and Soybean. Agronomy Journal 87: 512-516.
Sparks, D.L.; Page, A.L.; Helmke, P.A.; Loeppert, R.H.; Soltanpour, P.N.; Tabatabai, M.A.; Johnson, C.T.; Sumner, M.E, eds. 1996. Chemical Methods ASA-SSSA Madison, WI, USA.
s d d 0
5 70dds 130dds
t s a r t n o
C Shoots Leaves Shoots Leaves Shoots Leaves
C×Salinitytreatments ns ** ns ns 0.031 **
l e v e l C
E ×Salinitymom ns ns ns ns ns ns
m S 8 . 0 s v 4 . 0 ( l e v e l C
E –1) 0.042 ** ns ns ** ns
) P s v S ( t n e m o m y t i n i l a
S ** ** ** ns ns ns
Table 6 – ANOVA for soybean Chloride concentration per organ for each of the sampling dates. Probability values are expressed per biomass component and sampling date for each of the analysed contrasts.
Received May 29, 2009 Accepted August 13, 2010
Tardieu, F.; Davies, W.J. 1993. Integration of hydraulic and chemical signalling in the control of stomatal conductance and water status of droughted plants. Plant Cell Environment 16: 147-162.
United States Department of Agriculture [USDA]. 2008. Agricultural Baseline: Projections to 2017. United States Department of Agriculture. Available at: http:// www.ers.usda.gov/Publications/OCE081/OCE20081.pdf. [Accessed Jan. 19, 2009]
Wang, D.; Shannon, M.C. 1999. Emergence and seedling growth of soybean cultivars and maturity groups under salinity. Plant and Soil 214: 117-214.
Wang, D.; Shannon, M.C.; Grieve, C.M.; Shouse, P.J.; Suarez, D.L. 2002. Ion partitioning among soil and plant components under drip, furrow, and sprinkler irrigation regimes: field and modeling assessments. Journal of Environmental Quality 31: 1684-1693.
Xu, G.; Magen, H.; Tarchitzky, J.; Kafkaki, U. 2000. Advances in chloride nutrition. p. 97-150. In: Sparks, D., ed. Advances in agronomy, Elsevier, Newark, NJ, USA.