December 2014
PhD in Human Ecology
APPLICATION OF GEOGRAPHIC INFORMATION SYSTEM
AND MODELLING IN HEALTH IMPACT ASSESSMENT
FOR URBAN ROAD MOBILITY IN VIETNAM
If we hold on together,
A
CKNOWLEDGMENTThe completion of this thesis is an enduring process, which could not be accomplished without the help, assistance and encouragement of many people.
First and foremost, I owe a great deal to my promoter, Prof. Dr. Luc Hens, for his invaluable guidance and advice throughout my PhD study in Human Ecology, who has directed me all the way to get to the final thesis. Without his great commitment to accompany me through many years, months and days until the end, it would not be possible for me to get to this day. I thoroughly indebt to his profound support.
To my Vietnamese supervisor, I would like to thank Prof. Dr. Pham Ngoc Ho for his ideas, supervision and support during my studies and work at the Research Centre for Environmental Monitoring and Modelling (CEMM). I also wish to take this opportunity to extend my gratefulness to Assoc. Prof. Dr. Hoang Xuan Co, director, Mr. Duong Ngoc Bach, vice-director, and other staffs at CEMM for their helps in collecting data for my thesis and their collaboration at work.
I would like to thank Prof. Iva Pires for her unconditional helps and full supports. Without her helps, I really cannot make it.
I also appreciate the immense assistance and support provided by various organisations, agencies and local people in Hai Phong. Special thanks go to Dr. Tran Dinh Lan, director, and our colleagues at IMER for their helps in carrying out the survey and collecting the data for my thesis.
I am deeply indebted to the Flemish Interuniversity Council (VLIR) for the needed financial support, without which I would not be able to realise this thesis work. I also appreciate the support and collaboration of the colleagues at the Embassy of Myanmar in Brussels.
Belgium. My gratitude is also extended to many other friends whose names are not listed here but in my heart.
APPLICATION OF GEOGRAPHIC INFORMATION SYSTEM AND MODELLING IN HEALTH
IMPACT ASSESSMENT FOR URBAN ROAD MOBILITY IN VIETNAM
VU VAN HIEU
Abstract
Transport is an essential sector in modern societies. It connects economic sectors and industries. Next to its contribution to economic development and social interconnection, it also causes adverse impacts on the environment and results in health hazards. Transport is a major source of ground air pollution, especially in urban areas, and therefore contributing to the health problems, such as cardiovascular and respiratory diseases, cancer, and physical injuries.
This thesis presents the results of a health risk assessment that quantifies the mortality and the diseases associated with particulate matter pollution resulting from urban road transport in Hai Phong City, Vietnam. The focus is on the integration of modelling and GIS approaches in the exposure analysis to increase the accuracy of the assessment and to produce timely and consistent assessment results. The modelling was done to estimate traffic conditions and concentrations of particulate matters based on geo-references data. A simplified health risk assessment was also done for Ha Noi based on monitoring data that allows a comparison of the results between the two cases. The results of the case studies show that health risk assessment based on modelling data can provide a much more detail results and allows assessing health impacts of different mobility development options at micro level.
However, a number of improvements can be made to further advance the integration. An improved integration programme of the data will facilitate the application of integrated models in policy-making. Data on mobility survey, environmental monitoring and measuring must be standardised and legalised. Various traffic models, together with emission and dispersion models, should be tested and more attention should be given to their uncertainty and sensitivity.
Resumo
O transporte é um sector importante nas sociedades modernas ligando as actividades económicas e o sector industrial. Contudo, a par do seu contributo para o desenvolvimento económico e a conexão social, também causa impactos adversos no ambiente e resulta em perigos para a saúde. O transporte é uma importante fonte de poluição do ar, especialmente em áreas urbanas, e desse modo contribui para problemas de saúde, tal como doenças cardiovasculares e respiratórias, cancros e lesões físicas.
Esta tese apresenta o resultado de uma avaliação ao risco de saúde que quantifica a mortalidade e as doenças associadas à poluição do ar por partículas resultante dos transportes urbanos na cidade de Hai Phong, no Vietnam. O foco da tese é a integração das abordagens e modelação dos sistemas de informação geográfica (SIG) para melhorar a análise de exposição e aumentar a precisão da avaliação, produzindo resultados consistentes e permitindo intervir atempadamente no sentido de minimizar o seu efeitos. A modelação foi feita para estimar as condições de tráfego e da concentração de partículas com base em dados georreferenciados. Uma avaliação simplificada do risco de saúde também foi feita para a cidade de Ha Noi, com base em dados existentes de monitorização do tráfego, permitindo a comparação dos resultados entre os dois casos. Os resultados dos estudos de caso mostram que a avaliação de risco para a saúde com base em dados de modelação pode fornecer resultados mais detalhados e permite avaliar os impactos na saúde de diferentes opções de mobilidade ao nível micro.
escala (secções da cidade) a escalas macro. Também ajuda a visualizar a ligação entre a qualidade do ar e a saúde o que e útil na discussão de diferentes opções de desenvolvimento.
Contudo, algumas melhorias podem ainda ser introduzidas no sentido de facilitar e potenciar ainda mais a integração. Um programa de integração melhorada dos dados irá facilitar a aplicação de modelos integrados na elaboração de políticas. Nesse sentido, os dados sobre a mobilidade, a monitorização e medição ambiental devem ser normalizados e legalizados. Vários modelos de tráfego, juntamente com modelos de emissão e dispersão de partículas, devem ser testados e melhorados e deve ser dada mais atenção à sua incerteza e sensibilidade.
T
ABLE OFC
ONTENTSAcknowledgment ... i
Abstract ... iii
Resumo ... v
Table of Contents ... vii
List of Tables ... xi
List of Figures ... xiii
List of Abbreviations ... xv
CHAPTER 1. INTRODUCTION ... 1
1.1. Literature review ... 1
1.1.1. Urbanisation and urban mobility ... 1
1.1.2. Environmental and health effects of road mobility in urban areas ... 7
1.1.3. Health Impact Assessment ... 18
1.1.3.1. State of the art ... 18
1.1.3.2. Health Impact Assessment in South-East Asia region ... 23
1.1.3.3. Health Impact Assessment in Vietnam ... 26
1.1.4. Environmental health effects of mobility in decision making ... 27
1.2. Problem formulation ... 29
1.2.1. Difficulties in implementing integrated HIA in Vietnam ... 29
1.2.2. Research questions and objectives ... 31
1.2.3. Human Ecology Approach ... 32
1.3. Research framework ... 32
CHAPTER 2. APPROACHES, MATERIALS AND METHODS ... 37
2.1. Study areas ... 37
2.1.1. Hai Phong City ... 37
2.1.2. Ha Noi Capital ... 39
2.2. Air Quality Assessment ... 41
2.2.1. Overview ... 41
2.2.1.1. Transport models ... 42
2.2.1.2. Dispersion models ... 44
2.2.2. Models used in the Hai Phong case study ... 46
2.2.3. Data collection ... 47
2.2.3.1. Spatial data ... 47
2.2.3.2. Traffic data and situation ... 48
2.2.3.3. Demographic data ... 50
2.2.3.4. Pollution monitoring data ... 54
2.2.3.5. Meteorological data ... 55
2.2.4. Model application ... 55
2.2.5. Scenario building for the Hai Phong case study ... 56
2.3. Health Impact Assessment ... 58
2.3.1. Health risk characterisation ... 58
2.3.1.1. Health risks of air pollutants ... 58
2.3.1.2. Respiratory and circulatory health outcomes ... 58
2.3.1.3. Health survey ... 59
2.3.2. Dose-response functions for HIA ... 62
2.3.2.1. PM10 and mortality ... 62
2.3.2.3. Health impact of benzene on mortality and morbidity ... 64
2.3.2.4. Health impact of NO2 ... 65
2.3.2.5. Health impact of noise ... 67
2.3.3. Exposure assessment ... 70
2.3.3.1. Exposure to particulate matters (PM10 and PM2.5) ... 70
2.3.3.2. Exposure to other air pollutants ... 71
2.3.3.3. Exposure to noise ... 71
CHAPTER 3. HEALTH IMPACT ASSESSMENT FOR THE HAI PHONG CASE STUDY ... 73
3.1. Introduction ... 73
3.2. Materials and methods ... 75
3.2.1. Transport scenarios ... 76
3.2.2. Emission and dispersion of pollutants ... 79
3.2.3. Estimation of health effects ... 80
3.3. Results ... 82
3.3.1. Exposure assessment ... 82
3.3.2. Estimation of health effects ... 91
3.3.2.1. Mortality due to PM10 ... 91
3.3.2.2. Morbidity due to PM10... 95
3.3.2.3. Morbidity due to PM2.5 ... 95
3.3.2.4. Mortality impact of benzene ... 96
3.3.2.5. Health impacts of noise ... 96
3.3.3. Uncertainty ... 99
3.4. Discussion ... 100
CHAPTER 4. HEALTH IMPACT ASSESSMENT FOR THE HA NOI CASE STUDY ... 105
4.1. Introduction ... 105
4.2. Materials and methods ... 107
4.2.1. Air monitoring ... 107
4.2.2. Health risk assessment ... 108
4.3. Results ... 110
4.3.1. Air quality ... 110
4.3.2. Health effects ... 112
4.4. Discussion ... 115
CHAPTER 5. DISCUSSIONS AND CONCLUSIONS ... 119
5.1. HIA for traffic in Hai Phong and Hanoi ... 119
5.2. Strengths of the approach ... 121
5.3. Research gaps and improvement opportunities ... 123
5.3.1. Choosing an indicator pollutant for HIA ... 123
5.3.2. The use of modelling and GIS ... 126
5.3.3. Other approaches in HIA ... 129
5.4. Opportunities and challenges to apply integrated modelling and GIS in HIA in Vietnam ... 130
5.5. Relevance to Human Ecology ... 133
5.6. Conclusions ... 136
REFERENCES ... 139
L
IST OFT
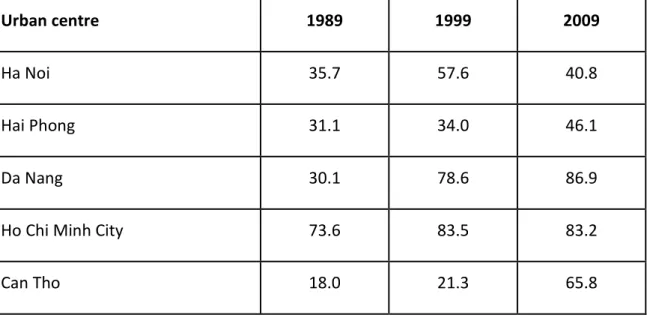
ABLESTable 1. Urban share (%) of the five most important cities in Vietnam ... 5
Table 2. Number of studies in SE Asia and the Far East (Japan and South Korea) by study designs, assessed pollutants and assessed health outcomes ... 24
Table 3. Attributes characterising the transport system ... 48
Table 4. Traffic count results ... 49
Table 5. Demographic data of the Hai Phong urban area ... 51
Table 6. Main demographical data by district in Hai Phong ... 52
Table 7. Measurement locations ... 54
Table 8. Description of transport scenarios developed for this research ... 57
Table 9. Summary of interviewed data ... 60
Table 10. The age-groups of individuals participating in the household survey ... 60
Table 11. Number of people participating in the household survey, grouped by period living at the same address ... 61
Table 12. Number of sampled households by the distance to the main road ... 61
Table 13. Number of sampled people living at the same address grouped by duration 61 Table 14. Number of people grouped by distance to a main road ... 62
Table 15. Risk estimate ... 63
Table 16. Relative Risk (RR) figures for NO2 (acute hospital admission only) ... 65
Table 17. Relative Risk (RR) figures: mortality ... 66
Table 18. Long-term effects of exposure to environmental noise, and information on their observation threshold ... 69
Table 19. Comparison of modelled results with traffic count data ... 78
Table 21. Number of people over 30 years exposed to mean annual concentrations of
PM10 ... 88
Table 22. Modelled population-weighted mean concentration of PM10 per urban commune for all scenarios ... 89
Table 23. Absolute mortality due to PM10 per commune – by scenarios ... 92
Table 24. Number of mortality in the group +30 per district due to PM10 ... 94
Table 25. Number of restricted-activity days due to PM2.5 in each urban district and for the four scenarios. ... 96
Table 26. Number of annual deaths associated with benzene exposure ... 96
Table 27. Attributes used in the calculation of SA and HSD ... 97
Table 28. Impact of noise: severe annoyance and highly sleep disturbance ... 97
Table 29. Attributes used in the calculation of HT and IHD ... 98
Table 30. Impact of noise: hypertension and ischaemic heart disease ... 98
Table 31. Total health effects of noise (DALYs) ... 98
Table 32. Comparison of modelled and observed concentration of PM10 ... 99
Table 33. Dose-response relationship ... 108
Table 34. Emission by vehicle types in Hanoi ... 111
Table 35. Annual concentration of dust (TSP) in Hanoi at five monitoring stations .... 112
Table 36. Absolute mortality due to PM10 in the period 2007-2009 ... 113
Table 37. Evolution of the number of restricted-activity days during PM2.5 over the period 2008-2009 ... 114
L
IST OFF
IGURESFigure 1. Proportion of the urban population in South East Asia, period 1950-2010 ... 2
Figure 2. Evolution of average annual GDP per capita in purchasing power in South East Asia - period 1980-2010 ... 3
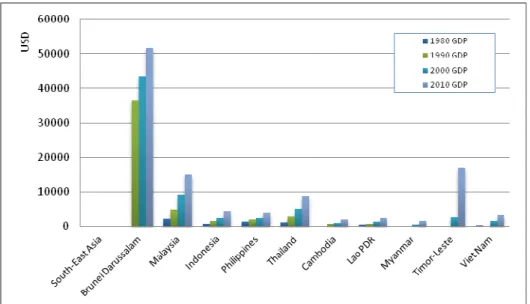
Figure 3. GDP in absolute figures, in term of purchasing power and per capita for 2010 in South East Asia ... 4
Figure 4. GDP growth rate (in purchasing power) vs. urbanisation rate during the period 2000-2010 ... 4
Figure 5. Migration and urban share of the population by province in 2009 ... 7
Figure 6. Annual average concentration of PM10 in major cities in Vietnam for the period 2001-2009 ... 9
Figure 7. Trends TSP concentrations in selected urban areas in Vietnam for the period 2005-2008 ... 10
Figure 8. Trends of the TSP concentrations along selected urban roads in Vietnam for the period 2005-2009 ... 10
Figure 9. Impacts of urban transport on human health - A research framework ... 34
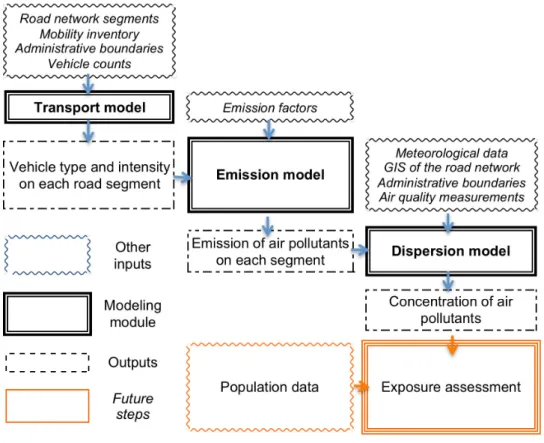
Figure 10. Modelling modules ... 42
Figure 11. Air quality monitoring and traffic count locations ... 49
Figure 12. General structure of the integrated model system ... 75
Figure 13. Modelled mean daily and annual concentration of PM10 for all scenarios .. 86
L
IST OFA
BBREVIATIONS
ADB Asian Development Bank
AQS Air Quality Standard
CEMM Research Centre for Environmental Monitoring and Modeling
COPD Chronic obstructive pulmonary diseases
DALYs Disability-adjusted life years
DoH Department of Health
EIA Environmental Impact Assessment
GDP Gross domestic product
GIS Geographic information system
GTZ German Organisation for Technical Cooperation
HCMC Ho Chi Minh city
HIA Health Impact Assessment
HSD Highly sleep disturbance
HT Hypertension
IHD Ischaemic heart disease
IMER Institute of Marine Environment and Resources
ISC3 Industrial Source Complex model
MDG Millenium Development Goals
MONRE Ministry of Natural Resources and Environment
NEERI Indian National Environmental Engineering Research Institute
NEHAP National Environmental Health Action Plan
NGO Non-governmental organisation
NOAEL No observed adverse effect level
PAHs Polycyclic aromatic hydrocarbons
PM Particulate matter
RR Relative risk
SA Severe annoyance
SEA Strategic Environmental Assessment
TSP Total Suspended Particles
USEPA United States’ Environmental Protection Agency
UTP Urban transportation planning
VLIR Flemish Interuniversity Council
VOC Volatile organic compounds
WB World Bank
C
HAPTER1.
I
NTRODUCTION1.1. Literature review
1.1.1. Urbanisation and urban mobility
World urban areas have been on a non-stop rise since the industrial evolution. They are characterised by a large and dense population with high diversity, and in particular a high proportion of migrants. Urban areas economically rely on non-agricultural activities, such as industry and services, high-tech and information economies. Another dominant character is their concentration: examples include roads, buildings, infrastructure and other constructions. And finally, cities host concentrated administrative units as well as formalities.
Urbanisation arguably increases efficiency, where services can be provided at lower cost to a wider public. This applies to water, food and energy distribution, waste management, public transport, health care, fire service, security control, and administrative services, etc. Over half of the world population lives now in urban area and by 2050, this figure will be 70% (WHO 2012).
The fast urbanisation process during recent decades brought socio-environmental problems and challenges worldwide. Urban areas, especially in developing countries, are poorly managed. This results in a situation where over 50% of the world population faces major environmental, social, governance and health issues. Concentration and intensification fills-up open spaces in cities, eliminates green areas and reduces quality of life of its residents. Meanwhile the extensification process (or urban “crawl”) annexed the surrounding rural areas, where food and supplies are produced. The urbanization process also changes social functions that lead to dividing social classes, the reduction of public spaces, poor perceived safety, the increase of urban poverty and deprivation. Migration rates are often very high in urban areas, where people flog in from rural sites to find jobs and a better-serviced life.
are often transport hubs, with urban mobility at the centre connecting services and amenities a city provides. Therefore, efficiency in urban mobility has always been at the central focus whenever urban development is discussed. Transport of people and freight is essential in modern societies. It provides mobility, allows trade, is an access gate to jobs, markets, education, leisure, and services. It is an essential activity which links sectors and creates networks on which society progresses. Commuting is probably the single most important element of temporary mobility in most cities because of its volume, temporal peaking, regularity and the distances involved. Commuting is necessary for work or study purposes and often accounts for most of the personal transport in the city. However, on the environmental front, pollution, congestion, noise, and resource depletion became dominant characteristics of urban areas. These bring about also environmental health issue such as higher level of respiratory and cardiovascular diseases in urban areas.
In Southeast Asia, the urban population increases since 1950 at uneven rates. Brunei, Malaysia and Indonesia face the sharpest urban population rise, with more than 50% of their total population livings in cities in 2010. In the same year, Vietnam has around 30% of its population living in urban areas (Figure 1).
The United Nations Department of Economic and Social Affairs/Population Division (2012) listed the 125 most populated urban areas worldwide in 2010. Three South East Asian cities landed in the top 20. Ho Chi Minh City of Vietnam is the third most populated urban area in South East Asia, with the reported density of 9450 people/km2, only behind Manila (the Philippines) and Jakarta (Indonesia) (United Nations Department of Economic and Social Affairs/Population Division 2012).
The GDP of the countries in South East Asia increases steadily during the past decades. Brunei Darussalam has the highest GDP among them. In terms of relative GDP per capita - measured using purchasing power - Malaysia has the highest figure in 2010 (Figure 2 and Figure 3) (United Nations Department of Economic and Social Affairs/Population Division 2012).
Figure 2. Evolution of average annual GDP per capita in purchasing power in South East Asia - period 1980-2010 (United Nations Department of Economic and Social
Figure 3. GDP in absolute figures, in term of purchasing power and per capita for 2010 in South East Asia (United Nations Department of Economic and Social
Affairs/Population Division 2012)
Figure 4. GDP growth rate (in purchasing power) vs. urbanisation rate during the period 2000-2010
In Vietnam, the cities are administrative units1. As a rule, they include peri-urban territory, i.e. rural areas. In 1989, three quarters of Ho Chi Minh City was peri-urban, while only a third of Hanoi and Hai Phong were urban centres (Table 1). According to the 2009 Census, the urban proportion of the population in Ha Noi decreased due to the expanded geographic area, when the former Ha Tay province (with mostly rural districts), 4 rural communes of Hoa Binh province and 1 rural district of Vinh Phuc were added to the Hanoi metropolitan area. Hai Phong experienced similar increase of its urban population. The provinces Quang Ninh, Ba Ria-Vung tau, Hai Phong and Da Nang recorded net losses of population in their countrysides but net gains in the urban areas. The Dong Nai, Ha Noi, and Binh Duong provinces dealt with high numbers of migrants coming to both rural and urban areas.
Table 1. Urban share (%) of the five most important cities in Vietnam (General Statistics Office 2011)
Urban centre 1989 1999 2009
Ha Noi 35.7 57.6 40.8
Hai Phong 31.1 34.0 46.1
Da Nang 30.1 78.6 86.9
Ho Chi Minh City 73.6 83.5 83.2
Can Tho 18.0 21.3 65.8
The 2009 census (General Statistics Office 2011) recorded that 6.6 million people migrated within Viet Nam during the period 2004-2009. This is a significant increase as compared to the 4.5 million internal migrants identified in the 1999 census. Data from the Vietnamese National census in 2009 also shows that among the more than 78 million people aged over 5 in 2009, 1.6 million people (2.1%) were intra-district migrants, 1.7 million people were inter-intra-district migrants (2.2%), 3.4 million people (4.3%) were inter-provincial migrants, and a small proportion of only 0.1% (or 40 990 people) were immigrants who crossed national borders. As compared to 1999, inter-provincial migration is still the most frequent type of migration. Also, around a million more people migrated to another province in 2009 than in 1999 (General Statistics Office 2011). The majority of the migrants are young and the number of women is increasing. A majority of the migrants move alone, either because they are not married or because their family stays in their home community. Economic reasons are the most common driver of migration (Marx and Fleischer 2010).
However, it is important to note that the census is an official survey, which does not take into account the common practice of non-registered migration. Many people move to another district/province to work but still keep their original home address without reporting to the arrival commune. This applies especially to people working in private jobs in big cities such as housemaids, shop assistants, and manual labours. Workers in large industrial zones are often controlled more rigorously and consequently their registration as migrants are more accurate and reliable (General Statistics Office and United Nations Population Fund 2004).
city-provinces in Vietnam, the urban area attracts migrants from both its surrounding rural sites and from remote areas. The net migration differences (between in-migration and out-migration) are high in Hai Phong, illustrating its attraction as an important urban centre in Northern Vietnam.
Nearly half of the migrants surveyed in 2004 in Vietnam stated that they faced difficulties after arrival and experienced improper housing, a lack of access to basic utilities such as water and electricity, and insufficient access to jobs and health services, especially insured health care. The survey also revealed that around 40% of migrant experienced a decline in housing quality after moving. Almost 90% of the migrants live in rented accommodation, often in overcrowded migrant lodgings. Migrants live likely in semi-permanent houses and many depend on public ground water and toilets (General Statistics Office and United Nations Population Fund 2004).
Figure 5. Migration and urban share of the population by province in 2009 (General Statistics Office 2011)
1.1.2. Environmental and health effects of road mobility in urban areas
(air, water, soil), and land use (Harrison, 2001; Black, 2003; Rodrigue et al., 2006). Transport is a major source of ground air pollution. In northern Europe, transport contributes nearly 100% of CO, 70% of NOx, and 40% of PM10 of the immission values
(WHO 2000). The traffic-related fraction of PM10 amounts to 43% in Austria, 56% in
France, and 53% in Switzerland (Kunzli et al. 2000). Motor vehicles are the largest source of PM10 emissions in most Asian cities (Faiz and Sturm 2000). Studies in New
Delhi (India), Bangkok (Thailand), Beijing (China), Hong Kong, Manila (Philippines) and Jakarta (Indonesia) show a high contribution of vehicles to the concentration of particulate matter, ranging from 40% to 80% (Bruce, Perez-padilla, and Albalak 2000; Bruce, Perez-Padilla, and Albalak 2002; Syahril, Resosudarmo, and Tomo 2002; WHO 2003; Kan and Chen 2004; Cheng et al. 2007; Sagar et al. 2007; Walsh 2002).
Motorcycles are today the prevailing way of transport in particular in fast growing cities. In 2006, motorcycles served 65% of the transport needs in Hanoi and 80% in HCMC, respectively, while cars made up 4% (Hanoi) and 6% (HCMC). In 2009, about 27.2 million motorbikes and 1.09 million automobiles were registered in Vietnam. Forecasts by the Industry Policies and Strategies Research Institute under Ministry of Industry report that there will be 31 million motorbikes in circulation by 2015 and 35 million in 2020.
Vehicle density (per 1,000 people) is the second highest in Vietnam of the developing Asian countries. The average annual growth stands at 15.1%. This is attributed to the rising incomes, which are associated with higher levels of vehicles ownership and usage (Timilsina and Shrestha 2009). The steady increase in motorisation leads to increased fuel consumption. The average annual growth rate of fuel consumption during the period 2002-2010 in Vietnam is 13.1%.
In a study composing 6 Asian countries on PM emissions, Vietnam ranks the last (Clean Air Asia 2012)2 with a total of 11.6 thousand tons of PM emissions due to road transport. Vietnam also showed the steadiest growth in PM emissions during the period 2005-2010 with an average annual growth rate of 8.6%. Two wheelers
2
contribute around 46% of the total road transport CO2 emissions in 2010 in Vietnam,
the highest figure in developing Asia. Freight transport accounts for around 32% of the total, while buses and passenger cars account for the remaining 22%. As compared to the other developing Asian countries, Vietnam is an exception as in most others, light and heavy commercial vehicles account for most of the emissions (Clean Air Asia 2012). According to the estimates of Clean Air Asia (2012), freight vehicles account for 57% of the total road transport emissions in PR China and 54% overall in Asia.
Figure 6 shows the trends of PM10 pollution in the 4 largest cities in Vietnam
(Da Nang, Ha Noi, Hai Phong and Ho Chi Minh City). The general trends decline, except for a slight rise in Da Nang. However, in all three cities where PM10 decreases, the
annual average is still above the Vietnamese Air Quality Standard. Da Nang is the only city of the four which still meets the standard despite a slight increase in its PM10 in
2009. All four cities have higher than the 20μg/m3 guideline of WHO.
Figure 6. Annual average concentration of PM10 in major cities in Vietnam for the
period 2001-2009
Note: Both WHO Guidelines and Vietnam Air Quality Standard (AQS) did not have
values for PM10 prior to 2005. Earlier, Vietnam AQS used the guideline for total
As for dust, the annual average concentration of total suspended particles (TSP) in the air of the main cities in Vietnam is much higher than the standard during the period 2005-2008. When considering only the effects of road transport, the concentrations of TSP along some main roads exceed 4 times the standard (Figure 7).
Figure 7. Trends TSP concentrations in selected urban areas in Vietnam for the period 2005-2008 (Bộ Tài Nguyên và Môi trường Việt Nam 2011)
Figure 8. Trends of the TSP concentrations along selected urban roads in Vietnam for the period 2005-2009 (Bộ Tài Nguyên và Môi trường Việt Nam 2011)
1992b; Xu et al. 1994; K Katsouyanni et al. 1997; Samet et al. 2000; Burnett et al. 1998; Michelozzi et al. 1998).
Studies by the World Bank, WHO, and the Chinese Academy for Environmental Planning on the effects of air pollution on health concluded that between 350,000 and 500,000 people die prematurely each year as a result of outdoor air pollution in China (Chen et al. 2013). However, this figures score below earlier estimate, which indicated that airborne particles smaller 2.5 microns in diameter (PM2.5) might cause 1.2 million
premature deaths in China in 2010 alone (WHO 2014).
Air pollution is known causing cardiovascular diseases, reduced lung function, cancer, respiratory problems, and effects on mental health. Noise and sedentary lifestyle are associated with indirect health effects as sleep disturbance and diabetes. The top 20 causes of mortality (MDG regions) for South Eastern Asia using DALYs show changes in the main causes between 2000 and 2011. Road injury jumped from 7th place in 2000 to 5th place in 2011, accounting for 3.7% of the total DALYs in 2011 as compared to 3.1% in 2000. Chronic obstructive pulmonary diseases (COPD) remain in the 10th place while lower respiratory infections move from the 1st place to the 3rd one. People in South East Asia are more prone to mortality due to road injury than the world average. However, forecasts show that road injury will become less prominent as a leading cause of mortality in South East Asia during the years to come. On the other hand, lower respiratory infections, which are related closely to air quality, will be responsible for more DALYs in the future (6.5% in 2015 and 6.0% in 2030) (WHO 2014).
Health effects of traffic-related air pollution are related to both individual substances (e.g. CO, SO2, O3, etc.) and to mixtures (diesel exhaust). Each substance or
mixture has its own characteristics and may affect human health differently. Understanding the mechanism how and the extent to which a pollutant affects human health is important in assessing risks. In addition, traffic noise may also have adverse effects and is also considered as a pollutant in this study.
during exercise), acute pulmonary, cerebrovascular and behavioural effects, and developmental toxicity. Once the carboxyhaemoglobin level in the blood exceeds 2% this might result in coma, eventually followed by death.
Oxides of nitrogen (NOx) (primarily nitric oxide (NO) and nitrogen dioxide
(NO2)) are gases formed by the oxidation of nitrogen in the air at high combustion
temperatures, and therefore contributed by combustion engines (vehicles, ships, etc.) and other incineration processes. Nitric oxide is oxidised to NO2 in the ambient air. It
has morbidity and mortality effects, especially in susceptible groups (young children, people with asthma, chronic bronchitis and related conditions) (Morris and Naumova 1998). NO2 has direct effects on the lung, leading to an inflammatory reaction on the
surface of the lung tissue (Streeton 1997). Increased lung cancer incidence has been reported in a large case-control study (Nyberg et al. 2000), but NO2 was primarily used
as an indicator of air pollution exposure from vehicle emissions, and so other air pollutants from vehicles may have caused cancers.
Human controlled exposure studies allowed defining no observed adverse effect level (NOAEL) concentrations: the recommended short-term guidance value for a one-hour average NO2 daily maximum concentration is 200 µg/m3 (0.11 ppm). The
recommended long-term guidance value, based on epidemiological studies of increased risk of respiratory illness in children, is 40 µg/m3 (0.023 ppm) annual average (WHO 2006a).
Ground-level ozone is a secondary air pollutant formed by reactions of nitrogen oxides and volatile organic compounds mediated by sunlight. These primary emissions arise mainly from motor vehicles. Ozone is a photochemical oxidant (commonly called photochemical smog). Urban areas tend to have high levels of ozone pollution during sunny periods under stable weather conditions.
Its toxicity occurs in a continuum in which higher concentrations, longer exposure, and more activity during exposure causes more adverse effects. There is no indication of a threshold concentration for health effects (Streeton 1997). Substantial acute effects occur during exercise with one hour exposure to ozone concentrations of 500 µg/m3 or higher. WHO (2006) suggests the air quality guideline of 100 µg/m3 8-hour mean of ozone. Time-series studies indicate an increase in daily mortality in the range of 0.3–0.5% for every 10 µg/m3 increment in 8-hour ozone concentrations above an estimated baseline level of 70 µg/m3 (WHO 2006a).
Sulphur oxides (primarily SO2 and limited quantities of sulphur trioxide (SO3))
are gases formed by the oxidation of sulphur contaminants in fuel during combustion. The main traffic source of SO2 is diesel combustion, e.g. from trucks and ships. SO2 is a
potent respiratory irritant, and is associated with increased hospital admissions for respiratory and cardiovascular disease (Bascom et al. 1996), as well as mortality (K Katsouyanni et al. 1997). Asthmatics are a particularly susceptible group. A threshold concentration for adverse effects in asthmatics after short-term exposures to SO2 (570
μg/m3 during 15 minutes) has been described (Streeton 1997). WHO (2005) recommends a 24-hour guideline of 20 μg/m3.
Volatile organic compounds (VOCs) are hydrocarbons include benzene, toluene, xylene, 1,3-butadiene, polycyclic aromatic hydrocarbons (PAHs), formaldehyde and acetaldehyde. Motor vehicles are the most important sources of VOCs in urban areas. Special attention should be given to benzene, a carcinogen causing leukaemia in humans. The potential health impacts of VOCs include carcinogenic and non-carcinogenic effects (e.g. damage to the central nervous system and skin irritation) (Fisher et al. 2002). Health effect data and guidelines/standards for hazardous air pollutants have been reported (Chiodo and Rolfe 2000), and include recommended air quality guidelines for benzene of 3.6 µg/m3 by 2010 (when the
"Particulate matter", also known as particulate pollution or PM, is a complex and varied mixture of small particles and liquid droplets. Particle pollution is made up of acids (such as nitrates and sulphates), organic chemicals, metals, and soil or dust particles. The size of the particles is directly linked to the health problems they cause. The United States’ Environmental Protection Agency (USEPA) is concerned about particles of 10 micrometres in diameter or smaller, because these pass through the throat and nose and enter the lungs. Once inhaled, these particles can affect the heart and lungs and cause serious health effects. Based on this criterion, there are two categories of PM:
"Inhalable coarse particles," such as those found near roads and in dusty (e.g. cement) industrial plants, are larger than 2.5 micrometres and smaller than 10 micrometres in diameter. "Fine particles", such as those found in smoke and haze, are 2.5 micrometres in diameter or smaller. These particles can be directly emitted from sources such as forest fires, or can be formed when gases that are emitted from power plants, industries and automobiles react in the air.
Particles, in particular PM10, have been the subject of many epidemiological
studies and, more recently, many reviews of these studies. The studies, in various parts of the world with different climates, socio-economic status, and pollution levels, consistently showed that 24-hour average concentrations of PM10 are related with a
variety of health impacts. Among other they cause increased respiratory symptoms, such as irritation of the airways, coughing, or difficulty breathing, for example; decreased lung function; aggravated asthma; chronic bronchitis; irregular heart rhythm; non-fatal heart attacks; and premature death in people with heart or lung disease (Dockery et al. 1993; C A Pope, Dockery, and Schwartz 1995; Krewski et al. 2005; Zanobetti et al. 2002; Fisher et al. 2007; Anderson et al. 2004). These relationships are causal.
People with heart or lung diseases, children and older adults are most likely to be affected by exposure to particles. However, even in healthy people, temporary symptoms arise following exposure to elevated levels of particle pollution. Fisher et al. (2007) suggest the threshold of the PM10 exposure level for mortality effect is set at
that each increase in PM10 will increase the risk of contracting a health complication,
notable COPD, respiratory hospitalisation or a simple restricted-activity day.
Transportation also causes noise. Health impacts of noise include among others annoyance, impaired communication and increased aggression. Other adverse effects are reduced school performance, disturbed sleep and moodiness, as well as cardiovascular effects and hearing impairment. ‘Annoyance’ can be defined as ‘any feeling of resentment, displeasure, discomfort and irritation, occurring when noise intrudes into someone’s thoughts and moods when contemplating or interferes with an activity’ (Passchier-Vermeer and Passchier 2005). The degree of annoyance increases with increasing sound levels. WHO (2000) points out that people are moderately annoyed at 50dB LAeq, while at 55dB LA’s serious annoyance occurs. These
data are only applicable during the daytime. At night, the threshold for being annoyed is lower, and will be discussed as a sleep disturbance effect (see below). Noise can cause sleep disturbances especially when sound levels above 30dB LAeq (steady-state
continuous noise) or 45dB LAmax (noise events) are reached (WHO 2000). There are
many ways in which sleep disturbance manifests itself. First of all, noise can affect sleeping behaviour, sleep pattern, and physiological responses. The effects can be divided into three groups: primary effects, secondary effects and long-term effects. Primary effects include "difficulties in falling asleep, awakenings, sleep stage changes and instantaneous arousal effects during sleep (temporary increase in blood pressure, heart rate, vasoconstriction, release of stress hormones in the blood, increased motility)" (Nicolopoulou-Stamati et al. 2005). Secondary or after effects are measured the next day and include "decrease of perceived sleep quality, increased fatigue and decrease in mood and performance". Long-term effects on well-being include ‘increased medication use or chronic annoyance’ (Nicolopoulou-Stamati et al. 2005). Ischaemic heart disease and hypertension are also effects associated with noise exposure. Sound levels above 65 to 70dB LAeq during the daytime offer a risk, although
these effects are rather small (de Kluizenaar et al. 2007).
uncontrollable, intrusive recollections. The accidents caused by increased road traffic became a major public health issue. For example, in Europe, accidents cause about 34,500 deaths per year in 2009 (Eurostat 2014). This number only includes deaths caused by accidents and does not include people injured in road traffic crashes, neither it includes the psychological effects of accidents. Victims of accidents often experience an increasing fear of traffic and as a result they prefer the car above walking or cycling, which results in a decrease of physical activity. In Europe, pedestrians account for around 25 to 30% of deaths and 13% of the injuries in all accidents, while cyclists account for 5 to 6% of deaths and 7 to 8% of the injuries. Over 60% of deaths and 60% of the injuries are people driving a car (WHO 2000). The world’s fatality rate is 19 deaths per 100,000 people, with much lower rates in high-income countries. For Vietnam, a total of 20,774 incidents were reported in 2003, leading to 12,864 deaths, 20,704 injuries and millions of USD in costs (WHO 2004).
In Vietnam, the number of road traffic fatalities increased from 4,907 in 1994 to 11,534 in 2005. The road traffic fatality rate (number of deaths per 100,000 population) is 26.7. Motorcycles account for the highest proportion (59%) of road traffic collisions, followed by bicycles/tricycles (24%), pedestrians (11%) and motor vehicles (4%) (Ministry of Health of Social Republic of Vietnam 2006). In 2003 alone, a total of 20,774 incidents were reported, leading to 12,864 deaths, 20,704 injuries and millions of USD in costs. Traffic accidents have increased steadily over the period 2000-2007. It is important to note that for most of the deathly traffic accident cases, there is no hospital record. Also, minor cases are also not properly recorded. And in both situations, not all traffic accidents are recorded. Many minor accidents are not reported, especially when no serious injuries occurred. Also, many people with minor injuries do not seek help from hospitals. As the number of traffic accidents was accounted differently by different agencies and there is no cross-reference between them, the accurate number of traffic accidents in Vietnam is difficult to estimate.
accident, and one third have clinically significant symptoms at follow-up 18 months after an accident’ (WHO 2000). Also the development of avoidance techniques – e.g. keeping away from situations that trigger recollections of the event – and a creation of excessive arousal could result in sleep difficulties, poor concentration and disturbed memory (WHO 2000).
Transportation also has negative impacts on mental health and wellbeing
aside from mental problems caused by accidents. Air pollution of leaded petrol causes cognitive development impairment in children, increased aggression and stress, the reduction of social life, especially among elderly, a decrease of physical activity among children which contributes to sedentarism, that in turn results in other health impacts such as weight gain and physical weakness. Lead has neurotoxic impacts on human beings, but it is only recently found that those effects occur at much lower exposure levels than previously presumed. Scholars also concluded that children are particularly vulnerable since they have greater intakes of lead than adults and they also absorb and retain lead easier (WHO 2000). Even the cognitive development of the foetus experiences adverse effects of lead (Moshammer, Hutter, and Schmidt 2005). Today, most countries switched to unleaded petrol, although there are still communities where leaded petrol has not yet been phased out. Leaded petrol was phased out in Vietnam in 2001 and the concentration of lead in the air declined systematically since then.
People exposed to high noise levels get annoyed and as a result they become stressed. Children experience difficulties with school performance. They are less motivated, have concentration problems, and show a poorer reading ability. Transport also shows direct influences on mental health and wellbeing. There are still other aspects of transport that cause stress, for example traffic congestions make people frustrated in particular when they are in a hurry. The outcome is increased blood pressure, aggressive behaviour and increased likelihood of crashes (WHO 2000).
need, deficiency leads to social isolation. Lack of social support increases mortality from coronary heart disease by up to four times (WHO 2000).
The psychological effect of the “perceived safety’ also leads to using less vulnerable modes of transport such as walking and cycling. One of the consequences is the people, especially children, are less physically active. Long period of inactivity leads to sedentarism. The effects of sedentarism include: a decrease of cardio-respiratory fitness, a decrease of stress tolerance, a decrease of independence in old age, constraints on child development (fewer children walk or cycle to school), an increase of neuro-degenerative diseases and a decreased control of body weight that can lead to obesity (Nicolopoulou-Stamati et al. 2005). Obesity is associated with cancer, heart diseases, depressions and asthma in the long run. Thirty minutes of walking or cycling a day is enough to reduce the risk of developing cardiovascular diseases, diabetes and hypertension. Furthermore, it helps to control blood lipids and body weight (WHO 2000).
1.1.3. Health Impact Assessment
1.1.3.1. State of the art
disadvantaged (Harris-Roxas et al. 2012; Veerman, Barendregt, and Mackenbach 2005).
The standard HIA procedure includes four steps: Risk characterization – Dose-Response Assessment – Exposure Assessment – Risk/Impact Assessment. Risk characterisation is the process of identifying the hazards linked to an air pollutant. The main aim is documenting whether an agent causes adverse effects on human health. Risk characterisation is based on a literature review. Health impacts related to transportation link health outcomes with transport activities. Air pollutants are associated with a wide range of health problems including acute pulmonary effects, cerebrovascular and behavioural effects, and respiratory and cardiovascular diseases. Dose-response assessment establishes a quantitative relationship between the dose of a pollutant that an individual exposed to (exposure) and the experienced health. Dose-response functions are established using epidemiological data (Kunzli et al. 2000; S Medina et al. 2005; Fisher et al. 2002; Fisher et al. 2007). Exposure assessment is the process which quantifies the magnitude, frequency and duration expose to a particular pollutant. Both direct and indirect exposure matters. Direct exposure quantifies the pollutant concentrations reaching an individual. The concentrations of the pollutant are directly measured on or in body fluids of the person (at the point of contact, biological monitoring, or biomarkers). The three methods provide data on different aspects of exposure. The point of contact approach indicates the total concentration reaching the subject, while the other two show the amount of the pollutant present in the body. The indirect approach measures the pollutant concentrations in various locations or during specific human activities to predict the exposure in a population.
in the assumptions made during the study, the time-activity data, or the measured pollutant concentrations.
HIA can be done quantitatively or qualitatively. A combination of these two can also be used. Quantitative approaches quantify health outcomes as changes in health determinants due to policy interventions or changes in the exposure to pollutants. This approach estimates changes in environmental factors and predicts possible health outcomes based on risk assessment. The quantitative approach mainly uses epidemiological and toxicological risk assessment data to determine health outcomes, and is therefore widely used to calculate health risks in relation to exposure to pollutants in the environment. Health risks related to traffic or water pollution are some of the examples (Mindell et al. 2001; Veerman, Barendregt, and Mackenbach 2005; O’Connell and Hurley 2009).
approaches is used to determine the health impacts of policies, programmes, plans and projects (Love et al. 2005).
From the legal point of view, both compulsory and voluntary HIA procedures exist. Compulsory HIAs are those conducted according to legal requirements. Health aspects can be regulated using laws and regulations which focus on health (such that those concerning public health or disease control) or through those regulating socio-environmental determinants which affect human health (such that those controlled by EIA/SEA regulations). Voluntary HIAs are performed independent of those requirements, especially in the cases where EIA/SEA does not integrate HIA (Harris-Roxas and Harris 2011). Although legal HIA procedures are important in ensuring that health concerns are mainstreamed and that HIAs are conducted following a prescribed process which can be controlled for legal purposes, this type of HIAs puts most emphasis on the scientific aspects identifying potential health impacts and often faces legal disputes. This entails that practitioners of legally embedded HIAs need to be accredited and the roles, responsibilities and accountabilities of proponents, regulators and practitioners are clearly defined. Comprehensive quality guidelines for conducting, reporting and assessing HIAs need to be available (Harris-Roxas and Harris 2011; Fredsgaard, Cave, and Bond 2009). The legal process can be complicated and takes a long time. On the other hand, voluntary HIAs are merely based on the voluntary willingness of HIA practitioners and will not be subjected to the [rigid] process foreseen by the law. Practitioners will decide and choose which type of HIA is most suited for the subject at hand. However, the weakness of the voluntary approach is in its quality control, especially when the results of the HIAs will be reported in a lobbying context.
Depending on the type of HIA, different initiators exist. Often, when HIAs are required by law, the initiator is defined. Similar to any EIA or SEA, project promoters are often the initiators of HIA. On the contrary, when HIAs are voluntary, initiators of HIA vary. They can be health activists, NGOs promoting healthy environment, or the authority that proposes the action.
Although HIA has its roots in EIA, which is mostly project-driven, HIA can also be expanded to plans, programme and policy. This changes health from a component in effects of a project into a determinant of the policy, plans or programme (Mahoney and Durham 2002). While for a project assessment, HIA targets health as a component of many other issues, policy-linked HIA puts the whole focus on health. This is often done at two occasions. At first when health is the goal of the policy in question, and at second is when health is not the immediate goal but there is a need putting health on the agenda. Using HIA for both projects and policies has a common goal ensuring that the project or policy will not result in or mitigate the adverse health impacts on the community. Nevertheless, the approach to HIA for projects and for policies varies. It is currently unclear how communities should be involved in the HIA process in the most efficient way, either at project or at policy level.
1.1.3.2. Health Impact Assessment in South-East Asia region
In many countries of South-East Asia, HIA has been implemented, although with differences in approach. In most countries, including Cambodia, Lao PDR, and Malaysia, HIA is conducted on a project-by-project basis as part of Environmental Impact Assessment (EIA). If indicated, policy decision integrates health and environmental impacts. Thailand uses a public policy process on HIA both for strategic and projects EIA. HIA can be initiated both by local communities and local governments. Both in Thailand and Vietnam, HIAs are conducted ad-hoc in various cases. The assessments vary in scope and size: they range from national policies on transportation, agriculture and energy, to public health and disease control programs.
A meta-analysis of 421 peer-reviewed reports addressing the health aspects of pollution were published in 11 Asian countries since 1980 showed effects on daily mortality and hospital admissions (PAPA-SAN 2008). Among these 421 HIAs no Vietnamese study is included.
China published over 200 studies during the last 25 years (including those performed in Hong Kong and Taiwan) (PAPA-SAN 2008). Most of the reports concern metropolitan areas or industrial cities. The main health outcomes dealt with the relationship between ambient pollution and respiratory symptoms and disease, mortality and hospital admissions. Most HIAs examined the health effects of exposure to PM, NOx, and SO2. Many studies examined the combined exposure to PM and other
In other industrialised countries in East Asia such as Japan and South Korea, research focused on respiratory symptoms and disease, mortality, hospital admissions, lung cancer incidence, birth outcomes, school absence, eye disease, atopic dermatitis, and biomarkers. Most were cross-sectional and time-series studies. About two-third of the reports estimated the health effects of exposure to PM, gaseous pollutants, or both.
In Southeast Asia, health impact studies exist for Indonesia (9 reports), Malaysia (3 reports), Singapore (10 reports), and Thailand (26 reports), but no reports were identified from Bhutan, Burma, Cambodia, Nepal, Philippines, or Vietnam. The prevalent approach used in the identified reports is the evaluation of the health consequences and the economic effects of exposure to ambient pollution. Panel, cross-sectional, and time-series methods are used to study health outcomes including respiratory symptoms, respiratory disease, and mortality. Studies in Singapore assessed children’s respiratory symptoms and diseases, such as asthma. In Thailand, most studies concern Bangkok and the nearby areas estimating the health effects of exposure to PM and gaseous pollutants. The majority of these studies focus on the effects of exposure to PM only.
Table 2. Number of studies in SE Asia and the Far East (Japan and South Korea) by study designs, assessed pollutants and assessed health outcomes (adapted from
PAPA-SAN 2008) (Number in brackets is the number of studies)
Study designs Assessed pollutants Assessed health outcomes
Case–control (10) Case–crossover (20) Cohort (27)
Cross sectional (168) Ecologic (23)
Health impact (43) Panel (28)
Time series (99)
Particulate matter and gaseous pollutants (216) Particulate matter only (49)
Gaseous pollutants only (29)
Birth outcomes (23) Hospital admissions, visits, and discharges (46) Mortality (99)
Cross-sectional studies are the most commonly used methods to study the health effects of long-term exposure to air pollution. They study the prevalence of chronic respiratory symptoms and disease or on chronic impairment of pulmonary function (PAPA-SAN 2008). Over one third of all studies identified used this approach. The disease status and exposure to air pollution of the population at a fixed point in time are determined to calculate the effect of exposure on the prevalence of disease. The weakness of this approach is that it is often not possible to determine the temporal relationship between exposure and disease. Case–control, case–crossover and cohort studies are less frequently used in the region. They cover only 10% of the total number of published studies. These approaches are used to calculate the relative risk of disease. The relative risk of a disease or mortality that is associated with a particular exposure factor can be calculated based on the cases people developed or died from according to their exposure to air pollution. Also other confounding factors are taken into account in quantifying the risk. In case–control studies, the relation between air pollutant concentrations and the number of people who were free of the disease at the time that they became ill or died is studied. In case–crossover studies, the relation between the number of cases of particular diseases that occur in a population due to short-term exposure to air pollution is assessed. The effects of prolonged exposure to air pollution on mortality and morbidity of chronic disease can be estimated studying cases over long time (cohort study). These three approaches are all time- and effort consuming and require large samples.
Particulate matter is the most frequently studied air pollutant. Particulate matter can be studied as Total Suspended Particles (TSP), as PM10 or as PM2.5. However, most of
the studies on the health effects of particulate matter focus either on PM10 or TSP.
Studies on PM2.5 are scarce. Particulate matters are often studied together in
combination with other gaseous pollutants as SO2, NOx and ozone (PAPA-SAN 2008).
et al., 2008, 2007). Most of economic studies on HIA in South East Asian during the period 1990-2007 used PM as the main indicator (PAPA-SAN 2008).
1.1.3.3. Health Impact Assessment in Vietnam
The health effects of economic and development activities in Vietnam are merely assessed using empirical surveys in which personal exposure to air pollution is related with health outcomes. These outcomes are obtained using health surveys (health status questionnaires, clinical assessment of criteria health outputs and hospital records) to determine the current level of impacts and to project the expected future impacts. This research strategy was used to study the health impacts of traffic in Ho Chi Minh City and Hanoi (Vo 2005; Vo and Nguyen 2007). Health impacts of other sectors (industry, constructions, etc.) were studied in similar way (Cao and Pham 2007; Chu 1996; MONRE 2008; Pham 2005; Sumi, Le, and Vu 2007).
The project Air Pollution, Poverty, and Health Effects in Ho Chi Minh City (HCMC), which was funded by Asian Development Bank (ADB) during the period 2005-2008 used three methods of assessment. A hospital-based study estimated the effect of short-term exposure to air pollution on hospital admissions for respiratory illnesses among children under five years in HCMC during the period January 2003-December 2005 (Le et al. 2012). The study used daily average exposure to PM10 and ozone as environmental
parameters. The socioeconomic position (SEP) of the children’s families was assessed based on the administrative information of the hospital and the location of their residence. A time series analysis and a case-crossover analysis were performed. The study results showed the association between the exposure to PM10, ozone, nitrogen
dioxide (NO2) and sulfur dioxide (SO2) and hospital admissions for the young children in
on the poor. The study suggests to integrate air quality management in the relevant sector development planning at all levels (HEI Collaborative Working Group on Air Pollution; Poverty and Health in Ho Chi Minh City 2012).
Different research strategies assessing health impacts of urban air pollution exist (Cao and Pham 2007). A combination of both qualitative and quantitative studies is indicated, including epidemiological studies which combine health surveys with air quality monitoring and cross-sectional analysis. Health impacts are estimated based on dose-response functions. In this research, no indicator pollutants are suggested. Dust and other gaseous pollutants are considered together.
1.1.4. Environmental health effects of mobility in decision making
Urban air pollution contributes to approximately 800,000 deaths and 6.4 million lost life-years worldwide in 2000 and two-thirds of these losses occur in developing countries of Asia (WHO 2012). Such estimates drive relevant environmental policies. While it is clear that air pollution due to road transport, especially in urban areas, affects health of the population, the extent of these risks often less clear. Nevertheless this information is of core impotence for planners and decision-makers when deciding on the options for future development.
In the ASEAN policy space, the concept of HIA is known, but it is not based on well developed policy or regulation. In contrast with EIA which is well embedded in laws, HIA is hardly regulated (As reported in the 2nd Workshop on “Constructing a Caring and Sharing Community: Roles of HIA” in 2012 (http://www.hiainasean.org). In all ASEAN countries, except Thailand, HIA is part of the EIA process. In Thailand, a separate HIA policy is part of the Health Promotion Act. However, in other countries such as Cambodia and Vietnam, HIA entered the national policy with the National Health Action Plan (in Vietnam) or National Committee on Health (in Cambodia). These events resulted in the formulation of guidelines and regulations on HIA (Petcharamesree 2012; Prak and Khuon 2012; Sriwongsa 2012; Anon. 2012a; Anon. 2012b; Nguyen, Danh, and Anh 2012).
In Vietnam, health issues were first dealt with in the 1993 Law on Environment Protection and in the Decree guiding the implementation of the Law, which regulated HIA as a part of EIA. However, there was no guideline on HIA and consequently HIA was not applied. Some ad-hoc assessments were performed merely on occupational health.
In 2005, an improved version of the Law on Environment Protection was published replacing the 1993 law. Decree No. 80/2006/ND-CP guides the implementation of the Law and separates HIA from EIA. The updated guidelines published in 2008 through the Circular No. 08/2006/TT-BTNMT dated 08th December, 2008 also kept HIA out of EIA. Although health issues are mentioned in the law, no documents on guiding HIA have been published.
The separation of HIA from EIA is merely related to issues of competence: the Ministry of Natural Resources and Environment (MONRE) is responsible for policies and regulations on environmental issues (EIA included), while the Ministry of Health (MOH) is competent for policies and regulations on health issues (HIA included). In response to these overlapping competences, a new agency was established within MOH. This Health and Environment Agency is now the focal point for HIA. It is responsible for developing regulations on HIA, developing a national Action Plan on HIA in Vietnam, and developing technical guidelines for HIA, aiming for institutionalising HIA and including HIA into the National Environmental Health Action Plans (NEHAP) by the end of 2015 (Nguyen, Danh, and Anh 2012).
Despite HIA was not legally required prior to these legal regulations, some HIAs were realised. Most of them were part of research projects on HIA or the integration of health issues in EIA/SEA. Other ones are studies commissioned by international organisations as the World Bank (WB), Asian Development Bank (ADB) or German Organisation for Technical Cooperation (GTZ). Various methods are used in these HIAs, depending on the requirements of the project or on the background of the involved researchers/experts.
1.2. Problem formulation
1.2.1. Difficulties in implementing integrated HIA in Vietnam
The main shortcoming of this approach is that it requires a substantial empirical study, which is often very time consuming and has a variable accuracy. Also, the spatial and temporal scopes of such study are usually missing. Furthermore, it is not possible to differentiate health effects of different sources on a health outcome. Therefore, health impacts of air pollution are not routinely studied.
Using dose-response function in HIA allows a higher accuracy while one does not need to perform personal and individual monitoring of exposure and related health outcome. Studies also suggested that the use of modelling and mapping as tools to visualize expected outcomes of plans ease the discussion and decision-making (Benson 1992; Berkowicz 2000; USEPA 1998). Therefore, coupling air quality modelling with mapping and health risk assessment is useful as an integrated planning and management tool.
Air quality modelling has a rich history and has evolved rapidly with new methods and approaches tested and applied in many situations and conditions. The advancement of air quality modelling allows to predict with increasing accuracy the air quality at a particular places and a specific time. Various modelling approaches coupled with monitoring data are used, from simple analytical to empirical modes to complex numerical models (Brzozowski 2006; Vardoulakis et al. 2003). To increase accuracy, air quality modelling also became increasingly sophisticated with more details data required on different aspects, not only the obvious ones such as atmospheric data, pollution sources, etc. but also land-use, demography and socio-economic data are integrated. These later are also extensively used in domain, as socio-economic planning, social studies, landscape studies, urban studies, and transportation. The overlapping is evident but the types of data required are often different among the different domains.
In Vietnam, these integrated tools are not well developed and utilized. While the application of GIS and environmental modelling has been integrated in environmental research, they are not used in health assessment. Therefore, while there are numerous studies on air pollution and the fate of air pollutants in the environment (Pham 2005; Hung et al. 2010; Hoang 2008), these results have not been used to assess the impact of air pollution on human health. Applying GIS and environmental modelling to quantify health impacts of air pollution will bring significant improvements, such as the incorporation of time and space in health impact assessment, which in turn will provide better and quicker results.
1.2.2. Research questions and objectives
The use of models and GIS in a health risk assessment, from the governance point of view, can reduce the waiting time for results, in comparison to the in depth personal exposure study with better accuracy than using purely monitoring data and health statistics. The use of models and GIS also allows summarising the links between air quality and health outcomes visually and is therefore useful in the decision-making on urban planning and development.
Therefore, the main research question of this work is to investigate the possibilities of integrating GIS and air quality modelling in HIA to form a coherent procedure that can be generalised and applied in different contexts. The focus will also be on assessing the use of indicator pollutants in this integration. The final aim is to improve HIA results through the integration of GIS and modelling in the HIA methods.
The secondary question is to investigate which improvements can be made to further advance the integration and facilitate the application of integrated modelling in policy-making. As the integration of GIS and modelling will require a coupling of various data sources and layers, it is hypothesised that improvements are possible for at a number of entries.