EUROPEAN ORGANIZATION FOR NUCLEAR RESEARCH (CERN)
CERN-PH-EP/2013-037 2016/03/15
CMS-TOP-14-018
Measurement of the tt production cross section in the
all-jets final state in pp collisions at
√
s
=
8 TeV
The CMS Collaboration
∗Abstract
The cross section for tt production in the all-jets final state is measured in pp collisions at a centre-of-mass energy of 8 TeV at the LHC with the CMS detector, in data corre-sponding to an integrated luminosity of 18.4 fb−1. The inclusive cross section is found to be 275.6±6.1 (stat)±37.8 (syst)±7.2 (lumi) pb. The normalized differential cross sections are measured as a function of the top quark transverse momenta, pT, and compared to predictions from quantum chromodynamics. The results are reported at detector, parton, and particle levels. In all cases, the measured top quark pTspectra are significantly softer than theoretical predictions.
Published in the European Physical Journal C as doi:10.1140/epjc/s10052-016-3956-5.
c
2016 CERN for the benefit of the CMS Collaboration. CC-BY-3.0 license
∗See Appendix A for the list of collaboration members
1
1
Introduction
The top quark is an important component of the standard model (SM), especially because of its large mass, and its properties are critical for the overall understanding of the theory. Mea-surements of the top quark-antiquark pair (tt) production cross section test the predictions of quantum chromodynamics (QCD), constrain QCD parameters, and are sensitive to physics be-yond the SM. The tt process is also the dominant SM background to many searches for new physical phenomena, and its precise measurement is essential for claiming new discoveries. The copious top quark data samples produced at the CERN LHC enable measurements of the tt production rate in extended parts of the phase space, and differentially as a function of the kine-matic properties of the tt system. Inclusive and differential cross section measurements from proton-proton (pp) collisions at centre-of-mass energies of 7 and 8 TeV have been reported by the ATLAS [1–11] and CMS collaborations [12–24]. These are significantly more precise than the measurements of tt production in proton-antiproton collisions performed at the Tevatron [25]. In this paper, we report new results from pp collision data at √s = 8 TeV, collected with the CMS detector. Measurements of the tt inclusive cross section and the normalized differential cross sections are presented for the first time in the all-jets final state at this collision energy. The results are compared to QCD predictions, and are in agreement with other measurements in different decay channels.
Top quarks decay almost exclusively into a W boson and a b quark. Events in which both W bosons from the tt decay produce a pair of light quarks constitute the so-called all-jets channel. As a result, the final state consists of at least six partons (more are possible from initial- and final-state radiation), two of which are b quarks. Despite the large number of combinatorial possibilities, it is possible to fully reconstruct the kinematical properties of the tt decay prod-ucts, unlike in the leptonic channels where the presence of one or two neutrinos makes the full event interpretation ambiguous. However, the presence of a large background from multijet production, and the larger number of jets in the final state make the measurement of the tt cross section in the all-jets final state more uncertain compared to the leptonic channels. Neverthe-less, a high-purity signal sample can be selected, which increases significantly the signal-over-background ratio compared to previous measurements in this decay channel [21, 26, 27].
2
The CMS detector
The central feature of the CMS apparatus is a superconducting solenoid of 6 m internal diam-eter, providing a magnetic field of 3.8 T. Within the solenoid volume are a silicon pixel and strip tracker, a lead tungstate crystal electromagnetic calorimeter, and a brass and scintillator hadron calorimeter. Extensive forward calorimetry (pseudorapidity|η| > 3.0) complements the coverage provided by the barrel (|η| <1.3) and endcap (1.3< |η| < 3.0) detectors. Muons are measured in gas-ionization detectors embedded in the steel flux-return yoke outside the solenoid. The first level of the CMS trigger system, composed of custom hardware processors, uses information from the calorimeters and muon detectors to select the most interesting events in a fixed time interval of less than 4 µs. The high-level trigger (HLT) processor farm further decreases the event rate from around 100 kHz to around 300 Hz, before data storage. A detailed description of the CMS apparatus, together with the definition of the coordinate system used and the relevant kinematic variables, can be found in Ref. [28].
2 4 Event reconstruction and selection
3
Event simulation
The tt events are simulated using the leading-order (LO) MADGRAPH (v. 5.1.5.11) event gen-erator [29], which incorporates spin correlations through the MADSPIN[30] package and the simulation of up to three additional partons. The value of the top quark mass is set to mt = 172.5 GeV and the proton structure is described by the parton distribution functions (PDFs) from CTEQ6L1 [31]. The generated events are subsequently processed with PYTHIA (v. 6.426) [32] which utilizes tune Z2* for parton showering and hadronization, and the MLM prescription [33] is used for matching of matrix element jets to those from parton shower. The PYTHIAZ2* tune is derived from the Z1* tune [34], which uses the CTEQ5L PDF [31], whereas Z2* adopts CTEQ6L [31]. The CMS detector response is simulated using GEANT4 (v. 9.4) [35]. In addition to the MADGRAPHsimulation, predictions obtained with the next-to-leading-order (NLO) generatorsMC@NLO(v. 3.41) [36] andPOWHEG(v. 1.0 r1380) [37] are also compared to the measurements. WhilePOWHEGandMC@NLOare formally equivalent up to NLO accuracy, they differ in the techniques used to avoid double counting of the radiative corrections when interfacing with the parton shower generators. Two differentPOWHEG samples are used: one usesPYTHIAand the otherHERWIG(v. 6.520) [38] for parton showering and hadronization. The events generated withMC@NLOare interfaced withHERWIG. TheHERWIGAUET2 tune [39] is used to model the underlying event in the POWHEG+HERWIGsample, while the default tune is used in the MC@NLO+HERWIGsample. The proton structure is described by the PDF sets CT10 [40] and CTEQ6M [31] forPOWHEGandMC@NLO, respectively. The QCD multijet events are simulated using MADGRAPH(v. 5.1.3.2) interfaced withPYTHIA(v. 6.424).
4
Event reconstruction and selection
4.1 Jet reconstruction
Jets are reconstructed with the anti-kT clustering algorithm [41, 42] with a distance parameter of 0.5. The input to the jet clustering algorithm is the collection of particle candidates that are reconstructed with the particle-flow (PF) algorithm [43, 44]. In the PF event reconstruction all stable particles in the event, i.e. electrons, muons, photons, and charged and neutral hadrons, are reconstructed as PF candidates using a combination of all of the subdetector information to obtain an optimal determination of their directions, energies, and types. All the reconstructed vertices in the event are ordered according to the sum of squared transverse momenta (pT) of tracks used to reconstruct it and the vertex with the largest sum is considered the primary one, while all the rest are considered as pileup vertices. In order to mitigate the effect of multiple in-teractions in the same bunch crossing (pileup), charged PF candidates that are unambiguously associated with pileup vertices are removed prior to the jet clustering. This procedure is called charged-hadron subtraction (CHS) [45]. An offset correction is applied for the additional en-ergy inside of the jet due to neutral hadrons or photons from pileup. The resulting jets require a small residual energy correction, mostly due to the thresholds for reconstructed tracks and clusters in the PF algorithm and reconstruction inefficiencies [45].
The identification of jets that likely originate from the hadronization of b quarks is done with the “combined secondary vertex” (CSV) b tagger [46]. The CSV algorithm combines the infor-mation from track impact parameters and identified secondary vertices within a given jet, and provides a continuous discriminator output.
4.2 Trigger 3
4.2 Trigger
The data used for this measurement were collected with a multijet trigger event selection (path) which, from the HLT, required at least four jets reconstructed from calorimetric information with a pTthreshold of 50 GeV and|η| <3.0. The hardware trigger required the presence of two central (|η| <3.0) jets above various pTthresholds (52–64 GeV), or the presence of four central jets with lower pTthresholds (32–40 GeV), or the scalar sum of all jets pT to be greater than 125 or 175 GeV. The various thresholds were adjusted within the quoted ranges according to the instantaneous luminosity. The trigger paths employed were unprescaled for a larger part of the run, yielding a data sample corresponding to an integrated luminosity of 18.4 fb−1.
4.3 Selection and kinematic top quark pair reconstruction
Selected events are required to contain at least six reconstructed jets with pT > 40 GeV and |η| <2.4 (jets are required to be within the tracker acceptance in order to apply the CHS), with at least four of the jets having pT > 60 GeV (so that the trigger efficiency is greater than 80% and the data-to-simulation correction factor smaller than 10%). Among the six jets with the highest pT (leading jets), at least two must be identified as coming from b hadronization by the CSV algorithm at the medium working point (CSVM), with a typical b quark identifica-tion efficiency of 70% and misidentificaidentifica-tion probability for light quarks of 1.4%, and these are considered the most probable b jet candidates. If there are more than two such jets, which hap-pens in approximately 2% of the events, then the two with the highest pT are chosen. To select events compatible with the tt hypothesis, and to improve the resolution of the reconstructed quantities, a kinematic fit is performed that utilizes the constraints of the tt decay. A χ2 fit is performed, starting with the reconstructed jet four-momenta, which are varied within their experimental pT and angular resolutions, imposing a W boson mass constraint (80.4 GeV [47]) on the light-quark pairs, and requiring that the top quark and antiquark have equal mass. Out of all the possible combinations from the six input jets, the algorithm returns the one with the smallest χ2and the resulting parton four momenta, which are used to compute the recon-structed top quark mass (mrec
t ). The probability of the converged kinematic fit is required to be greater than 0.15. Overall, the kinematic fit requirements select approximately 5% (2%) of the tt (background) events. The distance in the η–φ space between the two b quark candidates must be∆Rbb =
p
(∆ηbb)2+ (∆φbb)2>2.0, which has an efficiency of roughly 75% (50%) on tt (background) events. The last two requirements are applied to select events with unambiguous top quark pair interpretation and to suppress the QCD background that originates from gluon splitting into collinear b quarks [48].
5
Signal extraction
The background to the tt signal is dominated by the QCD multijet production process, while the other backgrounds, such as the associated production of vector bosons with jets, are negli-gible. Due to the limited size of the Monte Carlo (MC) simulated samples, the background is determined directly from the data. A QCD-dominated event sample is selected with the trigger and offline requirements described in Section 4.3 and requiring zero CSVM b tagged jets. In these events the most probable b quark candidates are determined by the kinematic fit. The resulting sample contains a negligible fraction of tt events (<1%) and is treated exactly like the signal sample. After applying the∆Rbb > 2.0 and the fit probability requirements, the recon-structed top-like kinematic properties of events with no b jet are very similar to those with two b jets (confirmed using simulated QCD events). We use this QCD-dominated control sample to extract the shape (templates) of the various kinematic observables. The number of tt events
4 6 Systematic uncertainties
(signal yield) is extracted from a template fit of mrect to the data using parametrized shapes for signal and background distributions, where the signal shape is taken from the tt simulation and the QCD shape is taken from the control data sample described above. The background and signal yields are determined via a maximum likelihood fit to the mrec
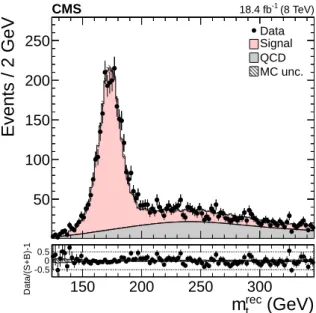
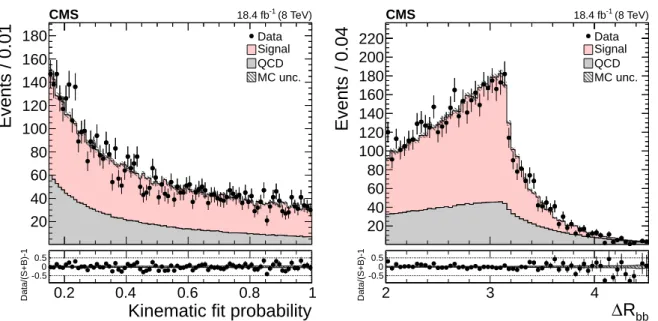
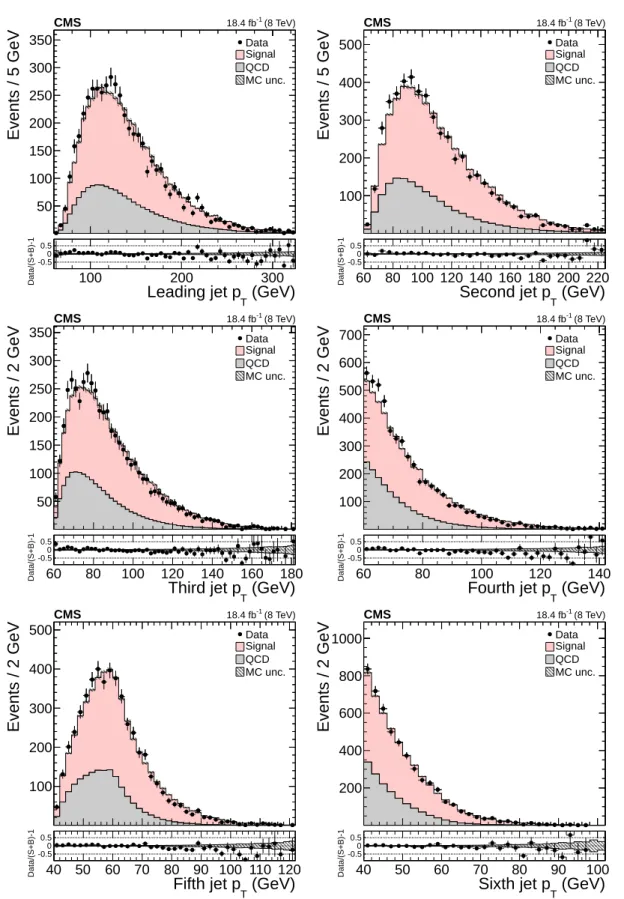
t distribution and are used to normalize the corresponding samples. Figures 1 and 2 show the fitted mass and the kinematic fit probability and ∆Rbb distributions. The pT distribution of the six leading jets is shown in Fig. 3. From the output of the kinematic fit one can reconstruct the two top quark candidates, whose pT are shown in Fig. 4, and the properties of the tt system (pT, rapidity y) are shown in Fig. 5. Overall, the data sample is dominated by signal events, and the data are in agreement with the fit results. The jet pTspectra in data appear to be systematically softer than in the simulation, in agreement with the observations in Ref. [24], related to a softer measured top quark pTspectrum.
Events / 2 GeV 50 100 150 200 250 DataSignal QCD MC unc. (8 TeV) -1 18.4 fb CMS (GeV) rec t m 150 200 250 300 Data/(S+B)-1 -0.50 0.5
Figure 1: Distribution of the reconstructed top quark mass after the kinematic fit. The normal-izations of the tt signal and the QCD multijet background are taken from the template fit to the data. The bottom panel shows the fractional difference between the data and the sum of signal and background predictions, with the shaded band representing the MC statistical uncertainty.
6
Systematic uncertainties
The measurement of the tt cross section is affected by several sources of systematic uncertainty, both experimental and theoretical, which are described below and summarized in Table 1. The quoted values refer to the inclusive measurement, with small variations observed in the bins of the differential measurement presented in Section 7.2.
• Background modeling:the QCD mrect template shape derived from the data control
sample is varied according to the uncertainty of the method evaluated with simu-lated events, which impacts the extracted signal yield moderately (4.9%).
• Trigger efficiency: the efficiency of the trigger path is taken from the simulation
and corrected with an event-by-event scale factor (SFtrig), calculated from data in-dependent samples, that depends on the fourth jet pT. In the phase space of the measurement, the SFtrigis greater than 0.83 and on average 0.96. The associated un-certainty is conservatively defined as (1−SFtrig)/2 and has a small impact (2.0%) on the cross section.
5 Events / 0.01 20 40 60 80 100 120 140 160 180 Data Signal QCD MC unc. (8 TeV) -1 18.4 fb CMS
Kinematic fit probability
0.2 0.4 0.6 0.8 1 Data/(S+B)-1 -0.5 0 0.5 Events / 0.04 20 40 60 80 100 120 140 160 180 200 220 Data Signal QCD MC unc. (8 TeV) -1 18.4 fb CMS bb R ∆ 2 3 4 Data/(S+B)-1 -0.5 0 0.5
Figure 2: Distribution of the kinematic fit probability (left). Distribution of the distance between the reconstructed b partons in the η–φ plane (right). The normalizations of the tt signal and the QCD multijet background are taken from the template fit to the data. The bottom panels show the fractional difference between the data and the sum of signal and background predictions, with the shaded band representing the MC statistical uncertainty.
• Jet energy scale and resolution: the jet energy scale (JES) and jet resolution (JER)
uncertainties have significant impacts on the measured cross section due to the rel-atively high pT requirements on the fourth and sixth of the leading jets. In the sim-ulated events, jets are shifted (smeared) according to the pT- and η-dependent JES (JER) uncertainty, prior to the kinematic fit, and the full event interpretation is re-peated. The JES (JER) has a dominant (small) effect on the cross section measurement of 7.0% (3.5%). In addition, the JES/JER uncertainties affect the signal template, with a negligible impact (≈1%) on the cross section measurement.
• b tagging: the performance of the b tagger has a dominant effect on the signal
acceptance because the selected events are required to have at least two jets satis-fying the CSVM requirement. An event-by-event scale factor (SFbtag) is applied to the simulation, which accounts for the discrepancies between data and simulation in the efficiency of tagging true b jets and in the misidentification rate [46]. The av-erage value of SFbtag is 0.99. The uncertainty in the SFbtag is taken into account by weighting each event with the shifted value of SFbtagwhich results in a cross section uncertainty of 7.3%. This is the leading systematic uncertainty.
• Integrated luminosity: the uncertainty on the integrated luminosity is estimated to
be 2.6% [49].
• Matching partons to showers:the impact of the choice of the scale that separates the
description of jet production via matrix elements or parton shower in MADGRAPH is studied by changing its reference value of 20 to 40 and 10 GeV, resulting in an asymmetric effect of−4.2, +2.4% on the cross section.
• Renormalization and factorization scales: the uncertainty in modelling of the
hard-production process is assessed through changes in the renormalization and factorization scales in the MADGRAPH sample by factors of two and half, relative to their common nominal value, which is set to the Q of the hard process. In MAD
-6 6 Systematic uncertainties Events / 5 GeV 50 100 150 200 250 300 350 Data Signal QCD MC unc. (8 TeV) -1 18.4 fb CMS (GeV) T Leading jet p 100 200 300 Data/(S+B)-1 -0.50 0.5 Events / 5 GeV 100 200 300 400 500 Data Signal QCD MC unc. (8 TeV) -1 18.4 fb CMS (GeV) T Second jet p 60 80 100 120 140 160 180 200 220 Data/(S+B)-1 -0.50 0.5 Events / 2 GeV 50 100 150 200 250 300 350 Data Signal QCD MC unc. (8 TeV) -1 18.4 fb CMS (GeV) T Third jet p 60 80 100 120 140 160 180 Data/(S+B)-1 -0.50 0.5 Events / 2 GeV 100 200 300 400 500 600 700 Data Signal QCD MC unc. (8 TeV) -1 18.4 fb CMS (GeV) T Fourth jet p 60 80 100 120 140 Data/(S+B)-1 -0.50 0.5 Events / 2 GeV 100 200 300 400 500 Data Signal QCD MC unc. (8 TeV) -1 18.4 fb CMS (GeV) T Fifth jet p 40 50 60 70 80 90 100 110 120 Data/(S+B)-1 -0.50 0.5 Events / 2 GeV 200 400 600 800 1000 DataSignal QCD MC unc. (8 TeV) -1 18.4 fb CMS (GeV) T Sixth jet p 40 50 60 70 80 90 100 Data/(S+B)-1 -0.50 0.5
Figure 3: Distribution of the pTof the six leading jets. The normalizations of the tt signal and the QCD multijet background are taken from the template fit to the data. The bottom panels show the fractional difference between the data and the sum of signal and background predictions, with the shaded band representing the MC statistical uncertainty.
7 Events / 10 GeV 50 100 150 200 250 300 DataSignal QCD MC unc. (8 TeV) -1 18.4 fb CMS (GeV) T Leading top p 0 100 200 300 400 500 Data/(S+B)-1 -0.5 0 0.5 Events / 10 GeV 50 100 150 200 250 300 DataSignal QCD MC unc. (8 TeV) -1 18.4 fb CMS (GeV) T Subleading top p 0 100 200 300 400 500 Data/(S+B)-1 -0.5 0 0.5
Figure 4: Distribution of the leading (left) and subleading (right) reconstructed top quark pT. The normalizations of the tt signal and the QCD multijet background are taken from the tem-plate fit to the data. The bottom panels show the fractional difference between the data and the sum of signal and background predictions, with the shaded band representing the MC statistical uncertainty.
GRAPH, Q is defined by Q2 = m2t +Σp2T, where the sum is over all additional final state partons in the matrix element calculations. The effect on the measured cross section is moderate and asymmetric (−0.5,+3.8%).
• Parton distribution functions: following the PDF4LHC prescription [50, 51], the
uncertainty on the cross section is estimated to be 1.5%, taking the largest deviation on the signal acceptance from all the considered PDF eigenvectors.
• Non-perturbative QCD: the impact of non-perturbative QCD effects is estimated
by studying various tunes of thePYTHIAshower model that predict different under-lying event (UE) activity and strength of the color reconnection (CR), namely, the Perugia 2011, Perugia 2011 mpiHi, and Perugia 2011 Tevatron tunes, described in Ref. [52], were used. The effect on the measured cross section is moderate: 4.4% for the UE and 1.4% for the CR.
• Hadronization model: the effect of the hadronization model on the signal
effi-ciency is estimated by comparing the predictions from the MC@NLO+HERWIGand POWHEG+PYTHIAsimulations, and it amounts to 2%.
7
Results
7.1 Inclusive cross section
The signal yield (Ntt), extracted as described in Section 5, is used to compute the inclusive tt production cross section, according to the formula
σtt= Ntt
(Ae) L, (1)
where(Ae)is the simulated signal acceptance times efficiency in the measurement phase space (≈7×10⁻⁴) corrected event-by-event with the trigger and b tagging efficiency scale factors
8 7 Results Events / 5 GeV 100 200 300 400 500 Data Signal QCD MC unc. (8 TeV) -1 18.4 fb CMS (GeV) t t T p 0 50 100 150 200 Data/(S+B)-1 -0.5 0 0.5 Events / 0.1 50 100 150 200 250 300 350 DataSignal QCD MC unc. (8 TeV) -1 18.4 fb CMS t t y -2 -1 0 1 2 Data/(S+B)-1 -0.5 0 0.5
Figure 5: Distribution of the pT (left) and the rapidity (right) of the reconstructed top quark pair. The normalizations of the tt signal and the QCD multijet background are taken from the template fit to the data. The bottom panels show the fractional difference between the data and the sum of signal and background predictions, with the shaded band representing the MC statistical uncertainty.
Table 1: Fractional uncertainties in the inclusive tt production cross section. Source Background modeling ±4.9% JES −7.0, +6.8% JER ±3.5% b tagging ±7.3% Trigger efficiency −2.2, +2.0% Underlying event ±4.4%
Matching partons to showers −4.2, +2.4% Factorization and renormalization scales −0.5, +3.8%
Color reconnection ±1.4%
Parton distribution function ±1.5%
Hadronization ±2.0%
Total systematic uncertainty ±13.7%
Statistical uncertainty ±2.3%
Integrated luminosity ±2.6%
andLis the integrated luminosity. The fitted signal amounts to 3416±79 events. Taking into account the systematic uncertainties discussed in Section 6, the measured cross section is
σtt =275.6±6.1 (stat)±37.8 (syst)±7.2 (lumi) pb. (2)
The precision of the measured inclusive cross section is dominated by the systematic uncer-tainties, and in particular by those related to JES and b tagging.
In order to parametrize the dependence of the result on the top quark mass assumption, the measurement was repeated using signal simulated samples with different generated top quark masses (167.5 and 175.5 GeV). The choice of the generated mass affects both the extracted signal
7.2 Differential cross sections 9
yield and the signal efficiency. The quadratic interpolation of the measurements with the three different top quark masses is
σtt(mt)
σtt(mt=172.5)
=1.0−2.4×10⁻²(mt−172.5) +8.3×10⁻⁴(mt−172.5)2. (3)
7.2 Differential cross sections
The size of the signal sample allows the differential measurement of the tt production cross section to be performed as a function of various observables. In order to confront the theoretical predictions, the differential cross sections are reported normalized to the inclusive cross section, resulting in a significant cancellation of systematic uncertainties.
The process of measuring the differential cross sections is identical to the inclusive case: in each bin of the observable used to divide the phase space, the signal is extracted from a template fit to the reconstructed top quark mass. Besides the physics interest, the choice of the observ-ables used is mainly motivated by their correlation to mrect , and the ability to extract smooth signal and background templates. The variables chosen are the pTof the two reconstructed top quarks. Figure 6 shows the fitted mrect distributions in bins of the pTof the leading top quark. The differential measurements are first reported for the visible fiducial volume, as a function of the reconstructed top pT (detector level), and then extrapolated to the parton and particle levels. The detector-level result is shown in Fig. 7 and is free of most of the systematic uncer-tainties affecting the inclusive measurement. The corresponding numerical values are reported in Table 2.
The parton-level results shown in Fig. 8 are obtained from the detector-level measurement, after correcting for bin migration effects and extrapolating to the full phase space using a bin-by-bin acceptance correction. The unfolding of the bin-migration effect is performed with the D’Agostini method [53], implemented in the RooUnfold package [54], using the migration ma-trix derived from the simulation. The uncertainty due to the modeling of the migration mama-trix and the phase-space extrapolation is estimated by repeating the unfolding and acceptance-correction procedures by varying the systematic sources described in Section 6. The numerical values of the normalized differential cross sections at parton level are reported in Table 3. It should be noted that there is a large extrapolation factor involved from the detector-level jets (≈7×10⁻⁴of the signal) to the full parton level, which results in large theoretical uncertainties. In addition to the parton level, results are reported at particle level, in Fig. 9, in a phase space similar to the detector level by construction. This is defined as follows: first, particle jets are built in simulation from all stable particles (including neutrinos) with the same jet clustering algorithm as the detector jets. Then, starting from the six leading jets, the jets associated with B hadrons via matching in η-φ (∆R < 0.25) are identified as the b jet candidates. Events are further selected if p4th jetT > 60 GeV and p6th jetT >40 GeV and if there are at least two b jets with ∆Rbb >2.0. For the selected events, a “pseudo top quark” is reconstructed from one b jet and the two closest non-b-tagged jets. The particle-level results are obtained in a similar way to the parton level, via unfolding and acceptance correction. The numerical values of the normalized differential cross sections at particle level are reported in Table 4.
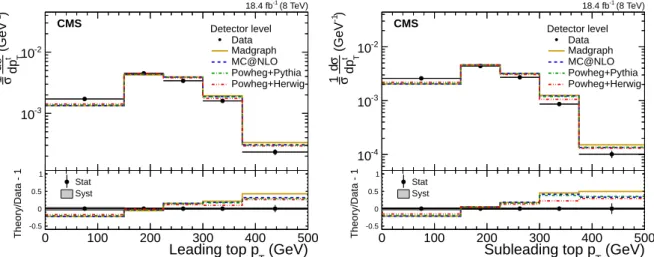
The comparison of the measured and predicted differential top quark pTshapes reveals that the models predict a harder spectrum, both in the leading and in the subleading top quark pT, in the phase space of the measurement. This effect is also reflected on the jet pTdistributions shown in Fig. 3. ThePOWHEG+HERWIGprediction is the closest to the data, but still shows a significant discrepancy. The parton-level results are accompanied by sizeable systematic uncertainties,
10 8 Summary
dominated by the theoretical uncertainties due to the extrapolation to the full phase space. In contrast, the particle-level phase space is much closer to the visible one, and as a result the extrapolation uncertainties are smaller.
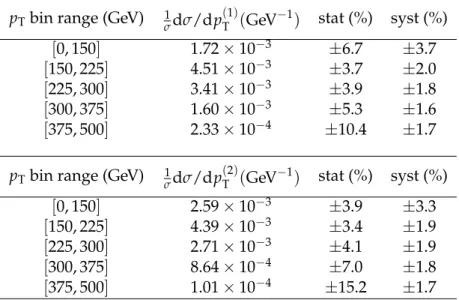
Table 2: Normalized differential tt cross section as a function of the pTof the leading (p (1) T ) and subleading (pT(2)) top quarks or antiquarks. The results are presented at detector level in the visible phase space.
pTbin range (GeV) 1σdσ/dpT(1)(GeV−1) stat (%) syst (%) [0, 150] 1.72×10⁻³ ±6.7 ±3.7
[150, 225] 4.51×10⁻³ ±3.7 ±2.0
[225, 300] 3.41×10⁻³ ±3.9 ±1.8 [300, 375] 1.60×10⁻³ ±5.3 ±1.6
[375, 500] 2.33×10⁻⁴ ±10.4 ±1.7 pTbin range (GeV) 1σdσ/dpT(2)(GeV−1) stat (%) syst (%)
[0, 150] 2.59×10⁻³ ±3.9 ±3.3 [150, 225] 4.39×10⁻³ ±3.4 ±1.9 [225, 300] 2.71×10⁻³ ±4.1 ±1.9 [300, 375] 8.64×10⁻⁴ ±7.0 ±1.8 [375, 500] 1.01×10⁻⁴ ±15.2 ±1.7
8
Summary
A measurement of the tt production cross section has been performed in the all-jets final state, using pp collision data at√s = 8 TeV corresponding to an integrated luminosity of 18.4 fb−1. The measured inclusive cross section is 275.6±6.1 (stat)±37.8 (syst)±7.2 (lumi) pb for a top quark mass of 172.5 GeV, in agreement with the standard model prediction of 252.9+−6.48.6(scale) ±
11.7(PDF+αS)pb as calculated with the TOP++ (v. 2.0) program [55] at next-to-next-to-leading order in perturbative QCD, including soft-gluon resummation at next-to-next-to-leading-log order [56], and assuming a top-quark mass mt = 172.5 GeV. Also reported are the fiducial normalized differential cross sections as a function of the leading and subleading top quark pT. Compared to QCD predictions, the measurement shows a significantly softer top quark pT spectrum. The differential cross sections are also extrapolated to the full partonic phase space, as well as to particle level, and can be used to tune Monte Carlo models.
Acknowledgments
We congratulate our colleagues in the CERN accelerator departments for the excellent perfor-mance of the LHC and thank the technical and administrative staffs at CERN and at other CMS institutes for their contributions to the success of the CMS effort. In addition, we gratefully acknowledge the computing centres and personnel of the Worldwide LHC Computing Grid for delivering so effectively the computing infrastructure essential to our analyses. Finally, we acknowledge the enduring support for the construction and operation of the LHC and the CMS detector provided by the following funding agencies: BMWFW and FWF (Austria); FNRS and FWO (Belgium); CNPq, CAPES, FAPERJ, and FAPESP (Brazil); MES (Bulgaria); CERN; CAS, MoST, and NSFC (China); COLCIENCIAS (Colombia); MSES and CSF (Croatia); RPF (Cyprus);
11 Events / 5 GeV 10 20 30 40 50 60 70 Data Signal QCD MC unc. [0,150] GeV ∈ T Leading top p (8 TeV) -1 18.4 fb CMS (GeV) rec t m 150 200 250 300 350 Data/(S+B)-1 -0.5 0 0.5 Events / 5 GeV 20 40 60 80 100 120 140 160 180 200 220 Data Signal QCD MC unc. [150,225] GeV ∈ T Leading top p (8 TeV) -1 18.4 fb CMS (GeV) rec t m 150 200 250 300 350 Data/(S+B)-1 -0.5 0 0.5 Events / 5 GeV 20 40 60 80 100 120 140 160 180 200 220 240 Data Signal QCD MC unc. [225,300] GeV ∈ T Leading top p (8 TeV) -1 18.4 fb CMS (GeV) rec t m 150 200 250 300 350 Data/(S+B)-1 -0.50 0.5 Events / 5 GeV 20 40 60 80 100 Data Signal QCD MC unc. [300,375] GeV ∈ T Leading top p (8 TeV) -1 18.4 fb CMS (GeV) rec t m 150 200 250 300 350 Data/(S+B)-1 -0.50 0.5 Events / 5 GeV 5 10 15 20 25 30 35 Data Signal QCD MC unc. [375,500] GeV ∈ T Leading top p (8 TeV) -1 18.4 fb CMS (GeV) rec t m 150 200 250 300 350 Data/(S+B)-1 -0.50 0.5
Figure 6: Distribution of the reconstructed top quark mass after the kinematic fit in bins of the leading reconstructed top quark pT. The normalizations of the tt signal and the QCD multijet background are taken from the template fit to the data. The bottom panels show the fractional difference between the data and the sum of signal and background predictions, with the shaded band representing the MC statistical uncertainty.
12 8 Summary ) -1 (GeVt T dp σ d σ 1 -3 10 -2 10 Detector level Data Madgraph MC@NLO Powheg+Pythia Powheg+Herwig (8 TeV) -1 18.4 fb CMS (GeV) T Leading top p 0 100 200 300 400 500 Theory/Data - 1 -0.5 0 0.5 1 Stat Syst ) -1 (GeVt T dp σ d σ 1 -4 10 -3 10 -2 10 Detector level Data Madgraph MC@NLO Powheg+Pythia Powheg+Herwig (8 TeV) -1 18.4 fb CMS (GeV) T Subleading top p 0 100 200 300 400 500 Theory/Data - 1 -0.5 0 0.5 1 Stat Syst
Figure 7: Normalized fiducial differential cross section of the tt production as a function of the leading (left) and subleading (right) reconstructed top quark pT (detector level). The bottom panels show the fractional difference between various MC predictions and the data. Statistical uncertainties are shown with error bars, and systematic uncertainties with the shaded band.
Table 3: Normalized differential tt cross section as a function of the pTof the leading (p (1) T ) and subleading (p(T2)) top quarks or antiquarks. The results are presented at parton level in the full phase space.
pTbin range (GeV) σ1dσ/dpT(1)(GeV−1) stat (%) exp. syst (%) theo. syst (%) [0, 150] 6.72×10⁻³ ±10.8 −3.7,+4.1 −9.7,+14.8
[150, 225] 3.27×10⁻³ ±4.3 −2.0,+1.8 −9.0,+2.5
[225, 300] 8.73×10⁻⁴ ±5.0 −0.8,+1.2 −9.3,+4.9 [300, 375] 2.70×10⁻⁴ ±7.1 −2.3,+2.7 −7.5,+9.9
[375, 500] 5.88×10⁻⁵ ±15.2 −3.3,+1.9 −29.4,+9.0 pTbin range (GeV) σ1dσ/dpT(2)(GeV−1) stat (%) exp. syst (%) theo. syst (%)
[0, 150] 7.59×10⁻³ ±6.2 −2.5,+2.7 −7.6,+8.1
[150, 225] 1.73×10⁻³ ±4.4 −1.3,+0.7 −10.5,+4.7
[225, 300] 4.12×10⁻⁴ ±5.6 −1.8,+2.2 −15.7,+6.2
[300, 375] 9.11×10⁻⁵ ±9.7 −1.9,+3.3 −18.1,+7.0 [375, 500] 2.30×10⁻⁵ ±21.4 −5.6,+2.0 −15.0,+4.7
13 ) -1 (GeV T dp σ d σ 1 -4 10 -3 10 -2 10 Parton level Data Madgraph MC@NLO Powheg+Pythia Powheg+Herwig (8 TeV) -1 18.4 fb CMS (GeV) T Leading top p 0 100 200 300 400 500 Theory/Data - 1 -0.5 0 0.5 1 Stat Exp. syst Theo. syst ) -1 (GeV T dp σ d σ 1 -4 10 -3 10 -2 10 Parton level Data Madgraph MC@NLO Powheg+Pythia Powheg+Herwig (8 TeV) -1 18.4 fb CMS (GeV) T Subleading top p 0 100 200 300 400 500 Theory/Data - 1 -0.5 0 0.5 1 Stat Exp. syst Theo. syst
Figure 8: Normalized differential cross section of the tt production at parton level as a function of the leading (left) and subleading (right) top quark pT. The bottom panels show the fractional difference between various MC predictions and the data. Statistical uncertainties are shown with error bars, while theoretical (theo.) and experimental (exp.) systematic uncertainties with the shaded bands.
) -1 (GeV T dp σ d σ 1 -3 10 -2 10 Particle level Data Madgraph MC@NLO Powheg+Pythia Powheg+Herwig (8 TeV) -1 18.4 fb CMS (GeV) T Leading top p 0 100 200 300 400 500 Theory/Data - 1 -0.5 0 0.5 1 Stat Exp. syst Theo. syst ) -1 (GeV T dp σ d σ 1 -4 10 -3 10 -2 10 Particle level Data Madgraph MC@NLO Powheg+Pythia Powheg+Herwig (8 TeV) -1 18.4 fb CMS (GeV) T Subleading top p 0 100 200 300 400 500 Theory/Data - 1 -0.5 0 0.5 1 Stat Exp. syst Theo. syst
Figure 9: Normalized differential cross section of the tt production at particle level as a function of the leading (left) and subleading (right) top quark pT. The bottom panels show the fractional difference between various MC predictions and the data. Statistical uncertainties are shown with error bars, while theoretical (theo.) and experimental (exp.) systematic uncertainties with the shaded bands.
MoER, ERC IUT and ERDF (Estonia); Academy of Finland, MEC, and HIP (Finland); CEA and CNRS/IN2P3 (France); BMBF, DFG, and HGF (Germany); GSRT (Greece); OTKA and NIH (Hungary); DAE and DST (India); IPM (Iran); SFI (Ireland); INFN (Italy); MSIP and NRF (Re-public of Korea); LAS (Lithuania); MOE and UM (Malaysia); CINVESTAV, CONACYT, SEP, and UASLP-FAI (Mexico); MBIE (New Zealand); PAEC (Pakistan); MSHE and NSC (Poland); FCT (Portugal); JINR (Dubna); MON, RosAtom, RAS and RFBR (Russia); MESTD (Serbia); SEIDI and CPAN (Spain); Swiss Funding Agencies (Switzerland); MST (Taipei); ThEPCenter, IPST, STAR and NSTDA (Thailand); TUBITAK and TAEK (Turkey); NASU and SFFR (Ukraine); STFC (United Kingdom); DOE and NSF (USA).
Re-14 8 Summary
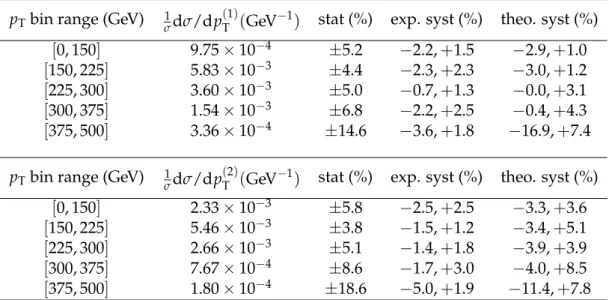
Table 4: Normalized differential tt cross section as a function of the pTof the leading (p (1) T ) and subleading (p(T2)) top quarks or antiquarks. The results are presented at particle level.
pTbin range (GeV) σ1dσ/dpT(1)(GeV−1) stat (%) exp. syst (%) theo. syst (%) [0, 150] 9.75×10⁻⁴ ±5.2 −2.2,+1.5 −2.9,+1.0
[150, 225] 5.83×10⁻³ ±4.4 −2.3,+2.3 −3.0,+1.2
[225, 300] 3.60×10⁻³ ±5.0 −0.7,+1.3 −0.0,+3.1
[300, 375] 1.54×10⁻³ ±6.8 −2.2,+2.5 −0.4,+4.3 [375, 500] 3.36×10⁻⁴ ±14.6 −3.6,+1.8 −16.9,+7.4 pTbin range (GeV) σ1dσ/dpT(2)(GeV−1) stat (%) exp. syst (%) theo. syst (%)
[0, 150] 2.33×10⁻³ ±5.8 −2.5,+2.5 −3.3,+3.6
[150, 225] 5.46×10⁻³ ±3.8 −1.5,+1.2 −3.4,+5.1
[225, 300] 2.66×10⁻³ ±5.1 −1.4,+1.8 −3.9,+3.9
[300, 375] 7.67×10⁻⁴ ±8.6 −1.7,+3.0 −4.0,+8.5
[375, 500] 1.80×10⁻⁴ ±18.6 −5.0,+1.9 −11.4,+7.8
search Council and EPLANET (European Union); the Leventis Foundation; the A. P. Sloan Foundation; the Alexander von Humboldt Foundation; the Belgian Federal Science Policy Of-fice; the Fonds pour la Formation `a la Recherche dans l’Industrie et dans l’Agriculture (FRIA-Belgium); the Agentschap voor Innovatie door Wetenschap en Technologie (IWT-(FRIA-Belgium); the Ministry of Education, Youth and Sports (MEYS) of the Czech Republic; the Council of Science and Industrial Research, India; the HOMING PLUS programme of the Foundation for Polish Science, cofinanced from European Union, Regional Development Fund; the OPUS programme of the National Science Center (Poland); the Compagnia di San Paolo (Torino); the Consorzio per la Fisica (Trieste); MIUR project 20108T4XTM (Italy); the Thalis and Aristeia programmes cofinanced by EU-ESF and the Greek NSRF; the National Priorities Research Program by Qatar National Research Fund; the Rachadapisek Sompot Fund for Postdoctoral Fellowship, Chula-longkorn University (Thailand); and the Welch Foundation, contract C-1845.
References 15
References
[1] ATLAS Collaboration, “Measurement of the top quark-pair production cross section with ATLAS in pp collisions at√s=7 TeV”, Eur. Phys. J. C 71 (2011) 1577,
doi:10.1140/epjc/s10052-011-1577-6, arXiv:1012.1792.
[2] ATLAS Collaboration, “Measurement of the top quark pair production cross section in pp collisions at√s=7 TeV in dilepton final states with ATLAS”, Phys. Lett. B 707 (2012) 459, doi:10.1016/j.physletb.2011.12.055, arXiv:1108.3699.
[3] ATLAS Collaboration, “Measurement of the top quark pair production cross-section with ATLAS in the single lepton channel”, Phys. Lett. B 711 (2012) 244,
doi:10.1016/j.physletb.2012.03.083, arXiv:1201.1889.
[4] ATLAS Collaboration, “Measurement of the cross section for top-quark pair production in pp collisions at√s=7 TeV with the ATLAS detector using final states with two high-pt leptons”, JHEP 05 (2012) 059, doi:10.1007/JHEP05(2012)059, arXiv:1202.4892.
[5] ATLAS Collaboration, “Measurement of the top quark pair cross section with ATLAS in pp collisions at√s =7 TeV using final states with an electron or a muon and a
hadronically decaying τ lepton”, Phys. Lett. B 717 (2012) 89,
doi:10.1016/j.physletb.2012.09.032, arXiv:1205.2067.
[6] ATLAS Collaboration, “Measurement of the ttbar production cross section in the tau+jets channel using the ATLAS detector”, Eur. Phys. J. C 73 (2013) 2328,
doi:10.1140/epjc/s10052-013-2328-7, arXiv:1211.7205.
[7] ATLAS Collaboration, “Measurement of the tt production cross-section using eµ events with b -tagged jets in pp collisions at√s=7 and 8 TeV with the ATLAS detector”, Eur. Phys. J. C 74 (2014) 3109, doi:10.1140/epjc/s10052-014-3109-7,
arXiv:1406.5375.
[8] ATLAS Collaboration, “Measurements of normalized differential cross sections for t¯t production in pp collisions at√s =7 TeV using the ATLAS detector”, Phys. Rev. D 90 (2014) 072004, doi:10.1103/PhysRevD.90.072004, arXiv:1407.0371.
[9] ATLAS Collaboration, “Differential top-antitop cross-section measurements as a function of observables constructed from final-state particles using pp collisions at√s =7 TeV in the ATLAS detector”, JHEP 06 (2015) 100, doi:10.1007/JHEP06(2015)100,
arXiv:1502.05923.
[10] ATLAS Collaboration, “Measurement of the top pair production cross section in 8 TeV proton-proton collisions using kinematic information in the lepton+jets final state with ATLAS”, Phys. Rev. D 91 (2015) 112013, doi:10.1103/PhysRevD.91.112013, arXiv:1504.04251.
[11] ATLAS Collaboration, “Measurement of the top quark branching ratios into channels with leptons and quarks with the ATLAS detector”, Phys. Rev. D 92 (2015) 072005, doi:10.1103/PhysRevD.92.072005, arXiv:1506.05074.
[12] CMS Collaboration, “First measurement of the cross section for top-quark pair production in proton-proton collisions at√s=7 TeV”, Phys. Lett. B 695 (2011) 424, doi:10.1016/j.physletb.2010.11.058, arXiv:1010.5994.
16 References
[13] CMS Collaboration, “Measurement of the tt production cross section and the top quark mass in the dilepton channel in pp collisions at√s =7 TeV”, JHEP 07 (2011) 049, doi:10.1007/JHEP07(2011)049, arXiv:1105.5661.
[14] CMS Collaboration, “Measurement of the tt production cross section in pp collisions at√ s =7 TeV using the kinematic properties of events with leptons and jets”, Eur. Phys. J. C 71 (2011) 1721, doi:10.1140/epjc/s10052-011-1721-3, arXiv:1106.0902. [15] CMS Collaboration, “Measurement of the t¯t Production Cross Section in pp Collisions at
7 TeV in Lepton + Jets Events Using b-quark Jet Identification”, Phys. Rev. D 84 (2011) 092004, doi:10.1103/PhysRevD.84.092004, arXiv:1108.3773.
[16] CMS Collaboration, “Measurement of the tt production cross section in pp collisions at√ s =7 TeV in dilepton final states containing a τ”, Phys. Rev. D 85 (2012) 112007, doi:10.1103/PhysRevD.85.112007, arXiv:1203.6810.
[17] CMS Collaboration, “Measurement of the tt production cross section in the dilepton channel in pp collisions at√s =7 TeV”, JHEP 11 (2012) 067,
doi:10.1007/JHEP11(2012)067, arXiv:1208.2671.
[18] CMS Collaboration, “Measurement of differential top-quark pair production cross sections in pp colisions at√s=7 TeV”, Eur. Phys. J. C 73 (2013) 2339,
doi:10.1140/epjc/s10052-013-2339-4, arXiv:1211.2220.
[19] CMS Collaboration, “Measurement of the tt production cross section in pp collisions at√ s =7 TeV with lepton+jets final states”, Phys. Lett. B 720 (2013) 83,
doi:10.1016/j.physletb.2013.02.021, arXiv:1212.6682.
[20] CMS Collaboration, “Measurement of the tt production cross section in the tau+jets channel in pp collisions at√s =7 TeV”, Eur. Phys. J. C 73 (2013) 2386,
doi:10.1140/epjc/s10052-013-2386-x, arXiv:1301.5755.
[21] CMS Collaboration, “Measurement of the t¯t production cross section in the all-jet final state in pp collisions at√s =7 TeV”, JHEP 05 (2013) 065,
doi:10.1007/JHEP05(2013)065, arXiv:1302.0508.
[22] CMS Collaboration, “Measurement of the t¯t production cross section in the dilepton channel in pp collisions at√s =8 TeV”, JHEP 02 (2014) 024,
doi:10.1007/JHEP02(2014)024, arXiv:1312.7582. [Erratum: doi:10.1007/JHEP02(2014)102].
[23] CMS Collaboration, “Measurement of the tt production cross section in pp collisions at√ s =8 TeV in dilepton final states containing one τ lepton”, Phys. Lett. B 739 (2014) 23, doi:10.1016/j.physletb.2014.10.032, arXiv:1407.6643.
[24] CMS Collaboration, “Measurement of the differential cross section for top quark pair production in pp collisions at√s =8 TeV”, Eur. Phys. J. C 75 (2015) 542,
doi:10.1140/epjc/s10052-015-3709-x, arXiv:1505.04480.
[25] CDF, D0 Collaboration, “Combination of measurements of the top-quark pair production cross section from the Tevatron Collider”, Phys. Rev. D 89 (2014) 072001,
References 17
[26] CDF Collaboration, “Measurement of the Top Quark Mass and p ¯p→t¯t Cross Section in the All-Hadronic Mode with the CDFII Detector”, Phys. Rev. D 81 (2010) 052011, doi:10.1103/PhysRevD.81.052011, arXiv:1002.0365.
[27] D0 Collaboration, “Measurement of the t¯t cross section using high-multiplicity jet events”, Phys. Rev. D 82 (2010) 032002, doi:10.1103/PhysRevD.82.032002, arXiv:0911.4286.
[28] CMS Collaboration, “The CMS experiment at the CERN LHC”, JINST 3 (2008) S08004, doi:10.1088/1748-0221/3/08/S08004.
[29] J. Alwall et al., “The automated computation of tree-level and next-to-leading order differential cross sections, and their matching to parton shower simulations”, JHEP 07 (2014) 079, doi:10.1007/JHEP07(2014)079, arXiv:1405.0301.
[30] P. Artoisenet, R. Frederix, O. Mattelaer, and R. Rietkerk, “Automatic spin-entangled decays of heavy resonances in Monte Carlo simulations”, JHEP 03 (2013) 015, doi:10.1007/JHEP03(2013)015, arXiv:1212.3460.
[31] J. Pumplin et al., “New generation of parton distributions with uncertainties from global QCD analysis”, JHEP 07 (2002) 012, doi:10.1088/1126-6708/2002/07/012, arXiv:hep-ph/0201195.
[32] T. Sj ¨ostrand, S. Mrenna, and P. Z. Skands, “PYTHIA 6.4 physics and manual”, JHEP 05 (2006) 026, doi:10.1088/1126-6708/2006/05/026, arXiv:hep-ph/0603175. [33] M. L. Mangano, M. Moretti, F. Piccinini, and M. Treccani, “Matching matrix elements and
shower evolution for top-quark production in hadronic collisions”, JHEP 01 (2007) 013, doi:10.1088/1126-6708/2007/01/013, arXiv:hep-ex/0611129.
[34] R. Field, “Early LHC Underlying Event Data - Findings and Surprises”, in Hadron collider physics. Proceedings, 22nd Conference, HCP 2010, Toronto, Canada, August 23-27, 2010. 2010. arXiv:1010.3558.
[35] GEANT4 Collaboration, “GEANT4—a simulation toolkit”, Nucl. Instrum. Meth. A 506 (2003) 250, doi:10.1016/S0168-9002(03)01368-8.
[36] S. Frixione and B. R. Webber, “Matching NLO QCD computations and parton shower simulations”, JHEP 06 (2002) 29, doi:10.1088/1126-6708/2002/06/029, arXiv:hep-ph/0204244.
[37] P. Nason, “A New method for combining NLO QCD with shower Monte Carlo algorithms”, JHEP 11 (2004) 040, doi:10.1088/1126-6708/2004/11/040, arXiv:hep-ph/0409146.
[38] G. Corcella et al., “HERWIG 6: An event generator for hadron emission reactions with interfering gluons (including supersymmetric processes)”, JHEP 01 (2001) 010, doi:10.1088/1126-6708/2001/01/010, arXiv:hep-ph/0011363.
[39] ATLAS Collaboration, “ATLAS tunes of PYTHIA 6 and Pythia 8 for MC11”, ATLAS PUB note ATL-PHYS-PUB-2011-009, 2011.
[40] L. Hung-Liang et al., “New parton distributions for collider physics”, Phys. Rev. D 82 (2010) 074024, doi:10.1103/PhysRevD.82.074024, arXiv:hep-ph/1007.2241.
18 References
[41] M. Cacciari and G. P. Salam, “Dispelling the N3myth for the ktjet-finder”, Phys. Lett. B
641(2006) 57, doi:10.1016/j.physletb.2006.08.037, arXiv:hep-ph/0512210. [42] M. Cacciari, G. P. Salam, and G. Soyez, “The anti-ktjet clustering algorithm”, JHEP 04
(2008) 063, doi:10.1088/1126-6708/2008/04/063, arXiv:0802.1189.
[43] CMS Collaboration, “Particle–Flow Event Reconstruction in CMS and Performance for Jets, Taus, and EmissT ”, CMS Physics Analysis Summary CMS-PAS-PFT-09-001, 2009. [44] CMS Collaboration, “Commissioning of the Particle-flow Event Reconstruction with the
first LHC collisions recorded in the CMS detector”, CMS Physics Analysis Summary CMS-PAS-PFT-10-001, 2010.
[45] CMS Collaboration, “Determination of jet energy calibration and transverse momentum resolution in CMS”, J. Instrum. 6 (2011) P11002,
doi:10.1088/1748-0221/6/11/P11002.
[46] CMS Collaboration, “Identification of b-quark jets with the CMS experiment”, JINST 8 (2013) P04013, doi:10.1088/1748-0221/8/04/P04013, arXiv:1211.4462. [47] Particle Data Group Collaboration, “Review of Particle Physics”, Chin. Phys. C 38 (2014)
090001, doi:10.1088/1674-1137/38/9/090001.
[48] CMS Collaboration, “Measurement of the top-quark mass in all-jets tt events in pp collisions at√s=7 TeV”, Eur. Phys. J. C 74 (2014) 2758,
doi:10.1140/epjc/s10052-014-2758-x, arXiv:1307.4617.
[49] CMS Collaboration, “CMS Luminosity Based on Pixel Cluster Counting - Summer 2013 Update”, CMS Physics Analysis Summary CMS-PAS-LUM-13-001, 2013.
[50] S. Alekhin et al., “The PDF4LHC Working Group Interim Report”, (2011). arXiv:1101.0536.
[51] M. Botje et al., “The PDF4LHC Working Group Interim Recommendations”, (2011). arXiv:1101.0538.
[52] P. Z. Skands, “Tuning Monte Carlo Generators: The Perugia Tunes”, Phys. Rev. D 82 (2010) 074018, doi:10.1103/PhysRevD.82.074018, arXiv:1005.3457.
[53] G. D’Agostini, “A multidimensional unfolding method based on Bayes’ theorem”, Nucl. Instrum. Meth. A 362 (1995) 487, doi:10.1016/0168-9002(95)00274-X.
[54] T. Adye, “Unfolding algorithms and tests using RooUnfold”, in Proceedings of the PHYSTAT 2011 Workshop, CERN, Geneva, Switzerland, January 2011, CERN-2011-006, p. 313. 2011. arXiv:1105.1160.
[55] M. Czakon and A. Mitov, “Top++: A program for the calculation of the top-pair cross-section at hadron colliders”, Comput. Phys. Commun. 185 (2014) 2930, doi:10.1016/j.cpc.2014.06.021, arXiv:1112.5675.
[56] M. Czakon, P. Fiedler, and A. Mitov, “Total Top-Quark Pair-Production Cross Section at Hadron Colliders ThroughO(α4S)”, Phys. Rev. Lett. 110 (2013) 252004,
19
A
The CMS Collaboration
Yerevan Physics Institute, Yerevan, Armenia
V. Khachatryan, A.M. Sirunyan, A. Tumasyan
Institut f ¨ur Hochenergiephysik der OeAW, Wien, Austria
W. Adam, E. Asilar, T. Bergauer, J. Brandstetter, E. Brondolin, M. Dragicevic, J. Er ¨o, M. Flechl, M. Friedl, R. Fr ¨uhwirth1, V.M. Ghete, C. Hartl, N. H ¨ormann, J. Hrubec, M. Jeitler1, V. Kn ¨unz, A. K ¨onig, M. Krammer1, I. Kr¨atschmer, D. Liko, T. Matsushita, I. Mikulec, D. Rabady2, B. Rahbaran, H. Rohringer, J. Schieck1, R. Sch ¨ofbeck, J. Strauss, W. Treberer-Treberspurg, W. Waltenberger, C.-E. Wulz1
National Centre for Particle and High Energy Physics, Minsk, Belarus
V. Mossolov, N. Shumeiko, J. Suarez Gonzalez
Universiteit Antwerpen, Antwerpen, Belgium
S. Alderweireldt, T. Cornelis, E.A. De Wolf, X. Janssen, A. Knutsson, J. Lauwers, S. Luyckx, M. Van De Klundert, H. Van Haevermaet, P. Van Mechelen, N. Van Remortel, A. Van Spilbeeck
Vrije Universiteit Brussel, Brussel, Belgium
S. Abu Zeid, F. Blekman, J. D’Hondt, N. Daci, I. De Bruyn, K. Deroover, N. Heracleous, J. Keaveney, S. Lowette, L. Moreels, A. Olbrechts, Q. Python, D. Strom, S. Tavernier, W. Van Doninck, P. Van Mulders, G.P. Van Onsem, I. Van Parijs
Universit´e Libre de Bruxelles, Bruxelles, Belgium
P. Barria, H. Brun, C. Caillol, B. Clerbaux, G. De Lentdecker, G. Fasanella, L. Favart, A. Grebenyuk, G. Karapostoli, T. Lenzi, A. L´eonard, T. Maerschalk, A. Marinov, L. Perni`e, A. Randle-conde, T. Reis, T. Seva, C. Vander Velde, P. Vanlaer, R. Yonamine, F. Zenoni, F. Zhang3
Ghent University, Ghent, Belgium
K. Beernaert, L. Benucci, A. Cimmino, S. Crucy, D. Dobur, A. Fagot, G. Garcia, M. Gul, J. Mccartin, A.A. Ocampo Rios, D. Poyraz, D. Ryckbosch, S. Salva, M. Sigamani, N. Strobbe, M. Tytgat, W. Van Driessche, E. Yazgan, N. Zaganidis
Universit´e Catholique de Louvain, Louvain-la-Neuve, Belgium
S. Basegmez, C. Beluffi4, O. Bondu, S. Brochet, G. Bruno, A. Caudron, L. Ceard, G.G. Da Silveira, C. Delaere, D. Favart, L. Forthomme, A. Giammanco5, J. Hollar, A. Jafari, P. Jez, M. Komm, V. Lemaitre, A. Mertens, C. Nuttens, L. Perrini, A. Pin, K. Piotrzkowski, A. Popov6, L. Quertenmont, M. Selvaggi, M. Vidal Marono
Universit´e de Mons, Mons, Belgium
N. Beliy, G.H. Hammad
Centro Brasileiro de Pesquisas Fisicas, Rio de Janeiro, Brazil
W.L. Ald´a J ´unior, F.L. Alves, G.A. Alves, L. Brito, M. Correa Martins Junior, M. Hamer, C. Hensel, C. Mora Herrera, A. Moraes, M.E. Pol, P. Rebello Teles
Universidade do Estado do Rio de Janeiro, Rio de Janeiro, Brazil
E. Belchior Batista Das Chagas, W. Carvalho, J. Chinellato7, A. Cust ´odio, E.M. Da Costa, D. De Jesus Damiao, C. De Oliveira Martins, S. Fonseca De Souza, L.M. Huertas Guativa, H. Malbouisson, D. Matos Figueiredo, L. Mundim, H. Nogima, W.L. Prado Da Silva, A. Santoro, A. Sznajder, E.J. Tonelli Manganote7, A. Vilela Pereira
Universidade Estadual Paulistaa, Universidade Federal do ABCb, S˜ao Paulo, Brazil
20 A The CMS Collaboration
E.M. Gregoresb, P.G. Mercadanteb, C.S. Moona,8, S.F. Novaesa, Sandra S. Padulaa, D. Romero Abad, J.C. Ruiz Vargas
Institute for Nuclear Research and Nuclear Energy, Sofia, Bulgaria
A. Aleksandrov, R. Hadjiiska, P. Iaydjiev, M. Rodozov, S. Stoykova, G. Sultanov, M. Vutova
University of Sofia, Sofia, Bulgaria
A. Dimitrov, I. Glushkov, L. Litov, B. Pavlov, P. Petkov
Institute of High Energy Physics, Beijing, China
M. Ahmad, J.G. Bian, G.M. Chen, H.S. Chen, M. Chen, T. Cheng, R. Du, C.H. Jiang, R. Plestina9, F. Romeo, S.M. Shaheen, J. Tao, C. Wang, Z. Wang, H. Zhang
State Key Laboratory of Nuclear Physics and Technology, Peking University, Beijing, China
C. Asawatangtrakuldee, Y. Ban, Q. Li, S. Liu, Y. Mao, S.J. Qian, D. Wang, Z. Xu
Universidad de Los Andes, Bogota, Colombia
C. Avila, A. Cabrera, L.F. Chaparro Sierra, C. Florez, J.P. Gomez, B. Gomez Moreno, J.C. Sanabria
University of Split, Faculty of Electrical Engineering, Mechanical Engineering and Naval Architecture, Split, Croatia
N. Godinovic, D. Lelas, I. Puljak, P.M. Ribeiro Cipriano
University of Split, Faculty of Science, Split, Croatia
Z. Antunovic, M. Kovac
Institute Rudjer Boskovic, Zagreb, Croatia
V. Brigljevic, K. Kadija, J. Luetic, S. Micanovic, L. Sudic
University of Cyprus, Nicosia, Cyprus
A. Attikis, G. Mavromanolakis, J. Mousa, C. Nicolaou, F. Ptochos, P.A. Razis, H. Rykaczewski
Charles University, Prague, Czech Republic
M. Bodlak, M. Finger10, M. Finger Jr.10
Academy of Scientific Research and Technology of the Arab Republic of Egypt, Egyptian Network of High Energy Physics, Cairo, Egypt
A.A. Abdelalim11,12, A. Awad, M. El Sawy13,14, A. Mahrous11, A. Radi14,15
National Institute of Chemical Physics and Biophysics, Tallinn, Estonia
B. Calpas, M. Kadastik, M. Murumaa, M. Raidal, A. Tiko, C. Veelken
Department of Physics, University of Helsinki, Helsinki, Finland
P. Eerola, J. Pekkanen, M. Voutilainen
Helsinki Institute of Physics, Helsinki, Finland
J. H¨ark ¨onen, V. Karim¨aki, R. Kinnunen, T. Lamp´en, K. Lassila-Perini, S. Lehti, T. Lind´en, P. Luukka, T. M¨aenp¨a¨a, T. Peltola, E. Tuominen, J. Tuominiemi, E. Tuovinen, L. Wendland
Lappeenranta University of Technology, Lappeenranta, Finland
J. Talvitie, T. Tuuva
DSM/IRFU, CEA/Saclay, Gif-sur-Yvette, France
M. Besancon, F. Couderc, M. Dejardin, D. Denegri, B. Fabbro, J.L. Faure, C. Favaro, F. Ferri, S. Ganjour, A. Givernaud, P. Gras, G. Hamel de Monchenault, P. Jarry, E. Locci, M. Machet, J. Malcles, J. Rander, A. Rosowsky, M. Titov, A. Zghiche
21
Laboratoire Leprince-Ringuet, Ecole Polytechnique, IN2P3-CNRS, Palaiseau, France
I. Antropov, S. Baffioni, F. Beaudette, P. Busson, L. Cadamuro, E. Chapon, C. Charlot, T. Dahms, O. Davignon, N. Filipovic, A. Florent, R. Granier de Cassagnac, S. Lisniak, L. Mastrolorenzo, P. Min´e, I.N. Naranjo, M. Nguyen, C. Ochando, G. Ortona, P. Paganini, P. Pigard, S. Regnard, R. Salerno, J.B. Sauvan, Y. Sirois, T. Strebler, Y. Yilmaz, A. Zabi
Institut Pluridisciplinaire Hubert Curien, Universit´e de Strasbourg, Universit´e de Haute Alsace Mulhouse, CNRS/IN2P3, Strasbourg, France
J.-L. Agram16, J. Andrea, A. Aubin, D. Bloch, J.-M. Brom, M. Buttignol, E.C. Chabert, N. Chanon, C. Collard, E. Conte16, X. Coubez, J.-C. Fontaine16, D. Gel´e, U. Goerlach, C. Goetzmann, A.-C. Le Bihan, J.A. Merlin2, K. Skovpen, P. Van Hove
Centre de Calcul de l’Institut National de Physique Nucleaire et de Physique des Particules, CNRS/IN2P3, Villeurbanne, France
S. Gadrat
Universit´e de Lyon, Universit´e Claude Bernard Lyon 1, CNRS-IN2P3, Institut de Physique Nucl´eaire de Lyon, Villeurbanne, France
S. Beauceron, C. Bernet, G. Boudoul, E. Bouvier, C.A. Carrillo Montoya, R. Chierici, D. Contardo, B. Courbon, P. Depasse, H. El Mamouni, J. Fan, J. Fay, S. Gascon, M. Gouzevitch, B. Ille, F. Lagarde, I.B. Laktineh, M. Lethuillier, L. Mirabito, A.L. Pequegnot, S. Perries, J.D. Ruiz Alvarez, D. Sabes, L. Sgandurra, V. Sordini, M. Vander Donckt, P. Verdier, S. Viret
Georgian Technical University, Tbilisi, Georgia
T. Toriashvili17
Tbilisi State University, Tbilisi, Georgia
Z. Tsamalaidze10
RWTH Aachen University, I. Physikalisches Institut, Aachen, Germany
C. Autermann, S. Beranek, M. Edelhoff, L. Feld, A. Heister, M.K. Kiesel, K. Klein, M. Lipinski, A. Ostapchuk, M. Preuten, F. Raupach, S. Schael, J.F. Schulte, T. Verlage, H. Weber, B. Wittmer, V. Zhukov6
RWTH Aachen University, III. Physikalisches Institut A, Aachen, Germany
M. Ata, M. Brodski, E. Dietz-Laursonn, D. Duchardt, M. Endres, M. Erdmann, S. Erdweg, T. Esch, R. Fischer, A. G ¨uth, T. Hebbeker, C. Heidemann, K. Hoepfner, D. Klingebiel, S. Knutzen, P. Kreuzer, M. Merschmeyer, A. Meyer, P. Millet, M. Olschewski, K. Padeken, P. Papacz, T. Pook, M. Radziej, H. Reithler, M. Rieger, F. Scheuch, L. Sonnenschein, D. Teyssier, S. Th ¨uer
RWTH Aachen University, III. Physikalisches Institut B, Aachen, Germany
V. Cherepanov, Y. Erdogan, G. Fl ¨ugge, H. Geenen, M. Geisler, F. Hoehle, B. Kargoll, T. Kress, Y. Kuessel, A. K ¨unsken, J. Lingemann2, A. Nehrkorn, A. Nowack, I.M. Nugent, C. Pistone, O. Pooth, A. Stahl
Deutsches Elektronen-Synchrotron, Hamburg, Germany
M. Aldaya Martin, I. Asin, N. Bartosik, O. Behnke, U. Behrens, A.J. Bell, K. Borras18, A. Burgmeier, A. Cakir, L. Calligaris, A. Campbell, S. Choudhury, F. Costanza, C. Diez Pardos, G. Dolinska, S. Dooling, T. Dorland, G. Eckerlin, D. Eckstein, T. Eichhorn, G. Flucke, E. Gallo19, J. Garay Garcia, A. Geiser, A. Gizhko, P. Gunnellini, J. Hauk, M. Hempel20, H. Jung, A. Kalogeropoulos, O. Karacheban20, M. Kasemann, P. Katsas, J. Kieseler, C. Kleinwort, I. Korol, W. Lange, J. Leonard, K. Lipka, A. Lobanov, W. Lohmann20, R. Mankel, I. Marfin20, I.-A. Melzer-Pellmann, A.B. Meyer, G. Mittag, J. Mnich, A. Mussgiller, S. Naumann-Emme, A. Nayak,
22 A The CMS Collaboration
E. Ntomari, H. Perrey, D. Pitzl, R. Placakyte, A. Raspereza, B. Roland, M. ¨O. Sahin, P. Saxena, T. Schoerner-Sadenius, M. Schr ¨oder, C. Seitz, S. Spannagel, K.D. Trippkewitz, R. Walsh, C. Wissing
University of Hamburg, Hamburg, Germany
V. Blobel, M. Centis Vignali, A.R. Draeger, J. Erfle, E. Garutti, K. Goebel, D. Gonzalez, M. G ¨orner, J. Haller, M. Hoffmann, R.S. H ¨oing, A. Junkes, R. Klanner, R. Kogler, T. Lapsien, T. Lenz, I. Marchesini, D. Marconi, M. Meyer, D. Nowatschin, J. Ott, F. Pantaleo2, T. Peiffer, A. Perieanu, N. Pietsch, J. Poehlsen, D. Rathjens, C. Sander, H. Schettler, P. Schleper, E. Schlieckau, A. Schmidt, J. Schwandt, M. Seidel, V. Sola, H. Stadie, G. Steinbr ¨uck, H. Tholen, D. Troendle, E. Usai, L. Vanelderen, A. Vanhoefer, B. Vormwald
Institut f ¨ur Experimentelle Kernphysik, Karlsruhe, Germany
M. Akbiyik, C. Barth, C. Baus, J. Berger, C. B ¨oser, E. Butz, T. Chwalek, F. Colombo, W. De Boer, A. Descroix, A. Dierlamm, S. Fink, F. Frensch, M. Giffels, A. Gilbert, F. Hartmann2, S.M. Heindl, U. Husemann, I. Katkov6, A. Kornmayer2, P. Lobelle Pardo, B. Maier, H. Mildner, M.U. Mozer, T. M ¨uller, Th. M ¨uller, M. Plagge, G. Quast, K. Rabbertz, S. R ¨ocker, F. Roscher, H.J. Simonis, F.M. Stober, R. Ulrich, J. Wagner-Kuhr, S. Wayand, M. Weber, T. Weiler, C. W ¨ohrmann, R. Wolf
Institute of Nuclear and Particle Physics (INPP), NCSR Demokritos, Aghia Paraskevi, Greece
G. Anagnostou, G. Daskalakis, T. Geralis, V.A. Giakoumopoulou, A. Kyriakis, D. Loukas, A. Psallidas, I. Topsis-Giotis
University of Athens, Athens, Greece
A. Agapitos, S. Kesisoglou, A. Panagiotou, N. Saoulidou, E. Tziaferi
University of Io´annina, Io´annina, Greece
I. Evangelou, G. Flouris, C. Foudas, P. Kokkas, N. Loukas, N. Manthos, I. Papadopoulos, E. Paradas, J. Strologas
Wigner Research Centre for Physics, Budapest, Hungary
G. Bencze, C. Hajdu, A. Hazi, P. Hidas, D. Horvath21, F. Sikler, V. Veszpremi, G. Vesztergombi22, A.J. Zsigmond
Institute of Nuclear Research ATOMKI, Debrecen, Hungary
N. Beni, S. Czellar, J. Karancsi23, J. Molnar, Z. Szillasi
University of Debrecen, Debrecen, Hungary
M. Bart ´ok24, A. Makovec, P. Raics, Z.L. Trocsanyi, B. Ujvari
National Institute of Science Education and Research, Bhubaneswar, India
P. Mal, K. Mandal, D.K. Sahoo, N. Sahoo, S.K. Swain
Panjab University, Chandigarh, India
S. Bansal, S.B. Beri, V. Bhatnagar, R. Chawla, R. Gupta, U.Bhawandeep, A.K. Kalsi, A. Kaur, M. Kaur, R. Kumar, A. Mehta, M. Mittal, J.B. Singh, G. Walia
University of Delhi, Delhi, India
Ashok Kumar, A. Bhardwaj, B.C. Choudhary, R.B. Garg, A. Kumar, S. Malhotra, M. Naimuddin, N. Nishu, K. Ranjan, R. Sharma, V. Sharma
Saha Institute of Nuclear Physics, Kolkata, India
S. Bhattacharya, K. Chatterjee, S. Dey, S. Dutta, Sa. Jain, N. Majumdar, A. Modak, K. Mondal, S. Mukherjee, S. Mukhopadhyay, A. Roy, D. Roy, S. Roy Chowdhury, S. Sarkar, M. Sharan
23
Bhabha Atomic Research Centre, Mumbai, India
A. Abdulsalam, R. Chudasama, D. Dutta, V. Jha, V. Kumar, A.K. Mohanty2, L.M. Pant, P. Shukla, A. Topkar
Tata Institute of Fundamental Research, Mumbai, India
T. Aziz, S. Banerjee, S. Bhowmik25, R.M. Chatterjee, R.K. Dewanjee, S. Dugad, S. Ganguly, S. Ghosh, M. Guchait, A. Gurtu26, G. Kole, S. Kumar, B. Mahakud, M. Maity25, G. Majumder, K. Mazumdar, S. Mitra, G.B. Mohanty, B. Parida, T. Sarkar25, N. Sur, B. Sutar, N. Wickramage27
Indian Institute of Science Education and Research (IISER), Pune, India
S. Chauhan, S. Dube, S. Sharma
Institute for Research in Fundamental Sciences (IPM), Tehran, Iran
H. Bakhshiansohi, H. Behnamian, S.M. Etesami28, A. Fahim29, R. Goldouzian, M. Khakzad, M. Mohammadi Najafabadi, M. Naseri, S. Paktinat Mehdiabadi, F. Rezaei Hosseinabadi, B. Safarzadeh30, M. Zeinali
University College Dublin, Dublin, Ireland
M. Felcini, M. Grunewald
INFN Sezione di Baria, Universit`a di Barib, Politecnico di Baric, Bari, Italy
M. Abbresciaa,b, C. Calabriaa,b, C. Caputoa,b, A. Colaleoa, D. Creanzaa,c, L. Cristellaa,b, N. De Filippisa,c, M. De Palmaa,b, L. Fiorea, G. Iasellia,c, G. Maggia,c, M. Maggia, G. Minielloa,b, S. Mya,c, S. Nuzzoa,b, A. Pompilia,b, G. Pugliesea,c, R. Radognaa,b, A. Ranieria, G. Selvaggia,b, L. Silvestrisa,2, R. Vendittia,b, P. Verwilligena
INFN Sezione di Bolognaa, Universit`a di Bolognab, Bologna, Italy
G. Abbiendia, C. Battilana2, A.C. Benvenutia, D. Bonacorsia,b, S. Braibant-Giacomellia,b, L. Brigliadoria,b, R. Campaninia,b, P. Capiluppia,b, A. Castroa,b, F.R. Cavalloa, S.S. Chhibraa,b, G. Codispotia,b, M. Cuffiania,b, G.M. Dallavallea, F. Fabbria, A. Fanfania,b, D. Fasanellaa,b, P. Giacomellia, C. Grandia, L. Guiduccia,b, S. Marcellinia, G. Masettia, A. Montanaria, F.L. Navarriaa,b, A. Perrottaa, A.M. Rossia,b, T. Rovellia,b, G.P. Sirolia,b, N. Tosia,b, R. Travaglinia,b
INFN Sezione di Cataniaa, Universit`a di Cataniab, CSFNSMc, Catania, Italy
G. Cappelloa, M. Chiorbolia,b, S. Costaa,b, F. Giordanoa,b, R. Potenzaa,b, A. Tricomia,b, C. Tuvea,b
INFN Sezione di Firenzea, Universit`a di Firenzeb, Firenze, Italy
G. Barbaglia, V. Ciullia,b, C. Civininia, R. D’Alessandroa,b, E. Focardia,b, S. Gonzia,b, V. Goria,b, P. Lenzia,b, M. Meschinia, S. Paolettia, G. Sguazzonia, A. Tropianoa,b, L. Viliania,b
INFN Laboratori Nazionali di Frascati, Frascati, Italy
L. Benussi, S. Bianco, F. Fabbri, D. Piccolo, F. Primavera
INFN Sezione di Genovaa, Universit`a di Genovab, Genova, Italy
V. Calvellia,b, F. Ferroa, M. Lo Veterea,b, M.R. Mongea,b, E. Robuttia, S. Tosia,b
INFN Sezione di Milano-Bicoccaa, Universit`a di Milano-Bicoccab, Milano, Italy
L. Brianza, M.E. Dinardoa,b, S. Fiorendia,b, S. Gennaia, R. Gerosaa,b, A. Ghezzia,b, P. Govonia,b, S. Malvezzia, R.A. Manzonia,b, B. Marzocchia,b,2, D. Menascea, L. Moronia, M. Paganonia,b, D. Pedrinia, S. Ragazzia,b, N. Redaellia, T. Tabarelli de Fatisa,b
24 A The CMS Collaboration
Basilicatac, Potenza, Italy, Universit`a G. Marconid, Roma, Italy
S. Buontempoa, N. Cavalloa,c, S. Di Guidaa,d,2, M. Espositoa,b, F. Fabozzia,c, A.O.M. Iorioa,b, G. Lanzaa, L. Listaa, S. Meolaa,d,2, M. Merolaa, P. Paoluccia,2, C. Sciaccaa,b, F. Thyssen
INFN Sezione di Padova a, Universit`a di Padova b, Padova, Italy, Universit`a di Trento c,
Trento, Italy
P. Azzia,2, N. Bacchettaa, L. Benatoa,b, D. Biselloa,b, A. Bolettia,b, R. Carlina,b, P. Checchiaa, M. Dall’Ossoa,b,2, T. Dorigoa, F. Gasparinia,b, U. Gasparinia,b, A. Gozzelinoa, S. Lacapraraa, M. Margonia,b, A.T. Meneguzzoa,b, M. Michelottoa, F. Montecassianoa, M. Passaseoa, J. Pazzinia,b, M. Pegoraroa, N. Pozzobona,b, P. Ronchesea,b, F. Simonettoa,b, E. Torassaa, M. Tosia,b, S. Vaninia,b, M. Zanetti, P. Zottoa,b, A. Zucchettaa,b,2
INFN Sezione di Paviaa, Universit`a di Paviab, Pavia, Italy
A. Braghieria, A. Magnania, P. Montagnaa,b, S.P. Rattia,b, V. Rea, C. Riccardia,b, P. Salvinia, I. Vaia, P. Vituloa,b
INFN Sezione di Perugiaa, Universit`a di Perugiab, Perugia, Italy
L. Alunni Solestizia,b, M. Biasinia,b, G.M. Bileia, D. Ciangottinia,b,2, L. Fan `oa,b, P. Laricciaa,b, G. Mantovania,b, M. Menichellia, A. Sahaa, A. Santocchiaa,b, A. Spieziaa,b
INFN Sezione di Pisaa, Universit`a di Pisab, Scuola Normale Superiore di Pisac, Pisa, Italy
K. Androsova,31, P. Azzurria, G. Bagliesia, J. Bernardinia, T. Boccalia, G. Broccoloa,c, R. Castaldia, M.A. Cioccia,31, R. Dell’Orsoa, S. Donatoa,c,2, G. Fedi, L. Fo`aa,c†, A. Giassia, M.T. Grippoa,31, F. Ligabuea,c, T. Lomtadzea, L. Martinia,b, A. Messineoa,b, F. Pallaa, A. Rizzia,b, A. Savoy-Navarroa,32, A.T. Serbana, P. Spagnoloa, P. Squillaciotia,31, R. Tenchinia, G. Tonellia,b, A. Venturia, P.G. Verdinia
INFN Sezione di Romaa, Universit`a di Romab, Roma, Italy
L. Baronea,b, F. Cavallaria, G. D’imperioa,b,2, D. Del Rea,b, M. Diemoza, S. Gellia,b, C. Jordaa, E. Longoa,b, F. Margarolia,b, P. Meridiania, G. Organtinia,b, R. Paramattia, F. Preiatoa,b, S. Rahatloua,b, C. Rovellia, F. Santanastasioa,b, P. Traczyka,b,2
INFN Sezione di Torino a, Universit`a di Torino b, Torino, Italy, Universit`a del Piemonte
Orientalec, Novara, Italy
N. Amapanea,b, R. Arcidiaconoa,c,2, S. Argiroa,b, M. Arneodoa,c, R. Bellana,b, C. Biinoa, N. Cartigliaa, M. Costaa,b, R. Covarellia,b, A. Deganoa,b, N. Demariaa, L. Fincoa,b,2, B. Kiania,b, C. Mariottia, S. Masellia, E. Migliorea,b, V. Monacoa,b, E. Monteila,b, M. Musicha, M.M. Obertinoa,b, L. Pachera,b, N. Pastronea, M. Pelliccionia, G.L. Pinna Angionia,b, F. Raveraa,b, A. Romeroa,b, M. Ruspaa,c, R. Sacchia,b, A. Solanoa,b, A. Staianoa, U. Tamponia
INFN Sezione di Triestea, Universit`a di Triesteb, Trieste, Italy
S. Belfortea, V. Candelisea,b,2, M. Casarsaa, F. Cossuttia, G. Della Riccaa,b, B. Gobboa, C. La Licataa,b, M. Maronea,b, A. Schizzia,b, A. Zanettia
Kangwon National University, Chunchon, Korea
A. Kropivnitskaya, S.K. Nam
Kyungpook National University, Daegu, Korea
D.H. Kim, G.N. Kim, M.S. Kim, D.J. Kong, S. Lee, Y.D. Oh, A. Sakharov, D.C. Son
Chonbuk National University, Jeonju, Korea
25
Chonnam National University, Institute for Universe and Elementary Particles, Kwangju, Korea
S. Song
Korea University, Seoul, Korea
S. Choi, Y. Go, D. Gyun, B. Hong, M. Jo, H. Kim, Y. Kim, B. Lee, K. Lee, K.S. Lee, S. Lee, S.K. Park, Y. Roh
Seoul National University, Seoul, Korea
H.D. Yoo
University of Seoul, Seoul, Korea
M. Choi, H. Kim, J.H. Kim, J.S.H. Lee, I.C. Park, G. Ryu, M.S. Ryu
Sungkyunkwan University, Suwon, Korea
Y. Choi, J. Goh, D. Kim, E. Kwon, J. Lee, I. Yu
Vilnius University, Vilnius, Lithuania
A. Juodagalvis, J. Vaitkus
National Centre for Particle Physics, Universiti Malaya, Kuala Lumpur, Malaysia
I. Ahmed, Z.A. Ibrahim, J.R. Komaragiri, M.A.B. Md Ali33, F. Mohamad Idris34, W.A.T. Wan Abdullah, M.N. Yusli
Centro de Investigacion y de Estudios Avanzados del IPN, Mexico City, Mexico
E. Casimiro Linares, H. Castilla-Valdez, E. De La Cruz-Burelo, I. Heredia-De La Cruz35, A. Hernandez-Almada, R. Lopez-Fernandez, A. Sanchez-Hernandez
Universidad Iberoamericana, Mexico City, Mexico
S. Carrillo Moreno, F. Vazquez Valencia
Benemerita Universidad Autonoma de Puebla, Puebla, Mexico
I. Pedraza, H.A. Salazar Ibarguen
Universidad Aut ´onoma de San Luis Potos´ı, San Luis Potos´ı, Mexico
A. Morelos Pineda
University of Auckland, Auckland, New Zealand
D. Krofcheck
University of Canterbury, Christchurch, New Zealand
P.H. Butler
National Centre for Physics, Quaid-I-Azam University, Islamabad, Pakistan
A. Ahmad, M. Ahmad, Q. Hassan, H.R. Hoorani, W.A. Khan, T. Khurshid, M. Shoaib
National Centre for Nuclear Research, Swierk, Poland
H. Bialkowska, M. Bluj, B. Boimska, T. Frueboes, M. G ´orski, M. Kazana, K. Nawrocki, K. Romanowska-Rybinska, M. Szleper, P. Zalewski
Institute of Experimental Physics, Faculty of Physics, University of Warsaw, Warsaw, Poland
G. Brona, K. Bunkowski, A. Byszuk36, K. Doroba, A. Kalinowski, M. Konecki, J. Krolikowski, M. Misiura, M. Olszewski, M. Walczak
Laborat ´orio de Instrumenta¸c˜ao e F´ısica Experimental de Part´ıculas, Lisboa, Portugal