The Impact of Credit Ratings on the
Decision-making Process behind
Capital Structures
Joana de Oliveira Gomes
152418098
Dissertation written under the supervision of
Professor Diana Bonfim
Dissertation submitted in partial fulfilment of requirements
for the MSc in Finance, at the Universidade Católica
Portuguesa
.
The Impact of Credit Ratings on the Decision-making Process behind Capital Structures Joana de Oliveira Gomes
152418098
Abstract
The role of credit ratings in influencing capital structure decisions has generated a lot of discussion. This thesis intends to examine whether credit ratings directly impact the marginal financing behaviors of U.S. firms. Kisgen (2006) engaged in an earlier seminal discussion of this topic. His arguments on the discrete costs associated with credit rating levels suggest that firms near a credit rating change issue less debt relative to equity than firms farther away from a rating change. This concept became henceforth known as the Credit Rating-Capital Structure (CR-CS) hypothesis. Through the empirical analysis of 14,037 firm-years between 2001 and 2017, our work confirms Kisgen’s (2006) findings that firms with a plus or minus rating have a propensity to use less debt relative to equity, than firms in the middle, supporting the CR-CS hypothesis. However, this significance seems to be mainly driven by the minus designation. Therefore, firms with an upgrade potential do not appear to significantly adjust their debt issuing patterns. Moreover, we confirm that firms are typically most concerned about broad rating levels, in which the access to the commercial paper is affected. Lastly, we find that credit ratings have a significant effect on capital structures, both during and prior to the financial crisis periods. Overall, we provide evidence that the potential costs of downgrades directly impact capital structure decisions, and managers are thus likely to be concerned with ratings-triggered costs.
Keywords: Credit Rating, Capital Structure, CR-CS hypothesis JEL classification: G24, G32
The Impact of Credit Ratings on the Decision-making Process behind Capital Structures Joana de Oliveira Gomes
152418098
Resumo
O papel que o rating de crédito tem nas decisões da estrutura de capitais das empresas tem gerado uma larga discussão. Esta tese analisa em que medida o rating influencia diretamente a escolha da estrutura de capitais das empresas norte americanas. Kisgen (2006), estreia-se neste campo de análise desenvolvendo a hipótese CR-CS. O autor afirma que, devido à existência de custos associados aos níveis de rating, as empresas próximas de uma variação de rating tendem a emitir menos dívida relativamente a capitais próprios, face a empresas que não estão próximas desta variação. Através de uma análise empírica de 14,037 empresas-anos entre 2001 e 2017, confirmamos os resultados de Kisgen (2006) de que, empresas com um mais ou um menos no seu rating, têm uma menor propensão para usar dívida face a capitais próprios, do que aquelas que não estão em vias de sofrer alteração, suportando a hipótese CR-CS. Contudo, a significância destes testes parece estar maioritariamente associada ao coeficiente com um menos no seu rating. Deste modo, empresas com um potencial de upgrade tendem a não ajustar os seus padrões de emissão de dívida. Confirmamos, também, que as empresas preocupam-se principalmente com níveis de rating cujo acesso ao mercado do papel comercial está em causa. Por fim, validamos a hipótese CR-CS nos períodos pré-crise e crise financeira. Em geral, os resultados sugerem que os custos implícitos numa descida do rating impactam diretamente as decisões de estrutura de capital, facto que se afigura como fator de preocupação acrescido para os gestores.
Palavras-chave: rating de crédito, estrutura de capitais, hipótese CR-CS Classificação JEL: G24, G32
Acknowledgment
My first sincerely thanks cannot go to anyone rather than my family. To my parents, Maria João and João Paulo, thank you for all your help, support, love and for making me the person that I am proudly today. None of this would be possible without you always by my side. To my dear grandparents, Maria Adelaide and José Luís, thank you for being like parents to me. To my sister, Inês, thank you for always being there for me, either bothering me or making me laugh. The warmest thank you to my supervisor, Professor Diana Bonfim. Your support during this entire semester, the wise words, the brilliant ideas, the encouragement proven to be one of the most valuable assets to this thesis conclusion. I acknowledge that I was only able to overcome all my difficulties and come up with a project that I am really proud thanks to you.
Finally, to all my friends a special thank you. All the moments spent together, all the laughs, all the knowledge shared provide me the most amazing time at Católica. A special thanks to you Inês, Teresa, Carlota, Catarina, Murta, José, Diogo and Kiko.
To Tiago, thank you for all the love.
Table of Contents
1. Introduction ... 1
2. Literature Review ... 3
2.1. Influence of Credit Ratings for Capital Structure policy ... 3
2.2. Credit Ratings in the Context of Capital Structure Theories ... 5
2.2.1 Trade-off Theory ... 6
2.2.2 Pecking Order Theory ... 6
3. Methodology ... 7
4. Data and Summary Statistics ... 8
5. Credit rating impact on capital structure decision-POM tests ... 15
6. Credit rating impact on capital structure decisions- Credit Score tests ... 21
7. Credit rating impact on capital structure decisions by broad rating ... 25
8. CR-CS model within the context of capital structure theories ... 28
9. Conclusions and further research ... 30
10. References ... 33
List of Tables
Table I: Leverage by rating- Summary statistics ... 11
Table II: Capital Activity- Summary statistics ... 12
Table III: Influence of credit rating - POM Test ... 16
Table IV: Influence of credit rating- POM coefficients by year ... 18
Table V: Influence of credit rating - POM coefficients by period ... 19
Table VI: Influence of credit rating - Credit Score Test ... 23
Table VII: Influence of Credit Rating by broad rating ... 25
Table VIII: Influence of credit rating -Investment Grade to Speculative Grade ... 27 Table IX: SSM Tests of Pecking-order and Trade-off theories incorporating rating concerns 30
List of Figures
Figure 1: Debt and equity issuance by rating ... 13 Figure 2: Average NetDIss by rating ... 14
List of Appendices
Appendix I: Capital market activity by rating- Kisgen (2006, p.1051) ... 37
Appendix II: Correlation Matrix excluding large debt offering- Plus or Minus Test ... 38
Appendix III: Correlation Matrix excluding large debt offering- Credit Score Test ... 38
Appendix IV: Influence of credit rating - POM test ... 39
Appendix V: Influence of credit rating - Credit score test ... 40
List of Abbreviations
CR-CS- Credit rating- capital structure DEF- Deficit in Funds
EBITDA – Earnings before interest, tax, depreciation and amortization HOL- High or Low
POM- Plus or Minus
SIC- Standard Industrial Classification SSM - Shyam-Sunder and Myers
1. Introduction
Credit ratings have become a broadly accepted and relevant metric for assessing the creditworthiness of a given firm in the financial markets. Managers seemingly acknowledge the importance of credit ratings and therefore consider such metrics when making capital structure decisions. For instance, an April 2019 survey from Bank of America Merrill Lynch reported that “more than 40% of stock-market fund managers wanted companies to use leftover cash to pay down debt” in order to avoid a credit rating downgrade. The way credit ratings affect capital structures has not always been this significant, however. Kisgen (2006) ’s findings marked a watershed moment, with several managers subsequently recognizing that ratings impose
frictions. Since then, a large body of literature has emerged on the relationship between credit
ratings and firms’ capital structure policies.
There is little consensus on whether credit ratings play a meaningful economic role in
influencing capital structure decisions. Some authors provide evidence that it positively impacts
the capital structure decisions(e.g., Kisgen, 2006; Kisgen, 2009; Tang, 2009; Mittoo and Zhang,
2010; Kemper and Rao, 2013), whereas some literature neglects credit ratings as a determining
factor (e.g., Antoniou, Guney, and Paudyal, 2008; González and González, 2008; Fan, Titman,
and Twite, 2012). Such disagreements within this field motivated us to investigate whether credit ratings impact the capital structure policies of US firms in contemporary settings. Kisgen (2006) provides a first examination of this topic, arguing that each credit rating level has an inherent discrete cost. Consistent with this assertation, he demonstrates that firms with either an upgrade or a downgrade potential will on average select more equity relative to debt, than firms farther away from a change in rating. Regardless of whether they do so to benefit from a potential upgrade or to avoid the additional costs of a potential downgrade, this mechanism is henceforth as the Credit Rating-Capital Structure hypothesis.
The empirical tests we performed in our thesis build upon Kisgen (2006) ’s earlier work. We undertook to examine over a set timeframe, whether capital structure decisions are directly affected by ratings concerns. This was done by regressing measures of debt net of equity issuance on dummy variables which capture a firm’s proximity to a potential change in credit rating, while integrating controls for firm-specific factors. We constructed two different measures to distinguish between firms with an upgrade or downgrade potential versus those less likely to see any change in their ratings. This was done in order to address concerns of a
potential change in broad rating or a potential change of any kind. Our empirical tests were further modified through the application of Shyam-Sunder and Myers (1999) tests, for the added assessment of the validity of the CR-CS hypothesis within the wider context of the trade-off and pecking order theories.
Through an empirical analysis of 14,037 firm-year observations between 2001 and 2017, we confirm Kisgen’s (2006) findings that firms with a plus or minus designation have a propensity to rely on less debt relative to equity, thereby supporting the CR-CS hypothesis. However, and conversely to Kisgen (2006), when firms are ranked within each micro rating into higher thirds, middle thirds, and lower thirds based on factors controlling for firm´s creditworthiness, the CR-CS hypothesis does not hold. Therefore, our empirical tests are only statistically significant when considering POM tests, with firms near a change in credit rating issuing approximately 0.3% less debt relative to equity as a percentage of total assets per year, than firms farther away from a change in rating. However, the significance of the POM coefficient is seemingly driven by its minus designation. Therefore, firms with an upgrade potential do not appear to significantly adjust their debt issuing patterns, while those that find themselves nearing a downgrade demonstrate increased propensity for such adjustments. As a robustness check, we included financial firms (SIC code 4000-4999), albeit their inclusion had virtually no impact on our results. Furthermore, we find that credit ratings have significant effects on capital structures, both during and prior to the financial crisis periods. During the financial crisis period, the impact of credit ratings on capital structure decisions was 0.20% points larger than during pre-crisis period. Finally, and conversely to Kisgen (2006)’s findings, we are unable to assess whether the CR-CS hypothesis can be utilized as a complement to such theories, as the pecking order and trade-off theories are violated within our sample.
Our overall results suggest that the potential costs of downgrades directly impact capital structure decisions. Kemper and Rao (2013)’s findings are not only similar to ours, the magnitude of the impact of credit ratings on capital structure decisions presented in their work also match our own. For instance, Kemper and Rao (2013) finds that firms near a ratings downgrade issue 0.3% less debt relative to equity. This is somehow contradictory to Kisgen (2006) who purports instead that the potential benefits of upgrades also have a direct impact on capital structure decisions, with the effects found in his results also being significantly larger in magnitude. His work suggests that firms near a change in credit rating issue approximately 1%
less net debt of equity as a percentage of total assets each year, than firms farther from a change in rating.
This thesis contributes towards the theoretical and empirical capital structure decision frameworks by examining whether the CR-CS hypothesis holds within a more recent sample period, while also comparing the impact of credit rating effects on capital structure decisions in the pre-financial crisis, financial crisis and post-financial crisis periods.
The remainder of this thesis is organized as follows. Section 2 provides an overview of the most relevant literature addressing the influence of credit ratings on capital structure decisions, along with that on credit ratings concerns in the context of existing capital structure theories. Section 3 describes our methodology, its benefits and its potential shortcomings and limitations. Section 4 provides further insight and information on the data, the construction, of necessary variables, and descriptive statistics we relied upon. Sections 5, 6, 7 and 8 focus on the empirical results of our analysis on the impact of credit ratings on capital structure decisions and the way credit ratings complement traditional capital structure theories. Section 9 contains our conclusion, finalized insights and suggestions for future work. Finally, sections 10 and 11 provide all references and appendices respectively, utilized throughout the course of this thesis
2. Literature Review
2.1. Influence of Credit Ratings for Capital Structure policy
The means through which credit ratings affect capital structure policy has gained relevance over the last few decades within the field of empirical corporate finance research. Since the 1990´s, several corporate finance textbooks have come to acknowledge that credit ratings may influence capital structure decisions (e.g., Damodaran, 1997; Brigham, Gapenski and Ehrhardt, 1999; Moyer et al, 2012), only recent a formal investigation was performed. Graham and Harvey (2001)’s survey was the first to provide concrete evidence purporting that managers should focus on their credit ratings when making capital structure choices, reporting that 57.1% of CFOs considered credit ratings an important metric when deciding on a firm´s capital structure. Their survey further determined that credit ratings were the second most significant factor overall, affecting debt policy. Servaes and Tufano (2006) on the other hand, concluded that for most CFOs, the current credit rating level is the most important factor (out of 20 distinct factors) in determining a company’s level of debt.
Kisgen (2006), motivated by Graham and Harvey (2001), performed a formal analysis on whether capital structure policy is directly affected by ratings concerns. His paper argues that “credit ratings are a material consideration in managers’ capital structure decisions due to the discrete costs (benefits) associated with different rating levels” (Kisgen, 2006, p.1037). Since the publication of this seminal work, Kisgen’s main theoretical proposal is well known and referred to in the existing literature as the Credit Rating- Capital Structure Hypothesis, or simply CR-CS. This hypothesis states that firms with an upgrade or a downgrade potential will, on average, select more equity relative to debt compared to firms not near a change in rating. This is done in the hopes of benefitting from a potential upgrade, or to avoid the additional costs of a potential downgrade.
The empirical tests required to evaluate the CR-CS hypothesis encompass both concern over Broad Ratings, using Plus or Minus tests (POM tests), and a concern over a potential change of any kind, using a Credit Score test. The plus and minus terms used in the POM tests serve to identify that the firm is on the edge of a rating change. Within the Credit Score tests, firms must be categorized for analysis. A credit value is assigned to each firm, separating them into high, middle and low thirds, with firms within the low and high third considered to be on the verge of a ratings change. The results, according to the CR-CS hypothesis, implies that both types of tests should confirm that firms on the verge of a rating change will be reluctant to issue debt when compared to firms that are in the middle of a broad rating.
The CR-CS hypothesis is distinct from financial distress theories. Firstly, financial distress arguments and debates go back to the beginnings of the 60´s, following the pioneer research of Beaver (1966), Altman (1968), and Altman et al (1977), and their demonstrations that financial variables are correlated with bankruptcy. The CR-CS hypothesis has only recent been introduced by Kisgen (2006). Secondly, CR-CS suggests that firms on the verge of a rating change will on average, issue less debt than their counterpart firms, while according to financial distress arguments, firm on the edge of a potential upgrade will tend to issue more debt since its credit quality is better. Moreover, CR-CS implies that credit ratings have an impact at all rating levels, whereas distress concerns are unlikely to be significant for firms with high ratings. Furthermore, according to Kisgen (2006), CR-CS entails discrete costs (benefits) whenever there is a change in rating, therefore suggesting a lack of continuity in the relationship between
a firm’s leverage and its value.However, financial distress arguments suggest no such lack of
In some cases, financial distress and CR-CS hypothesis possess some similarities, to the extent that Kisgen (2006) includes variables within his work to control for the financial condition of a firm, in order to capture a credit rating’s effect without contaminating the results with any potential financial distress effects. Conversely, Kemper and Rao (2013) question this distinction between the CR-CS hypothesis and financial distress concerns. They suggest instead that the propensity of B- rated firms to issue debt might be a simple reflection of their financial distress, and thus an indication of their inability to raise more debt. This in contrast to the suggestion that such a reduction in debt is a conscious choice.
Following on Kisgen (2006)’s footsteps, a large body of literature has looked into the relationship between credit ratings and a firm´s capital structure policy in the US (e.g., Frank and Goyal, 2009; Kisgen, 2009; Tang, 2009; Mittoo and Zhang, 2010; Byoun, 2011; Faulkender et al, 2012; Baghai, Servaes, and Tamayo, 2018), and more recently in Europe (e.g., Hung, Banerjee, and Meng, 2017; Wojewodzki, Poon and Shen, 2018).
Kisgen (2006)’s work constitutes a landmark in theoretical and empirical capital structure policy frameworks.
2.2. Credit Ratings in the Context of Capital Structure Theories
Kisgen (2006) also further developed the CR-CS hypothesis within the context of trade-off and pecking order theories. According to the author, the effects of ratings on capital structure can be seen to complement to existing capital structure theories. He purports that each credit rating level is associated with discrete costs and benefits. When such costs (benefits) are materialized, managers will be confronted by the trade-off between these costs (benefits) against more traditional costs and benefits implied by existing theories, and will subsequently try to balance between them. Moreover, his work suggests that managers will not always behave according to the existing capital structure theories, particularly when costs (benefits) imposed by credit ratings dominate those inherent to increased leverage. These results find confirmation in other empirical studies (e.g., Shivdasani and Zenner, 2005; Najjara and Elgammal, 2013) and surveys (Graham and Harvey 2001; Bancel and Mittoo, 2004; Servaes and Tufano, 2006). According to Wojewodzki, Poon and Shen (2018), such dominance of discrete costs imposed by credit ratings when compared to traditional costs, might explain why high-quality companies tend to be under-levered, while poor-quality firms are typically over-levered.
2.2.1 Trade-off Theory
The trade-off theory (Kraus and Litzenberger, 1973; Scott, 1977; Kim, 1978) states that the capital structure of a firm is chosen based on the idea of achieving an optimal level of debt. A firm´s optimal amount of leverage is reached by balancing the advantages of interest tax shields and other benefits of debt, against both direct and indirect costs of financial distress (Modigliani and Miller,1963), along with several agency costs (e.g., Jensen, 1986). According to the trade-off theory, a firm will return over time toward its optimum amount of leverage, despite possible natural or unexpected variance (see e.g., Fama and French, 2002). Conversely, in the presence of frictions, Strebulaev (2007) suggests that firms rarely adjust their capital structure. A firm´s choice of debt in a dynamic economy is thus likely to differ from the optimal level implicit in the trade-off theory. Strebulaev (2007) admits that traditional trade-off theory may fail to explain differences between firms within a statistical sample since actual and optimal leverage differ. Nevertheless, the theory finds its use with several firms and Kisgen (2006) addresses the importance of credit ratings in the context of trade-off theory.
According to the CR-CS hypothesis, each credit rating level is associated with discrete costs (benefits). Managers will ponder these CR-CS costs (benefits), whenever they are materialized, against the traditional costs and benefits inherent to trade-off theory, resulting in capital structure behavior that is typically different from that considered by the traditional trade-off theory. Kisgen (2006) distinguishes between two cases, one in which the trade-off theory factors outweigh credit rating considerations, and another where costs and benefits linked to credit ratings outweigh those of increased leverage. In this latter case, managers will not behave in a manner predicted by trade-off theory.
2.2.2 Pecking Order Theory
The pecking-order theory, developed by Myers and Majluf (1984), states that firms prefer not to issue equity due to asymmetric information availability between managers and investors. Firms will typically opt to fund projects with internal funds first, and debt second. Only when internal funds are no longer available and debt capacity has been reached, will a firm issue equity as a last resort.
CR-CS suggests that whenever there is an incremental change in leverage, firms will experience a discrete cost (benefit) due to a potential change in their credit rating level. As such, for a given level of debt and assuming both CR-CS and pecking order effects are materialized, a firm will
balance the costs of issuing equity against the discrete costs associated with a potential change in credit rating. The trade-off between these costs is typically stronger for firms that are near a change in rating, regardless of whether such a change would result in an upgrade or downgrade. Therefore, the pecking order theory may be violated in some of these cases, since firms that are near an upgrade may choose to issue equity rather than debt, for the purposes of obtaining the additional benefits that arise from an increase in rating level. Conversely, firms that are near a downgrade may avoid issuing debt to mitigate the additional costs that arise from a potential decline in their credit rating.
3. Methodology
The primary testable implication, developed initially by Kisgen (2006) as the CR-CS hypothesis, suggests that a firm close to a credit rating change will typically issue less debt comparative to equity to either avoid a downgrade, or to benefit from a potential upgrade. The methodology followed here is an adaptation of Kisgen (2006).
We examine the direct impact of rating concerns on capital structure decisions, through measures of regression on the debt net of equity issuance on dummy variables which capture a firm’s proximity to changes in its credit rating. Our empirical tests address two types of concern regarding changes in credit ratings: a rating change from one broad rating category to another, such as a firm going from BBB to A, and a rating change of any kind. Firms at the edge of a broad rating category are assigned a plus or minus designation, within the broad rating. The broad rating of BBB for instance, refers to BBB-, BBB and BBB+ firms, and of these only BBB- and BBB+ firms are considered to be at the edge of a broad rating level.
The tests addressing the broad rating concerns are designated as POM tests (Plus or Minus tests). These tests use either a combined dummy variable (POM), or one that is decomposed into plus and minus categories separately (plus, minus). The main challenge of POM tests is to obtain precision in reflecting a firm’s proximity to a change in rating as plus and minus designations might be too vague, thereby reducing the accuracy of tests applied to them. For instance, a strong BB- may not be near a downgrade and analogous, a weak BB+ may not be near an upgrade. In these cases, resulting coefficients are typically biased, and thus underestimate true and accurate effects.
Conversely, firms worried with credit rating effects at all ratings changes are ranked within each micro rating into a high third, middle third, and low third according to their respective
Altman´s Z-Score. The Altman´s Z-Score is the first model that allows one to predict defaults from five accounting ratios (Altman´s Z-Score is detailed in the credit score section) through a discriminant analysis. Each firm has a Z-Score value calculated and assigned to it, with firms in the low and high third of its correspondent micro rating considered to be near a change in rating. Tests addressing these micro rating challenges are designated as Credit Score tests. Such tests rely on either a combined dummy variable (HOL), or one that is decomposed into high and low categories separately (high, low). When considering the fact that the majority of a Credit Score is inherently noise, these tests may in some cases return a power reduction. In addition, other variables were included in the analysis with the aim of controlling for firm specific factors: leverage, profitability and size.
Furthermore, the empirical tests described above are adapted to assess both the validity of CR-CS hypothesis within the context of the trade-off and pecking order theories, thorough the application of Shyam-Sunder and Myers (1999) tests.
Nevertheless, numerous problems may arise when applying either tests. A complicating issue occurs when a firm’s credit rating changes during the year under study, as credit rating measures are defined at the beginning of each year. Moreover, when issuing debt and equity, material transaction costs rise, and subsequently capital structure changes can become sporadic and lumpy. On top of that, processes of capital structure transactions are highly time consuming, and consequently too slow for the typically swift decision time required. Such factors might lead to a bias estimation coefficient (generally an underestimation of the true effect). Another potential problem that could affect our empirical tests is related to the simultaneity between credit ratings and debt. Rating agencies assess firms’ creditworthiness by taking a firm´s leverage into account. The higher the company´s debt, the higher the probability of default, and when credit ratings are taken as proxies for default probability, the lower the credit rating. However, a higher rated firm, would possess a lower cost of debt financing, and thus in the future would usually have an incentive to increase leverage.
4. Data and Summary Statistics
Our sample comprises all U.S. firms with a Compustat credit rating. The Compustat credit rating measure used is the beginning of year Standard & Poor´s Long-Term Domestic Issuer Credit Rating. According to Standard and Poor´s (2001b, p.61), this metric is the firm´s
“corporate credit rating”, which is itself a “current opinion on an issuer´s overall capacity to pay its financial obligations”.
The main analysis is an adaptation of Kisgen (2006), we thus made a decision to update the time frame used, in order to validate his findings with contemporary up-to-date information. Hence, the sample period begins in 2001 and ends in 2017.
We excluded firms with missing data in the fields regularly required for our empirical tests (these includes credit ratings, total assets, debt, and equity). Furthermore, our empirical tests excluded both very large debt and equity offerings, and solely large debt offerings only (defined as greater than 10% of assets). For extreme levels of debt offering, practically any firm might expect a downgrade. When considering small-medium debt offerings however, a firm close to a downgrade might see a deterioration in its rating, whereas it would not see such a downgrade were it originally farther from a credit change. Moreover, large offerings are generally associated with acquisitions, changes in management and reorganizations. In such contexts it is less likely that credit rating frictions will be relevant. The inclusion of financial firms and utilities have been controversial for years throughout the literature. Some authors (e.g., Fama and French, 2002; Frank and Goyal, 2003; Baghai, Servaes, and Tamayo, 2014) exclude both financial and utility firms (SIC codes 4000-4999 and 6000-6999, respectively) while other, more recent ones, exclude only financial firms (e.g., Wojewodzki, Poon and Shen, 2018 and Almeida et al, 2017). Kisgen (2006), on the other hand, includes both types of firms, due to the fact that discrete costs associated with changes in rating levels are also likely to affect either kind of company. Following recent literature in this field, our sample excludes financial firms (SIC code 4000-4999), due to the significantly different nature of their liabilities. Our work nevertheless demonstrates robustness to the inclusion of both financial and utility firms. Below is presented the definition of the most common used variables in the empirical tests: Dit = book short-term debt plus book long-term debt for firm i at time t.
DDit = long-term debt issuance minus long-term debt reduction plus changes in current debt for
firm i from time t to t+1.
DLTDit = long-term debt issuance minus long-term debt reduction for firm i from time t to t+1.
DEit = sale of common and preferred stock minus purchases of common and preferred stock for
firm i from time t to t +1.
Ait = total assets for firm i at time t.
CRPlus = dummy variable (equal to 1) for firms that have a plus credit rating at the beginning of
time t (equal to 0, otherwise).
CRMinus = dummy variable (equal to 1) for firms that have a minus credit rating at the beginning
of time t (equal to 0, otherwise).
CRPOM = CRPlus + CRMinus = dummy variable (equal to 1) for firms that have a minus or a plus
credit rating at the beginning of time t (equal to 0, otherwise).
CRHigh = dummy variable (equal to 1) for firms that are in the top third of their micro rating,
regarding their credit score at the beginning of time t (equal to 0, otherwise).
CRLow = dummy variable (equal to 1) for firms that are in the bottom third of their micro rating,
regarding their credit score at the beginning of time t (equal to 0, otherwise).
CRHOL = CRHigh + CRLow = dummy variable (equal to 1) for firms that are in the top third or
bottom third of their micro rating, regarding their credit score at the beginning of time t (equal to 0, otherwise).
Kit = set of control variables: leverage Di,t-1/(Di,t-1 + Ei, t-1), profitability EBITDAi,t-1/ Ai,t-1, and
size ln(Salesi,t-1).
NetDIssit = ( DDit - DEit) / Ait.
Tables I and II illustrate summary statistics for our sample. Table I indicates the number of firm-years by credit rating while also presenting statistics for debt to total capitalization by rating. Table II shows the number of firms according to capital raising and reducing activity. Our sample is comprised of 14,037 firm-years.
The uniform distribution is mostly absent from our sample. Ranges vary from 57 AA+ firm-years to 1,819 BBB firm-firm-years. Nevertheless, 11 out of 17 rating categories comprise over 700 firm-years. The small sample of A and CCC+ or below rated firms can unfortunately lead to misleading coefficients when performing empirical tests by rating categories. As such we will undertake caution in inferring meaning onto the results for these groups.
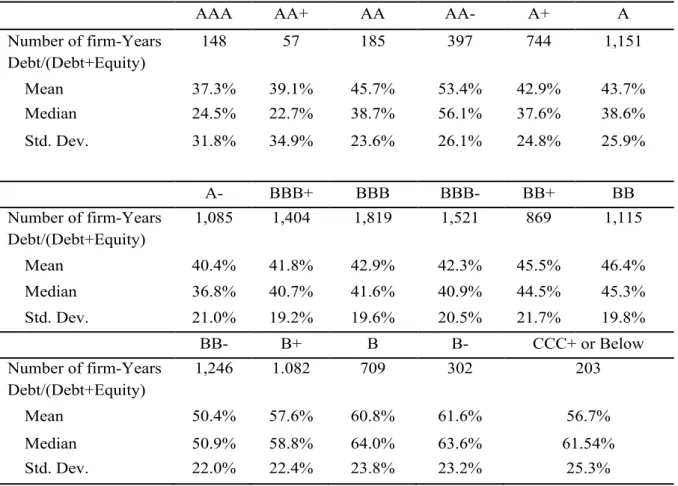
Table I: Leverage by rating- Summary statistics
Means, medians and standard deviations of Leverage, debt/ (debt + equity), by rating across firm-years and number of firms- years from 2001 to 2017. The sample comprises 14,037 firm-years and consists in all Compustat firms with a credit rating at the beginning of the year, excluding financial firms (SIC code 4000-4999), firm-years with missing data in the fields regularly required (these include credit ratings, total assets, debt and equity) and firms with leverage ratio greater than 1 or less than 0. Leverage is book short-term plus long-term debt divided by book short-term plus long-term debt plus book value of shareholder´s equity.
Credit ratings are considered a proxy of a company´s probability of default, as such the higher a firm´s credit rating the lower the probability of default. Therefore, the higher a firm´s leverage the higher the probability of default, and thus the lower the rating assigned to that specific firm, ceteris paribus. The implication of this mechanism can be viewed in Table I, with debt to total capitalization ratio, henceforth leverage ratio, behaving as expected in its relationship with credit ratings. A or above rated firms present a median leverage ratio ranging from 23% to 39% (excluding AA- rated firms whereas its median leverage ratio is 56.1%). BBB and BB rated firms experience a median leverage ratio ranging from 41% to 51%. B or below rated firms possess a leverage ratio comprehended between 59% to 64%. It appears that while a negative
AAA AA+ AA AA- A+ A
Number of firm-Years 148 57 185 397 744 1,151 Debt/(Debt+Equity) Mean 37.3% 39.1% 45.7% 53.4% 42.9% 43.7% Median 24.5% 22.7% 38.7% 56.1% 37.6% 38.6% Std. Dev. 31.8% 34.9% 23.6% 26.1% 24.8% 25.9% A- BBB+ BBB BBB- BB+ BB Number of firm-Years 1,085 1,404 1,819 1,521 869 1,115 Debt/(Debt+Equity) Mean 40.4% 41.8% 42.9% 42.3% 45.5% 46.4% Median 36.8% 40.7% 41.6% 40.9% 44.5% 45.3% Std. Dev. 21.0% 19.2% 19.6% 20.5% 21.7% 19.8% BB- B+ B B- CCC+ or Below Number of firm-Years 1,246 1.082 709 302 203 Debt/(Debt+Equity) Mean 50.4% 57.6% 60.8% 61.6% 56.7% Median 50.9% 58.8% 64.0% 63.6% 61.54% Std. Dev. 22.0% 22.4% 23.8% 23.2% 25.3%
relation between rating and leverage exists, the leverage ratio´s variance by rating category is relatively high, allowing for significant differences within each rating.
Table II: Capital Activity- Summary statistics
Number of firm-years by capital activity (debt only, equity only, both debt and equity, neither) from 2001 to 2017. The sample comprises 14,037 firm-years and consists in all Compustat firms with a credit rating at the beginning of the year, excluding financial firms (SIC code 4000-4999), firm-years with missing data in the fields regularly required (these include credit ratings, total assets, debt and equity). A debt or equity offering, or reduction is defined as the net amount raised or reduced equal to or greater than 1% of total assets for the calendar year.
Within capital offerings and defining an offering as a net amount greater than 1% of total assets, nearly 50% of firm-years issue only debt, with 8% raising only equity, leaving approximately 30% of the firm-years with no offerings and 14% issuing both debt and equity. When considering capital reductions, the pattern remains similar, with nearly 50% of firm-years reducing only debt levels, compared to around 12% reducing only equity levels. The simultaneous reduction of debt and equity levels is approximately 7% points higher compared to an offering of the same nature, leaving, around 20% of firm-years with no reductions. Table II illustrates that throughout a given year, the most common means for a firm to finance itself is by using only debt. For instance, in the specific case of an offering, 70% of the firm-years issue only debt. Conversely, only 11% of firm-firm-years are comprised of solely equity issuances. Equity offerings involve larger transaction costs (Lee et al, 1996), and thereby occur less often. On the other hand, according to Kisgen (2006)’s analysis, the truly less common form of financing is the simultaneous use of debt and equity. In order to undertake a robustness check on whether this change in pattern is related with different time frames used, rather than with the lack of accuracy of the variables, we applied Kisgen (2006)’s time frame to our model. In concurrence with the author, the stake of firms issuing both equity and debt was reduced by more than a half in our subsequent analysis. A potential phenomenon driving this change in
Offerings Reductions
# % # %
Debt Only 7,078 50.4% 6,697 47.7%
Equity Only 1,152 8.2% 1,662 11.8%
Debt and Equity 1,973 14.1% 3,049 21.7%
Neither 3,834 27.3% 2,629 18.8%
pattern might be the existence of dual holder firms within the same company, a characteristic which has gained increased relevance in the few recent decades (Yang, 2017).
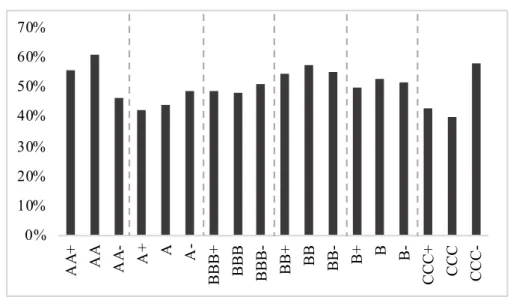
Figure 1: Debt and equity issuance by rating
Percentage of firm-years by rating that have a debt offering only (Panel A) or an equity offering only (Panel B), from 2001 to 2017. The sample consists in all Compustat firms with a credit rating at the beginning of the year, excluding financial firms (SIC code 4000-4999), firm-years with missing data in the fields regularly required and with a very large offering. A large offering is defined as an offering greater than 10% of total assets for the calendar year
Panel A. Debt issuance, 2001 to 2017
% of firm-years with debt issuance only
Panel B. Equity issuance, 2001 to 2017
% of firm-years with equity issuance only 0% 10% 20% 30% 40% 50% 60% 70% AA + AA AA -A+ A A-BBB+ BBB BBB- BB+ BB BB- B+ B B-CCC+ CCC CCC-0% 20% 40% 60% 80% 100% 120% AA + AA AA- A+ A A-BBB+ BBB BBB- BB+ BB BB- B+ B B-CCC+ CCC
CCC-Figure 1 shows debt and equity offerings by rating, while CCC-Figure 2 illustrates average NetDIss by rating.
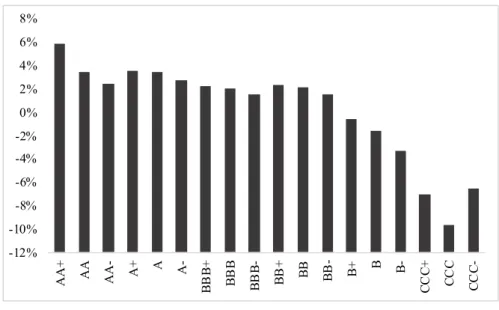
For debt offerings, firms within the broad ratings AA, BB and B, and near a change in rating, raised less debt than firms farther from a rating change. For equity offering, firms within the broad AA and BB ratings and with a downgrade potential, issued more equity relative to firms with no downgrade or upgrade potential. Moreover, firms within the broad rating B and with an upgrade potential, issued more equity than firms with no downgrade or upgrade potential. Within the same broad rating, firms with a downgrade potential have a lower average NetDIss when compared to firms with no downgrade or upgrade potential. This pattern is present in five of the six broad ratings categories analyzed in our work. Although the average NetDIss is nearly constant across all broad ratings, firms with a higher credit quality raised more debt and less equity than firms with a lower credit quality. Conversely to Kisgen (2006)’s findings which clearly support the CR-CS hypothesis, these results suggest that the evidence in favor of this hypothesis is quite weak. The stricter results shown in Kisgen (2006) (see Appendix I) are driven by a strong negative linear relationship between broad ratings and average NetDIss which appears in the author´s computed sample.
Figure 2: Average NetDIss by rating
This figure illustrates the mean value of NetDIss, (DDi,t - DEi,t) /Ai,t , by rating from 2001 to 2017 across firm-years. The sample consists in all Compustat firms with a credit rating at the beginning of the year, excluding financial firms (SIC code 4000-4999), firm-years with missing data in the fields regularly required and with a very large offering (greater than 10% of total assets).
Mean NetDIss (%) -12% -10% -8% -6% -4% -2% 0% 2% 4% 6% 8% AA+ AA AA- A+ A A-BB B+ BB B BB B-BB + BB BB- B+ B B-CC C+ CC C CC
C-Before a more comprehensive regression analysis, we performed a correlation analysis in order to understand the relationship between our variables and the expected response. The paragraphs below will provide insight only into the relationships between variables within the sample which excludes solely large debt offering and financial firms (SIC code 4000-4999).
By analyzing the correlation matrix provided in Appendix II, one can observe that the resulting correlation coefficients in absolute value vary in range between 0.0020 and 0.4391, verifying either a no linear or a weak association. The correlation coefficients between CRPom and
NetDIss, and CRMinus and NetDIss, are negative, thereby offering support to the validity of the
CR-CS hypothesis. The negative coefficient in these cases suggests that firms near a potential change in credit rating will typically issue less debt relative to equity, compared to firms not
near a change in rating. The correlation coefficient between CRPlus and NetDIss however, was
positive, directly contradicting the CR-CS hypothesis.
Appendix III presents the correlation matrix for the Credit Score Test. The resulting correlation coefficients in absolute value are kept in a tight range within the POM test results. In this
particular case however, the correlation coefficient between CRlow and NetDIss returned the
sole negative value in support of the CR-CS hypothesis. Although some dummy coefficients were negative, the existence of positive dummy coefficients imposes a less strict negative linear relationship between firms near a credit rating and average NetDIss, than firms not near a credit rating change, compared to what is expected given Kisgen (2006)’s findings. The correlation matrixes’ analysis presents the same pattern as the one illustrated in the figures above.
Therefore, our subsequent work was undertaken with the expectation that compared to Kisgen (2006)’s results, our empirical tests would present weakened evidence in favor of the CR-CS hypothesis.
5. Credit rating impact on capital structure decision-POM tests
This section addresses potential changes in Broad Rating through the use of POM tests. Under the CR-CS hypothesis, firms with a minus or plus designation will issue less debt relative to equity than firms without such a designation. In order to test the validity of this hypothesis, the following three regressions were considered:
NetDIssit= a + b0CRPOM + fKit + eit (1)
NetDIssit= a+ b3CRPOM +eit (3)
Equation 3 only tests the impact of the proximity of a firm to an upgrade or a downgrade in their credit rating on its net debt relative to net equity issuance, while Equation 1, on top of that, controls for firm specific factors. Equation 2 not only tests the impact of the proximity of a firm to an upgrade or a downgrade in their credit rating on its net debt relative to net equity issuance, but also determines whether firms are more sensitive to a potential upgrade or downgrade.
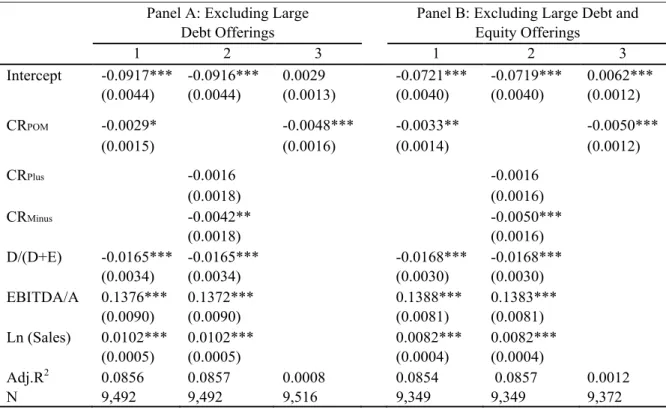
Table III: Influence of credit rating - POM Test
Coefficients and standard errors from pooled time-series cross-section regressions of debt net of equity as a percentage of total assets on credit rating dummy variables and on control variables. CRPOM is a credit rating dummy variable equal to 1 if a firm has at the beginning of the year either a plus or a minus credit rating and 0 otherwise. CRPlus and CRMinus are credit rating dummy variables equal to 1 if a firm has at the beginning of the year a plus or a minus credit rating, respectively and 0 otherwise. The control variables are: Leverage, D/(D+E), book value of debt divided by book value of debt plus book value of shareholder´s equity, Profitability, EBITDA/A, beginning of the year EBITDA divided by total assets and, Size, ln(Sales), the natural log of total sales. The sample covers firm-years from 2001 to 2017, and excludes financial firms (SIC code 4000-4999), firm-years with missing data in the fields regularly required and with a very large offering (greater than 10% of total assets). Errors are White´s consistent standard errors. ***, **, and * denote significance at 1%, 5%, and 10% levels, respectively.
Panel A: Excluding Large Debt Offerings
Panel B: Excluding Large Debt and Equity Offerings 1 2 3 1 2 3 Intercept -0.0917*** (0.0044) -0.0916*** (0.0044) 0.0029 (0.0013) -0.0721*** (0.0040) -0.0719*** (0.0040) 0.0062*** (0.0012) CRPOM -0.0029* (0.0015) -0.0048*** (0.0016) -0.0033** (0.0014) -0.0050*** (0.0012) CRPlus -0.0016 (0.0018) -0.0016 (0.0016) CRMinus -0.0042** (0.0018) -0.0050*** (0.0016) D/(D+E) -0.0165*** (0.0034) -0.0165*** (0.0034) -0.0168*** (0.0030) -0.0168*** (0.0030) EBITDA/A 0.1376*** (0.0090) 0.1372*** (0.0090) 0.1388*** (0.0081) 0.1383*** (0.0081) Ln (Sales) 0.0102*** (0.0005) 0.0102*** (0.0005) 0.0082*** (0.0004) 0.0082*** (0.0004) Adj.R2 0.0856 0.0857 0.0008 0.0854 0.0857 0.0012 N 9,492 9,492 9,516 9,349 9,349 9,372
According to the CR-CS hypothesis, firms near a rating change will have more conservative debt financing policies than firms farther from such a change. Hence, under the validity of the CR-CS hypothesis βi < 0, i = 0, 1, 2, 3. The null hypothesis here is that βi ≥ 0. Results of the
equations 1, 2 and 3 are provided in Table III, with panel A excluding large debt offerings and panel B excluding both large debt and equity offerings.
Analyzing the results obtained in regressions 1 and 3, the exclusion of both solely large debt offerings or large debt and equity offerings, provides support for the CR-CS hypothesis, with a significant rejection of the null hypothesis at the 10% level. As predicted by the CR-CS hypothesis, the coefficients for all our dummy variables are negative. The values for coefficients associated to CRPOM after controlling for firm-specific factors, β0, indicate that
firms with a plus or minus rating issue approximately 0.3% less debt annually relative to equity as a percentage of total assets than firms without plus or minus ratings. As a robustness check, we included sample financial firms (SIC code 4000-4999) in our sample, with the subsequent results remaining practically unchanged (see Appendix IV). Kisgen (2006)’s findings were of a larger magnitude, suggesting that firms on the edge of a broad rating change issue approximately 1% less debt relative to equity as a percentage of total assets than firms in the middle. This weaker evidence in support of the CR-CS model is likely to be driven by the less strict relationship between dummy variables and NetDIss present in our sample.
Equation 2 assesses whether a firm is more sensitive to a credit rating downgrade or upgrade.
In both panels A and B of Table III, the dummy variable coefficients, CRPlus and CRMinus are
negative, as predicted by the CR-CS hypothesis. The coefficients for our minus dummies are statistically different from zero at the 5% level. These results suggest that firms near a downgrade credit rating issue nearly 0.4% less debt net of equity as a percentage of assets than firms farther from a change in rating. In both panels however, the plus dummy variable is not different from zero at a statistically significant level. Therefore, suggesting that firms near a rating upgrade do not seem to adapt their debt issuing patterns.
A potential complication in the mechanism on the impact of credit ratings on capital structure in a year- by- year basis is illustrated in Table IV.
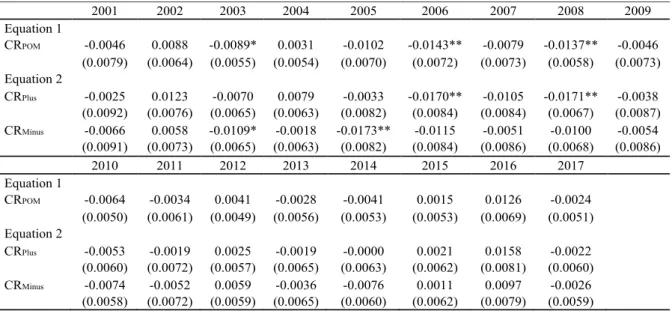
Table IV: Influence of credit rating- POM coefficients by year
Coefficients and standard errors from cross-section regressions of debt net of equity as a percentage of total assets on credit rating dummy variables and on control variables. CRPOM is a credit rating dummy variable equal to 1 if a firm has at the beginning of the year either a plus or a minus credit rating and 0 otherwise. CRPlus and CRMinus are credit rating dummy variables equal to 1 if a firm has at the beginning of the year a plus or a minus credit rating, respectively and 0 otherwise. Regression 1 includes the CRPOM dummy variable and control variables and Regression 2 includes the CRPlus and CRMinus credit rating dummy variables and control variables. The control variables (not shown) are: Leverage, D/(D+E), book value of debt divided by book value of debt plus book value of shareholder´s equity, Profitability, EBITDA/A, beginning of the year EBITDA divided by total assets and, Size, ln(Sales), the natural log of total sales. The sample covers firm-years from 2001 to 2017, and excludes financial firms (SIC code 4000-4999), firm-years with missing data in the fields regularly required and with a large debt offering (greater than 10% of total assets). Errors are White´s consistent standard errors. ***, **, and * denote significance at 1%, 5%, and 10% levels, respectively.
Our results show that for 12 out of the 17 individual years in our sample, firms possess a negative POM dummy coefficient as compliant with the CR-CS hypothesis. Only in 3 out of
those 17 individual years however, the CRPOM coefficient is statistically different from zero at
the 10% significance level. In 2003, firms near a credit rating change issue 0.9% less debt net of equity as a percentage of assets than firms farther from a rating change. In 2006 and 2008, firms near a credit ratings change issue approximately 1.4% less debt net of equity as a percentage of assets, than firms far from a rating change. Moreover, in 12 out of our 17 individual years, firms possess a negative coefficient for our plus dummy variable. However, for our 2006 and 2008 years, this coefficient is statistically significant at the 5% level. In both years, firms with an upgrade potential issue nearly 1.7% less debt relative to equity than firms
2001 2002 2003 2004 2005 2006 2007 2008 2009 Equation 1 CRPOM -0.0046 (0.0079) 0.0088 (0.0064) -0.0089* (0.0055) 0.0031 (0.0054) -0.0102 (0.0070) -0.0143** (0.0072) -0.0079 (0.0073) -0.0137** (0.0058) -0.0046 (0.0073) Equation 2 CRPlus -0.0025 (0.0092) 0.0123 (0.0076) -0.0070 (0.0065) 0.0079 (0.0063) -0.0033 (0.0082) -0.0170** (0.0084) -0.0105 (0.0084) -0.0171** (0.0067) -0.0038 (0.0087) CRMinus -0.0066 (0.0091) 0.0058 (0.0073) -0.0109* (0.0065) -0.0018 (0.0063) -0.0173** (0.0082) -0.0115 (0.0084) -0.0051 (0.0086) -0.0100 (0.0068) -0.0054 (0.0086) 2010 2011 2012 2013 2014 2015 2016 2017 Equation 1 CRPOM -0.0064 (0.0050) -0.0034 (0.0061) 0.0041 (0.0049) -0.0028 (0.0056) -0.0041 (0.0053) 0.0015 (0.0053) 0.0126 (0.0069) -0.0024 (0.0051) Equation 2 CRPlus -0.0053 (0.0060) -0.0019 (0.0072) 0.0025 (0.0057) -0.0019 (0.0065) -0.0000 (0.0063) 0.0021 (0.0062) 0.0158 (0.0081) -0.0022 (0.0060) CRMinus -0.0074 (0.0058) -0.0052 (0.0072) 0.0059 (0.0059) -0.0036 (0.0065) -0.0076 (0.0060) 0.0011 (0.0062) 0.0097 (0.0079) -0.0026 (0.0059)
in the middle. For 13 out of 17 individual years in our sample, firms return a negative coefficient for our minus dummy variable. For our 2003 and 2005 years however, this coefficient is statistically significant at the 10% level. In 2003 and 2005, firms near a credit rating downgrade issue around 1% and 1.7%, respectively, less debt net of equity than firms farther from a credit ratings change.
The lack of significance of coefficients in most of the yearly results hinders our ability to draw conclusions on an annual basis. Therefore, in order to gain insight on whether the impact of credit ratings on capital structure was related with events that arose during 2001 and 2017, we split the data into three distinct periods: pre-financial crisis, financial crisis, post- financial crisis.
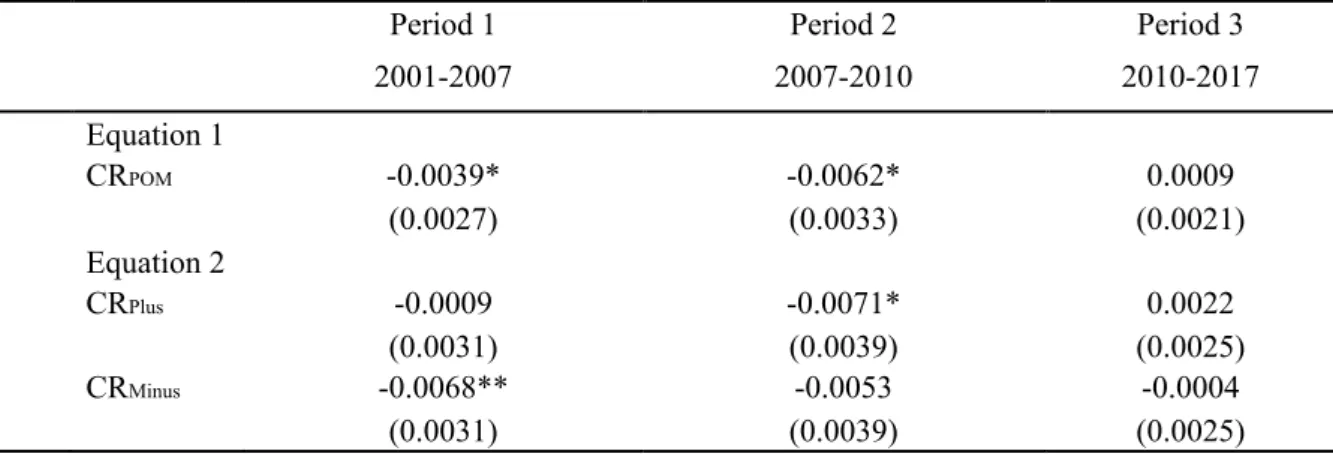
Table V: Influence of credit rating - POM coefficients by period
Coefficients and standard errors from cross-section regressions of debt net of equity as a percentage of total assets on credit rating dummy variables and on control variables. CRPOM is a credit rating dummy variable equal to 1 if a firm has at the beginning of the year either a plus or a minus credit rating and 0 otherwise. CRPlus and CRMinus are credit rating dummy variables equal to 1 if a firm has at the beginning of the year a plus or a minus credit rating, respectively and 0 otherwise. Regression 1 includes the CRPOM dummy variable and control variables and Regression 2 includes the CRPlus and CRMinus credit rating dummy variables and control variables. The control variables (not shown) are: Leverage, D/(D+E), book value of debt divided by book value of debt plus book value of shareholder´s equity, Profitability, EBITDA/A, beginning of the year EBITDA divided by total assets and, Size, ln(Sales), the natural log of total sales. The sample covers firm-years from 2001 to 2017, and excludes financial firms (SIC code 4000-4999), firm-years with missing data in the fields regularly required and with a large debt offering (greater than 10% of total assets). Errors are White´s consistent standard errors. ***, **, and * denote significance at 1%, 5%, and 10% levels, respectively.
Period 1 2001-2007 Period 2 2007-2010 Period 3 2010-2017 Equation 1 CRPOM -0.0039* (0.0027) -0.0062* (0.0033) 0.0009 (0.0021) Equation 2 CRPlus -0.0009 (0.0031) -0.0071* (0.0039) 0.0022 (0.0025) CRMinus -0.0068** (0.0031) -0.0053 (0.0039) -0.0004 (0.0025)
Results on the analysis of this revised structure are shown in Table V.
In both Period 1 and 2, our pre-crisis and crisis period respectively, firms possess a negative POM dummy coefficient in support of the CR-CS hypothesis. Moreover, in both periods this coefficient is statistically significant at the 10% level. In period 1, firms near a credit rating change issue approximately 0.4% less debt net of equity than firms far from a change in their credit rating. In period 2, firms on the edge of a broad rating issue nearly 0.6% less debt net of equity, than firms in the middle of a broad rating. A potential explanation for the broader impact of credit ratings on capital structure decision during periods of crisis might be related with a downward trend present in companies’ debt ratios levels during the financial crisis.
Equation 2 in Table V shows the POM dummy coefficient split into its two components: plus, and minus, dummy coefficients. For period 1 and 2, coefficients are negative for both our plus and minus dummy variables, thereby agreeing with the CR-CS hypothesis. However, in the pre-crisis period only CRMinus is statistically significant at a level of 5%, and in the crisis period
only CRPlus is statistically significant at the 10% level. In this case, and contrary to the pattern
verified when considered our entire time frame, firms near a rating upgrade seem to adapt their debt issuing patterns.
Regarding the post-crisis period, the CRPOM coefficient is positive and consequently non
statistically significant at all conventional levels. Moreover, the coefficient values for both our plus and minus dummy variables are also non statistically significant at all conventional levels. Therefore, period 3 does not support the CR-CS hypothesis. These particular coefficient values are likely to be biased, the post-crisis period saw an increase in the conservatism of rating agencies, which in itself affected several additional firm-specific factors which we are not accounting for in our empirical tests (e.g., Bagahi, Servaes and Tamayo, 2014). This phenomenon has been discussed in the literature, with Balakrishnan, Watts, and Zuo (2016) finding evidence that conservatism reduces “underinvestment in the presence of information frictions”. Furthermore, according to Francis, Hasan and Wu (2013), in post-crisis periods the increase in conservatism leads to more efficient governance mechanisms.
The empirical tests performed in this section controlled for the financial condition of a firm (by including leverage, profitability and size as control variables) in order to capture the effect of credit rating in a manner distinct from an analysis of financial distress levels. This is done to mitigate any possible concerns that our results might be driven by financial distress arguments.
effects and simple financial distress, particularly since both mechanisms would have opposite implications for such tests. For instance, firms near an upgrade are likely to be of a higher credit quality and so have lower probabilities of default.
6. Credit rating impact on capital structure decisions- Credit Score tests
This section examines potential changes of any kind in credit ratings using Altman´s Z-Score. To distinguish between firms near a credit rating change, we calculated the Altman´s Z-Score for each firm, and then preceded to rank firms within each micro rating into high thirds, middle thirds and low thirds. Within a micro rating, a firm in the high third is considered to be with an upgrade credit rating, while a firm in the low third is considered to be with a downgrade credit rating.
The Altman´s Z-Score was derived by Edward Altman in 1968, and was the first model able to predict defaults by relying on five separate accounting ratios through discriminant analysis:
X1= Working Capital / Total Assets
X2= Retained Earnings / Total Assets
X3= Earnings before interest and taxes / Total Assets
X4= Market Value of Equity / Total Liabilities
X5= Sales / Total Assets
The original Altman´s Z-Score model was designed for the analysis of publicly traded U.S manufacturing companies. We chose to use the original version of the model, illustrated in equation 4. For the purposes of our work however, we applied this model to both public manufacturing companies and non-manufacturing companies, following the same approach as other authors within the literature (e.g., Altman et al, 2017).
In order to distinguish between firms near credit ratings changes within our model choice we applied the following logic: the lower (higher) the Altman´s Z-Score of a firm, the higher (lower) the likelihood of the firm to default, and consequently, the higher (lower) the probability of a firm’s credit rating being downgraded.
Under the CR-CS hypothesis, firms that are placed in the high or low thirds of a given micro rating will issue less debt relative to equity than firms placed in the middle third. To test the validity of this hypothesis, the following equations were considered:
NetDIssit= a + b0CRHOL + fKit + eit (5)
NetDIssit=a + b1CRHigh+ b2CRLow + fKit + eit (6)
NetDIssit= a + b3CRHOL + eit (7)
These equations, similar to the ones presented in the section above, not only test the impact of a firm’s proximity to a micro rating change, on its net debt relative to net equity issuance, but also determine whether firms are more sensitive to changes in the low third versus the high third.
The accounting ratios used to calculate firms’ Z-Scores assessed several firm-specific fundamentals. The components of equation 4 are highly related to a firm’s financial conditions. One must bear in mind the fact that a firm with a relatively worse financial condition issues on average less debt compared to equity. Such a correlation is likely to generate a negative coefficient for our low third dummy variable and a positive coefficient for our high third dummy variable, regardless of other credit rating effects. To offset this, we merged both our high third and low third within a dummy variable (equation 5 and 7). Similarly to our POM tests, CR-CS predicts that bi<0, for i=0,1,2,3. An alternative approach for mitigating the effects
of a firm’s financial condition on our tests is the inclusion of control variables, as reported within our methodology section.
A potential multicollinearity problem is likely to arise however, as the control variables in our regression are similar to some of the variables used in Altman´s Z-Score calculation. Nevertheless, our control variables returned a linear relationship with both the dummy variables and the dependent variable. The variables considered within our Z-Score calculation appeared only indirectly in the regression, as they covered only our dummy variables (this being by design a non-linear relationship).
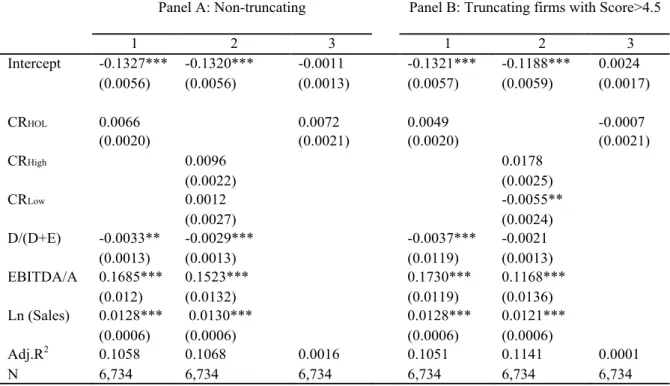
Table VI: Influence of credit rating - Credit Score Test
Coefficients and standard errors from pooled time-series cross-section regressions of debt net of equity as a percentage of total assets on both credit rating dummy variables and control variables. CRHOL is a credit rating dummy variable equal to 1 if the firm is placed in the high or low thirds of a given micro rating with respect to its Altman Z-Score and 0 otherwise. CRHigh and CRLow are credit rating dummy variables equal to 1 if the firm is placed in the high or low thirds of a given micro rating with respect to its Altman Z-Score, respectively and 0 otherwise. The control variables are: Leverage, D/(D+E), book value of debt divided by book value of debt plus book value of shareholder´s equity, Profitability, EBITDA/A, beginning of the year EBITDA divided by total assets and, Size, ln(Sales), the natural log of total sales. The sample covers firm-years from 2001 to 2017, and excludes financial firms (SIC code 4000-4999), firm-years with missing data in the fields regularly required and with a very large offering (greater than 10% of total assets). Errors are White´s consistent standard errors. ***, **, and * denote significance at 1%, 5%, and 10% levels, respectively.
An analysis of panel A of Table VI shows results contradicting the CR-CS hypothesis, with positive coefficients for all dummy variables and hence, a failure to rejection the null hypothesis at all conventional statistical levels. A potential explanation for these biased results, might rely on the fact that relatively high Z-Scores invariably impose distortions on the regression analyses.
Panel A: Non-truncating Panel B: Truncating firms with Score>4.5
1 2 3 1 2 3 Intercept -0.1327*** (0.0056) -0.1320*** (0.0056) -0.0011 (0.0013) -0.1321*** (0.0057) -0.1188*** (0.0059) 0.0024 (0.0017) CRHOL 0.0066 (0.0020) 0.0072 (0.0021) 0.0049 (0.0020) -0.0007 (0.0021) CRHigh 0.0096 (0.0022) 0.0178 (0.0025) CRLow 0.0012 (0.0027) -0.0055** (0.0024) D/(D+E) -0.0033** (0.0013) -0.0029*** (0.0013) -0.0037*** (0.0119) -0.0021 (0.0013) EBITDA/A 0.1685*** (0.012) 0.1523*** (0.0132) 0.1730*** (0.0119) 0.1168*** (0.0136) Ln (Sales) 0.0128*** (0.0006) 0.0130*** (0.0006) 0.0128*** (0.0006) 0.0121*** (0.0006) Adj.R2 0.1058 0.1068 0.0016 0.1051 0.1141 0.0001 N 6,734 6,734 6,734 6,734 6,734 6,734
Since the Altman´s Z- Score model has shown itself to not be wholly accurate when applied to our entire sample, we decided to impose a maximum ceiling for Altman´s Z-Score, capping the
maximum Z-Score attainable by a firm at a ceiling value of 4.5 1.
Through this truncation of the best credit quality companies, we obtained the results shown in panel B of Table VI. These results also do not support the CR-CS hypothesis when jointly analyzing the potential change in micro rating, with a non-rejection of the null at all conventional levels. This analysis underwent a robustness check with the inclusion of financial firms with the subsequent results remaining practically unchanged (see Appendix V). The lack of significance of the joint dummy coefficients might be explained by the effect of the strong correlation between accounting ratios in equation 4, and the financial conditions of the firm (as explained above). After the truncation of the best credit quality companies, the effect of this last factor in particular can be orders of magnitude larger than that of a credit ratings change. Equation 6 addresses whether firms are more sensitive to changes while in the low third versus
being in the high third. The coefficient for our dummy variable CRLow, is negative as predicted
by CR-CS hypothesis, being statistically different from zero at the 5% level. The results suggest that firms near a micro ratings downgrade issue, approximately, 0.6% less debt net of equity as a percentage of assets than firms that are in the middle third. The size of the coefficient is closer to the one obtained in our POM tests, although in this case the coefficient incorporates any potential ratings change. These results are nearly the same after including financial firms (SIC code 4000-4999) as a robustness check.
The size of offerings should be of a smaller scale than for our POM tests. Thereby when undertaking small offerings, firms in the high or low third could expect an upgrade or a downgrade, while firms in the middle third would not face an upgrade or downgrade, when dealing with an offering of that size. To address this issue, our empirical tests implemented an offering cutoff point of 5%, with subsequent results shown in Appendix VI. Our results were nearly unchanged by this cutoff adjustment.
To our knowledge, in the aftermath of Kisgen (2006), despite widespread adaptations of the author’s methodology, much of the literature takes only the POM tests regressions into account
1According to several literature, on average, appear to be a logical break at a Z-Score of 4.5, after that some distortion might
(e.g., Kemper and Rao, 2013). The non-consideration of credit scores in further analysis might be related with the lack of accuracy of such tests when applied to other samples and to updated time frames. Therefore, since credit score tests may appear to not fit within our sample, we will not consider them in the following sections.
7. Credit rating impact on capital structure decisions by broad rating
Table VII displays results for our entire sample by broad rating category in our POM tests, illustrating whether credit rating effects persist throughout broad rating categories. As discussed in the data and summary statistics section, the number of firm-years within a rating category varies considerably. An issue is likely to arise from this, since the power of these tests is reduced with decreased sample sizes.
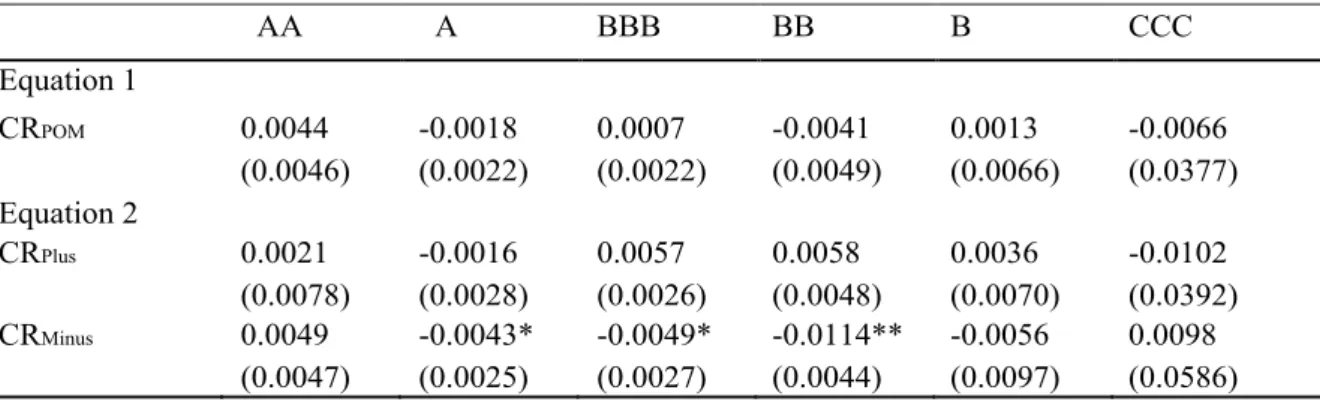
Table VII: Influence of Credit Rating by broad rating
Coefficients and standard errors from pooled time-series cross-section regressions by broad rating of debt net of equity as a percentage of total assets on credit rating dummy variables and on control variables. CRPOM is a credit rating dummy variable equal to 1 if a firm has at the beginning of the year either a plus or a minus credit rating and 0 otherwise. CRPlus and CRMinus are credit rating dummy variables equal to 1 if a firm has at the beginning of the year a plus or a minus credit rating, respectively and 0 otherwise. The control variables (not shown) are: Leverage, D/(D+E), book value of debt divided by book value of debt plus book value of shareholder´s equity, Profitability, EBITDA/A, beginning of the year EBITDA divided by total assets and, Size, ln(Sales), the natural log of total sales. The sample covers firm-years from 2001 to 2017, and excludes financial firms (SIC code 4000-4999), firm-years with missing data in the fields regularly required and with a large debt offering (greater than 10% of total assets). Errors are White´s consistent standard errors. ***, **, and * denote significance at 1%, 5%, and 10% levels, respectively.
AA A BBB BB B CCC Equation 1 CRPOM 0.0044 (0.0046) -0.0018 (0.0022) 0.0007 (0.0022) -0.0041 (0.0049) 0.0013 (0.0066) -0.0066 (0.0377) Equation 2 CRPlus 0.0021 (0.0078) -0.0016 (0.0028) 0.0057 (0.0026) 0.0058 (0.0048) 0.0036 (0.0070) -0.0102 (0.0392) CRMinus 0.0049 (0.0047) -0.0043* (0.0025) -0.0049* (0.0027) -0.0114** (0.0044) -0.0056 (0.0097) 0.0098 (0.0586)
The results for both tests when considering our entire sample, suggest that the coefficients of the combined dummies have the correct value in 3 out of 6 rating categories, but in none of our rating categories is this coefficient statistically significant at all conventional levels. However, in 4 out of 6 rating categories, the minus dummy variable coefficients are negative, with 3 of them being statistically significant at least at the 10% level, thereby supporting the CR-CS hypothesis. Regarding our plus dummy variable coefficients, 2 out of 6 return negative values, but none of them are statically significant at all conventional levels. Therefore, across some broad rating categories, the impact of the credit rating mechanism seems to persist, although only within firms near a rating downgrade.
Commercial paper is a flexible source of short-term financing and is typically used as an alternative to bank loans. The commercial paper market uses short-term credit quality ratings to assess a firm´s ability to enter the market. According to Standard & Poor´s terminology, the short-term credit quality rating is ranked within three rating categories: A1, A2, A3 or lower, which correspond to a long-term credit rating of A, BBB and B or lower. Our results within the A and BBB broad rating levels suggest the existence of concern within firms over commercial paper access. Firms at A and BBB rating levels might be worried with losing an A1 commercial paper rating or losing an A2 commercial paper rating, respectively. Moreover, our POM test results suggest that BB rated firms are particularly concerned with losing investment grade status.
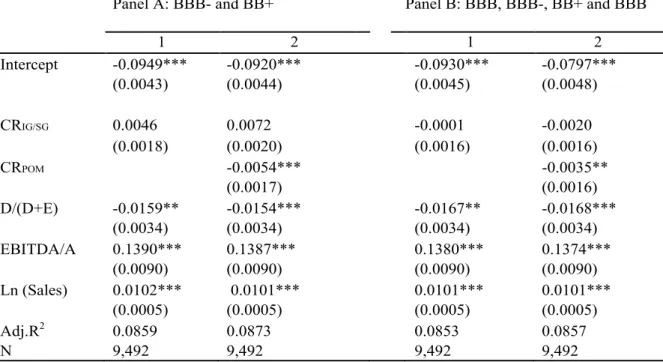
According to several authors within the literature, concern over credit ratings should be most prominent for firms with a rating between investment grade to speculative grade (i.e., from BBB- to BB+). The worry for such firms is that even since a small change in credit rating can have a significant impact on financing and investing decisions. Therefore, to explore this issue,
we created an additional variable, CRIG/SG, defined in two ways: firms with a rating of BBB−
or BB+, and firms with a rating of BBB, BBB−, BB+, or BB.
For the purpose of analyzing this new variable, the following empirical tests were considered: NetDIssit= a + dCRIG/SG + fKit + eit (8)
NetDIssit= a + dCRIG/SG + bCRPOM+fKit + eit (9)
The results for these empirical tests are illustrated in panels A and B of Table VIII. Regarding our first analysis, coefficients for our CRIG/SG variable are positive and non-statistically