Available online at http://www.anpad.org.br/bar
BAR, Curitiba, v. 7, n. 3, art. 2, pp. 242-259, July/Sept. 2010
Empirical
Evidence
of
Trade
Credit
Uses
of
Brazilian
Publicly
‐
Listed
Companies
Richard Saito *
E-mail address: [email protected]
Escola de Administração de Empresas de São Paulo/Fundação Getulio Vargas São Paulo, SP, Brazil.
Márcia Lima Bandeira
E-mail address: [email protected]
Escola de Administração de Empresas de São Paulo/Fundação Getulio Vargas São Paulo, SP, Brazil.
A
BSTRACTWhile trade credit may be used as a substitute for bank loans, we find empirical evidence that listed firms do use bank debt and trade credit as two complementary sources of financing in line with recent theoretical papers (e.g. Biais & Gollier, 1997) and evidence found in other empirical works (e.g. Alphonse, Ducret, & Séverin, 2006). By using a sample of 263 publicly-listed companies from 2006, our findings empirically support that trade credit may be used as (i) a sign of the firm’s quality, and (ii) a way of facilitating access to bank debt as trade credit seems to be a substitute for bank debt.
Key words: trade credit; public-listed companies; sources of financing; debt.
Received 19 December 2008; received in revised form 29 September 2009.
Copyright © 2010 Brazilian Administration Review. All rights reserved, including rights for
translation. Parts of this work may be quoted without prior knowledge on the condition that
the source is identified.
* Corresponding author: Richard Saito
I
NTRODUCTIONTrade credit is credit extended by suppliers to buyers, particularly during sales negotiations. Schwartz (1974) reports that trade credit is a complement to bank debt and capital market debt. It diminishes the efficiency of an aggregate monetary control, but on the other hand it mitigates discriminatory effects caused by a restrictive monetary policy, which tends to affect mainly small and medium sized enterprises [SME]. Because of this credit constraint, trade credit is viewed as a financial source of greater importance in countries where financial institutions and capital markets are not fully developed. It does not mean, however, that credit extension (or trade credit) is not relevant in countries with well-developed financial institutions such as the US or Germany. Trade credit is also viewed as an important source of financing for SME, since these firms normally have less access to sources of financing (and are also more affected by restrictive monetary policies). However, trade credit is much used by large firms. In our sample, for example, trade credit use represents around 8% of total debt, or 1/3 of firms’ financing (excluding corporate debt).
Despite the relevance of trade credit to Brazilian firms, there is no literature about this source of financing using Brazilian data. This study aims to fill this gap. Another innovation introduced by the present study is the focus on Brazilian-listed firms. It is reasonable to expect, therefore, that they have at least the same access to bank loans as private firms. In addition, public listed firms have access to public debt while private firms do not. Nevertheless, the complex procedures for accessing these other sources of financing, the proportionally larger financing needs of public firms and their need to diversify their financing suggest that trade credit may be just as (or almost as) useful for public, large firms as it is for smaller ones.
This study investigates trade credit from the viewpoint of both supplier and buyer based on a sample of Brazilian public firms’ data. We test the hypothesis of Alphonse, Ducret and Séverin (2006) who argue that credit rationed firms would use trade credit as complementary and alternative source of financing, while firms not facing credit rationing would use it only as an alternative source. The analysis of trade credit supply (the supplier viewpoint) focuses on firms’ access to credit.
The remainder of this paper is organized as follows. The literature review and hypotheses are presented in Second Section, data description in Third Section and the empirical results and the discussion of results in Fourth Section 4. Fifth Section concludes.
L
ITERATURE REVIEWFirms justify supplying trade credit on the basis that, in the absence of such financing, clients who do not have access to credit from financial institutions will not buy their products (Nadiri, 1969). Emery (1984) argues that trade credit provision boosts sales, representing a strategy to reduce firms’ inventories without price cuts. In this sense, this strategy would avoid costs associated with price reduction and preserve the firms’ discretionary pricing ability, as pointed out by Petersen and Rajan (1997). An instrument that facilitates this practice is the trade bill, which can be discounted in advance.
Another relevant aspect of trade credit is that it plays a role as a product guarantee when a supplier’s reputation is not well known, since clients can observe the quality of products before effectively paying for them (Smith, 1987; Long, Malitz, & Ravid, 1993).
temporary financial distress. In this sense, the author verified that large buyers faced with credit restraints may use their position (as a large costumer) to obtain trade credit from their suppliers.
Although these reasons justify the interest of non-financial firms in extending trade credit, it is still interesting to ask why they do so in the presence of financial firms specializing in selling credit. The answer is directly related to risk mitigation by non-financial firms in relation to banks. According to Petersen and Rajan (1997), the explanation is mostly related to informational advantages that suppliers experience, compared to banks, due to their business relationship with their clients (The suppliers’ visits to their clients may provide useful hints about inventories, employee redundancy, clients’ complaints and other problems that the buyer may eventually face).
First, suppliers may obtain information about their customers in the natural course of business, hence in a more timely and less costly way than banks. As Cook (1997) points out, this can be explained by the fact that suppliers visit their customers on a regular basis: in such visits, suppliers’ representatives (salespeople, commercial managers) get in touch with buyers’ employees and representatives of other firms, obtaining information about their relationship with the buyer. Another facilitating factor is that suppliers and buyers frequently belong to related industries, which makes it easy for the suppliers to have a good assessment of their customers’ market conditions. Moreover, Petersen and Rajan (1997) point out that the frequency and volume of purchases provide a relevant signal about the customer’s situation.
The business relationship also provides the suppliers with a monitoring advantage. Mian and Simth (1992) state that, faced with a likely default, the supplier can cut futures sales. This attitude can be harmful and even trigger the firm’s shutdown, especially if there are few alternative suppliers of that input. On the other hand, retaliation from financial institutions does not have as immediate an effect as the suppliers’ actions. Knowing that suppliers’ retaliation can lead to their shutdown, buyers have an extra incentive to avoid defaulting on trade credit. Furthermore, Buckart and Ellingsen (2004) argue that goods are more difficult to divert than cash, that is, suppliers can overcome moral hazard easier than banks.
The last advantage mentioned by Petersen and Rajan (1997) has to do with the nature of collateral assets. In case of default, lenders can seize the buyers’ inventory of goods: however, given the nature of their activities, such assets are less valuable to banks than to suppliers (see also Frank & Maksimovic, 2004 and Longhofer & Santos, 2003). All the advantages of non-financial firms are related to risk mitigation, since these firms can reduce informational asymmetry.
Finally, it is important to explain why firms use trade credit even if it is considered more costly than other forms of credit. There are two main reasons for the interest in its use: (1) trade credit is an alternative source of financing, especially when firms are credit constrained and (2) it is viewed as a sign of good quality of firms, making it easier for them to access bank loans.
Burkart and Ellingsen’s (2004) model predicts that, in the case of wealthy firms, the use of trade credit has a negative relationship to wealth. Moreover, according to these authors, the least wealthy firms use bank loans and trade credit up to their limit. Cunninghan (2004) empirically verifies Burkart and Ellingsen’s model (2004). By defining wealth as net income before tax, she found that, for medium-wealth firms, as the limit of bank credit increases, trade credit is less used; and for low-wealth firms, they are directly proportional, which suggests that this type of firm exhausts both limits of bank credit and trade credit.
Alphonse et al. (2006) verify this signaling role of trade credit, using data for the US and simultaneous equations (due to the endogeneity problem between bank debt and trade credit). They argue that firms with good relationships with banks would use trade credit only as a substitute source of financing (substitution hypothesis), while credit rationed firms would use it as both, a substitute and complementary source of financing, but at different times. These authors suggest that, credit constrained firms would first use trade credit as complementary source of financing (complementary hypothesis). Banks would consider this information and become more willing to lend to these firms (reputation hypothesis). Hence, these firms would later use trade credit and bank loans as substitute sources (substitution hypothesis).
H
YPOTHESES, D
ATA AND METHODOLOGYIn order to investigate trade credit from the point of view of both suppliers and customers, this study has been structured into two parts. The first aims to test hypotheses 1, 2 and 3 (described below), which are related to the trade credit use (viewpoint of the customer) and its relation to bank debt. These hypotheses were tested by Alphonse et al. (2006) for SME and are tested in this paper on publicly-listed companies. The second part is composed of hypothesis 4, which are related to trade credit offer (viewpoint of the supplier).
Hypothesis 1: Substitution Hypothesis. Trade credit is an optional source of financing to a bank
loan.
Biais and Gollier (1997) state that since trade credit carries information owned by the supplier about its customer, it should mitigate the informational asymmetry between firms and banks. Following this rationale, trade credit would play a signaling role, facilitating the firm’s access to bank credit for credit rationed firms. In this sense, trade credit would be an optional source of financing for both classes of firms (credit rationed and non-rationed).
In spite of the fact that public firms have their information disclosed (balance sheets, financial statements and other types of information), suppliers have access to superior information, even before they are published. Therefore, we expect that the use of trade credit can favor access to bank loans also for public firms and the accounts payable/total assets indicator is negatively related to total debt/total assets. In order to test trade credit usage, we use the model of Alphonse et al. (2006).
Hypothesis 2: Complementary Hypothesis. Trade credit is a complementary source of financing to
bank debt for credit rationed firms.
According to the informational and strategic advantages mentioned above, suppliers could be interested in granting credit even to credit rationed firms. In such a case, the firm’s accounts payable is expected to have a positive relationship with bank debt.
Hypothesis 3: Reputation Hypothesis. Credit rationed firms that use more trade credit should have
easier access to bank debt than those that use less trade credit.
According to the reputation hypothesis, it is expected that the coefficient of total debt is negative and significant for both classes of firms (first equation) and accounts payable is positive and significant only for firms in worse financial health (second equation).
Table 1:
Testing Hypotheses and Related Variables
Hypothesis Firm Classification Equation Variable Expected
Signal Authors
1 - Substitution Hypothesis
Better and worse
financial health 1
Total Debt/ Total
Assets -
Nielsen (1994) and Petersen and Rajan (1995)
2 - Complementary Hypothesis
Better and worse
financial health 2
Accounts Payable/
Total Assets +
Biais and Gollier (1997) and Buckart and Ellingsen (2004)
3 - Reputation Hypothesis
Better and worse
financial health 1
Total Debt/ Total
Assets -
Alphonse et al. (2006)
Worse financial health 2 Accounts Payable/
Total Assets +
Better financial health 2 Accounts Payable/
Total Assets NS*
* NS = Not significant.
Hypothesis 4: the greater the access to financial sources, the larger the trade credit granted, since the
firm is not an indispensable supplier.
Petersen and Rajan (1997), based on a sample of small firms’ data, found that the easier their access to credit, the more willing they were to supply trade credit. Public firms have access to both bank loans and public debt. Moreover, since they have to disclose their financial statements, they may be considered more transparent than private firms, which facilitates their access to bank loans. Hence, one can expect that public firms have more access to financing sources than small and medium sized enterprises. We therefore expect that aggregate indebtedness would not be as relevant to public firms’ increasing ability to grant credit than it is to private firms. Furthermore, larger firms tend to be less dependent on their suppliers than SME and for this reason they grant less concessions to their buyers (Wilner, 2000). Based on this rationale, we expect the level of total indebtedness not to be relevant, or even to have a negative relationship with trade credit supply in the case of public firms.
Diamond (1991) states that firms that issue corporate bonds have better reputations than others. Therefore, we expect that such a reputation would amplify the effect of non-dependence, hence bonds to total assets ratio is expected to be more significant than both other loans to total assets and total debt to total assets ratios.
Estimation Method and Variables Description
Analysis of Trade Credit Use
The first equation attempts to explain cross sectional variations in the use of trade credit by firms as measured by the accounts payable over total assets ratio. According to the substitution hypothesis, this ratio should be inversely related to the amount of debt defined as total loans divided by total assets.
This equation also includes variables related to the transaction use of trade credit. These variables are the ratio of current assets over total assets, a measurement of the sale growth and the (log of) total income. We expect these variables to be positively related to the amount of trade credit use. We also control for ownership, industry and age of the company.
i i i i i i i i i i i i iIND
IND
SIZE
OWNER
PROFIT
GROWTH
SQRAGE
AGE
INCOME
CURR
TDEBT
ACPAY
2
_
1
_
11 10 9 8 7 6 5 4 3 2 1 (1)used for testing hypotheses 1 and 3.
i i i i i i i i i iIND
IND
DSTOCK
DLEASE
DEPR
SIZE
OWNER
PROFIT
ACPAY
BANK
2
_
1
_
9 8 7 6 5 4 3 2 1 0 (2)used for testing hypotheses 2 and 3.
i i i i i i i iBONDS
LOANS
TDEBT
PROFIT
GR
GROWTH
AGE
SIZE
ACREC
7 6 5 4 3 2 10
_
(3)used for testing hypothesis 4.
In order to test hypotheses 1 to 4, we use a number of proxies to provide empirical evidence of trade credit either as a substitution of bank loan or a complement of bank loan. Tables 2 and 3 summarize the major control variables and their related hypotheses for trade credit use and supply respectively. The variables are described below.
Based on Alphonse et al. (2006), we use the ratio of accounts payable/total assets (ACPAY) as a proxy for trade credit. Access to other forms of credit are represented by bank debt to total assets (BANK) and total debt to total assets (TDEBT). According to the substitution hypothesis, the signal of the coefficient for the total debt to total assets ratio is expected to be negative. The complementary hypothesis predicts that the coefficient for the ratio accounts payable/total assets should be positive.
Ferris (1981) argues that uncertainty of delivery time augments inventory needs for goods and money, which contribute toward increasing the variation in payments and revenues. This rationale is related to the transaction theory of trade credit use. The variables related to this theory are current assets to total assets (CURR) and sales growth between 2005 and 2006 (GROWTH). These variables are directly related to working capital, as well as accounts payable; therefore, one can expect a positive relationship between them. The other variable used is the log of total income (INCOME).
A proxy for industry (IND_1 and IND_2) was included to control for nature of product effects, as pointed out by Giannetti, Burkart and Ellingsen (2007). Both variables are binary; IND_1 represents commodity firms whereas IND_2 represents service firms.
Like firms’ age, firms’ size can be a proxy for some firms’ characteristics, for example: more transparency (Berger & Udell, 1998), more creditworthiness (Petersen & Rajan, 1997) or fewer financing obstacles (Beck, Demirgüç-Kunt, Laeven, & Maksimovic, 2006). Therefore, it is difficult to predict the sign of log of total assets (SIZE), the variable used as a proxy for firm’s size, in both analyses. Depreciable assets (DEPR) play a collateral role. When firms’ creditworthiness can be observed by lenders, low-quality borrowers have to pledge collateral to obtain loans, while high-quality borrowers do not (Boot, Thakort, & Udell, 1991).
Two dummy variables are included as control variables due to the informational asymmetry (Akerlof, 1970) and consequent signaling effects (Spence, 1973) regarding firms’ quality/creditworthiness. DLEASE takes the value of 1 if the firm uses capital lease and zero otherwise, whereas DSTOCK assumes a value of 1 if the firm benefits from loans from stockholders and zero owtherwise.
The variable GROWTH, related to the transaction theory, is expected to have the same signal as in the first equation (positive), as a stronger growth would demand more working capital, implying an increase in funding needs. The ownership share of the principal owner (OWNER) was included as a proxy for differences in financing patterns (Holmes & Zimmer, 1994).
In order to investigate the reputation hypothesis, the sample was divided by their financial health, and the two equations analysed jointly. The relation of total debt (TDEBT) is expected to be negative for both classes of firms, while the relation between accounts payable (ACPAY) and bank debt would be positive and significant for credit constrained firms and non-significant for firms in good financial health. This corroborates the rationale that in a first stage of credit rationing, firms use trade credit to substitute bank loans; at a later stage, banks would become willing to grant credit to firms that have had access to trade credit.
Table 2:
Control Variables and Related Hypotheses of Trade Credit Use
Variables
Expected Signal (Equation 1)
Expected Signal (Equation 2)
Reference
CURR + Transaction Use (Schwartz, 1974)
INCOME + Transaction Use (Schwartz, 1974)
AGE + Firm Transparency (Berger & Udell, 1998); Pecking Order (Myers, 1984)
GROWTH + + Transaction Use (Schwartz, 1974)
PROFIT - Pecking Order (Myers, 1984)
OWNER + + Financing Patterns (Holmes & Zimmer, 1994)
SIZE - + Firm Transparency (Berger & Udell, 1998)
DEPR - Collateral Theory (Boot et al., 1991)
DLEASE + Asymmetric Information (Akerlof, 1970); Signaling (Spence, 1973)
Analysis of Trade Credit Supply
The analysis of trade credit supply is based on the model of Petersen and Rajan (1997), and some of the variables were redefined accordingly. We use the ratio accounts receivable/total assets (ACREC) as a proxy for trade credit supply. The log of book value of total assets was used to measure firm’s size (SIZE). The firms age (AGE) has the same definition (log of (1+firm age)). Petersen and Rajan (1997) assert that both size and age of firms indicates their creditworthiness, hence they would be positively related to trade credit supply.
The ratio of gross profit to sales (GR_PROFIT) indicates the incentive that a firm has to sell. Since trade credit is supposed to increase sales, we expect that the greater the gross profit, the greater the incentive the firm has to invest in actions that increase sales. For this reason, gross profit should have a positive relationship with accounts receivable. Sales growth (GROWTH) has the same definition as in the previous section and it should have a negative relationship with accounts receivable, since firms growth may affect working capital management and therefore cause a decline in firms’ ability to supply trade credit.
TOTAL DEBT is the ratio of total debt to total assets. BONDS is the volume of corporate bonds. LOANS is defined as the difference between total debt ratio and bonds ratio. As previously explained, larger firms are less dependent on their suppliers and thus they would grant fewer concessions to their buyers. Therefore, contrary to small enterprises, debt ratios are expected to be negative, or at least not significant in the case of public firms. We assume that a better reputation of firms that issue public debt intensifies this effect of non-dependence and for this reason bonds ratio coefficient should be more significant than the other debt ratios. Table 3 summarizes control variables and their expected signs and related hypotheses.
Table 3:
Control Variables and Related Hypotheses of Trade Credit Supply
Variables Expected Signal Reference
SIZE + Credit worthiness (Petersen & Rajan, 1997)
AGE + Credit worthiness (Petersen & Rajan, 1997)
GROWTH - Price Discrimination (Schwartz, 1974)
GR_PROFIT + Price Discrimination (Schwartz, 1974)
D
ATA AND SUMMARY STATISTICSThe sample consists of 263 nonfinancial public firms. The dataset includes annual information from 2006, as provided by Economática® and the website of the Securities and Exchange Commission of Brazil (Comissão de Valores Mobiliários [CVM]). The former was used to obtain financial data (from consolidated balance sheets and financial statements) and industry classification. The latter provided financing data, available in the ‘Notes to the Financial Statements’ and the foundation year of firms (used to calculate firm age).
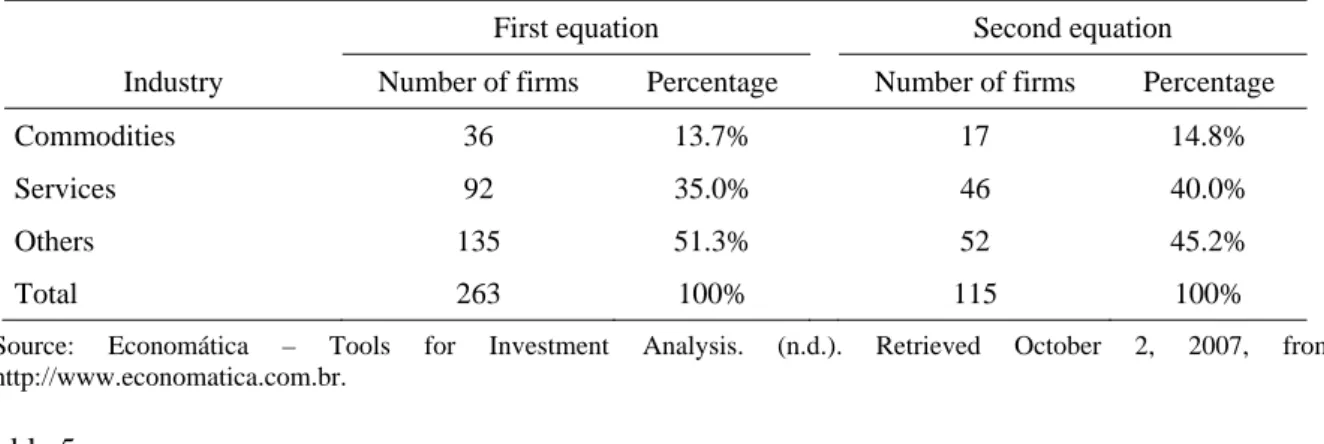
In order to control for the nature of the good effect, the firms in the sample were split according to a simple classification: commodities, services and others(1). Table 4 shows the distribution of firms in the sample according to the industry for the two equations.
Table 5 presents descriptive statistics. Panel A shows financial data of the sample used to analyze trade credit use, while Panel B shows the same data of the sample used to analyze trade credit offer. The differences in total sample between panel A and panel B are due to unavailable data of some variables in each analysis, thus eliminating firms from one sample and not from the other.
Table 4:
Distribution of Sample by Industry
This table reports the distribution of firms in the sample by Industry Classification: Commodities (mining, petroleum and gas, steel and metallurgy), services (commerce, building construction, transportation and services, electric energy, telecommunications, software and data) and others (machinery and industrial equipments, non-metallic minerals, wood and paper, chemicals, electric equipment, textiles, automobiles and motorcycles, food and beverage, other industries).
First equation Second equation
Industry Number of firms Percentage Number of firms Percentage
Commodities 36 13.7% 17 14.8%
Services 92 35.0% 46 40.0%
Others 135 51.3% 52 45.2%
Total 263 100% 115 100%
Source: Economática – Tools for Investment Analysis. (n.d.). Retrieved October 2, 2007, from http://www.economatica.com.br.
Table 5:
Descriptive Statistics
This table reports financial data, in US$ millions, of total sample and splitting the sample into firms that use less trade credit (below median) and firms that use more trade credit (above median) - panel A and splitting the sample into firms that grant less trade credit (below median) and firms that grant more trade credit (above median) - panel B .
Panel A: Trade Credit Use
TOTAL BELOW MEDIAN ABOVE MEDIAN
Mean Median
Standard
Deviation Mean Standard
Deviation Mean
Standard Deviation Total Assets 973.9 132.5 3,894.60 1,213.60 5,314.70 731.8 1,411.40
Equity 825.8 100.3 3,597.60 1,096.70 4,941.50 552.2 1,154.10
Net Revenue 1,523.80 202.3 5,710.60 1,562.50 7,640.10 1,484.80 2,629.80
EBIT 322.8 15.4 1,887.50 474 2,628.50 170.1 414.6
Net Income 166.7 8 974.5 254 1,354.50 78.5 222.7
Total Debt 601.7 52.7 2,299.10 760.3 3,105.10 441.5 942
Working Capital 284 50 875.4 322.5 1,043.10 245.2 667.8
Total Assets 895.7 169 3,290.60 1,303.80 4,520.90 484.8 942.1
Equity 734.6 123.4 3,037.00 1,098.90 4,184.20 367.7 821.6
Table 5 (continued)
Panel B: Trade Credit Offer
TOTAL BELOW MEDIAN ABOVE MEDIAN
Mean Median
Standard
Deviation Mean Standard
Deviation Mean
Standard Deviation Net Revenue 1,276.50 234.6 4,797.20 1,585.40 6,509.30 965.4 1,867.40
EBIT 277.5 17.8 1,579.40 431.3 2,202.50 122.7 300.5
Net Income 139.9 10.4 816.3 224.8 1,137.20 54.5 157.6
Total Debt 559.8 75.3 1,956.30 836.6 2,671.90 281 602.6
Working Capital 216.6 40.9 744.6 285.1 1,003.80 147.6 304.2 Source: Economática – Tools for Investment Analysis. (n.d.). Retrieved October 2, 2007, from http://www.economatica.com.br.
Both groups of firms that offer and use less trade credit present high standard deviation, which denotes high variation in data, i.e. they seem not to follow a specific pattern of size (total assets and equity), profitability (net revenue, earnings before interest and taxes (EBIT) and net income), debt and working capital. This evidence, along with the analysis of the mean, shows that both groups seem to present similar characteristics (standard deviations and means). In spite of the median values demonstrating some differences (for instance, total assets in panel B is almost twice the total assets in panel A), the median values compared to mean values demonstrate that these differences are not so ample as they seem to be. The comparison between mean and median also shows that half of the sample presents much lower financial-economic data than the other half. It turns out to be evident by the great difference between mean and median values. Both groups of firms that offer and use more trade credit portray lower standard deviations. Moreover, such groups had greater differences in relation to the means when compared to the other group from the same panel.
Accounts receivable and accounts payable are part of current assets and current liabilities respectively. This means that they are related to working capital. High variation in working capital, in its turn, may denote difficulties in its management and it is expected that firms with high variation in this measure offer less trade credit. On the other hand, one can expect firms with high variation in working capital to use more trade credit, even though that has not been confirmed by the descriptive analysis.
Firms that offer more trade credit have on average lower total assets, equity, EBIT, net income, total debt, and working capital, which is consistent with the rationale that smaller firms have to make greater efforts to sell.
E
MPIRICAL ANALYSISTable 6:
The Determinants of Accounts Payable and Bank Debt
The table reports coefficients estimated using the indirect least squares method, applied to a simultaneous equation system. The independent variables are: the ratio of accounts payable to total assets (ACPAY), total debt to total assets (TDEBT), current assets to total assets (CURR), log of total income (INCOME),firm’s age and square of firm’s age (AGE and SQR_AGE), sale’s growth between 2005 and 2006 (GROWTH), pre-tax earnings to total assets (PROFIT), ownership share of principal owner (OWNER), log of total assets (SIZE), depreciable assets to total assets (DEPR), the dummies proxies for the use of capital lease (LEASE), for the use of loans from stockholders (STOCK) and the dummies for industry control (IND_1 and IND_2).
Variables Expected Signal Accounts Payable/ Total assets Bank debt/ Total assets
Constant -0.012 1.341***
(-0.24) (5.59)
TDEBT - -0.018***
(-3.83)
CURR + 0.078***
(3.74)
Variables Expected Signal Accounts Payable/ Total assets Bank debt/ Total assets
INCOME + 0.015***
(3.46)
ACPAY + 1.866**
(2.45)
AGE + 0.037
(1.51)
SQR_AGE -0.005
(-1.19)
GROWTH + 0.003 -0.027
(0.79) (-0.36)
PROFIT - / + -0.166***
(-3.88)
OWNER + 0.024 -0.131
(1.50) (-1.48)
SIZE - / + -0.015** -0.030**
(-2.92) (-2.12)
DEPR + -0.106*
(-1.70)
DLEASE + -0.009
(-0.14)
DSTOCK + 0.039
(0.49)
IND_1 0.027** -0.030
(2.02) (-0.79)
IND_2 0.016 -0.226***
(1.58) (-3.99)
N. obs. 263 115
F-test 9.42*** 7.64***
R2 0.2127 0.3709
We verified the presence of heteroskedasticity, identified by the Breusch-Pagan / Cook-Weisberg test, at level 1% (chi-square was 62.19 for the first equation and 11.90 for the second equation, in trade credit use analysis; and in the analysis of trade credit offer, the chi-square was 144.58). For this reason, the procedure of White was employed in all regressions in order to obtain consistent standard errors.
The first equation seeks to investigate the substitution hypothesis. The ratio accounts payable to total assets presents a significantly negative relationship with the ratio of total debt to total assets, confirming the complementary hypothesis for public firms.
Almost all other results corroborate the findings of Alphonse et al. (2006). Among the variables related to trade credit transaction use, the log of total income and the current assets to total assets ratio are significantly and positively related to trade credit, while sales growth does not present a significant coefficient. Size, proxy for firm opacity (the larger the firm the less opaque it is) presents a negative relationship with trade credit, consistent with the statement that suppliers have superior information about their buyers.
Unlike the results obtained by Alphonse et al. (2006), whereas the ratio earnings before taxes to total assets was significant, the ownership share of principal owner was not. The first ratio captures some aspects of the retained earnings implied process. According to the pecking order theory, a firm prefers to use its own resources to fund its projects before searching for external financing. This implies that the more retained earnings a firm has, the lower its dependence on external funding. Therefore, the negative relationship between accounts payable and earnings before taxes corroborates the pecking order theory. The second ratio might be connected to different financing possibilities just between small firms that are growth and non-growth oriented. Public firms are owned by many shareholders, which can have other firms. Therefore the ownershipshare of the principal owner was not expected to be significant. Age also presents no significant coefficient.
The second equation intends to examine the complementary hypothesis, which states that bank debt and trade credit act as complementary financing sources. The significantly positive relationship between accounts payable (proxy for trade credit) and bank debt ratify the complementary hypothesis to public firms.
Unlike the studies using small firms’ data (for instance, Biais & Gollier, 1997; Alphonse et al. 2006), size was significantly negative when related to bank debt. One possible reason is that the need for financing is proportional to the firms’ size, and bank loans would not satisfy this large financing demand. Moreover, large firms can have access to cheaper financing sources. Therefore, the larger the firm, the lower the bank debt to total debt ratio. Another different result is the negative relationship between depreciable assets and bank debt. Depreciable assets are more likely to be financed by long term financing, which would be the case of other sources of financing, especially of corporate bonds. The dummies for leasing (if the firm uses lease capital) and stockholder loans (if the firm benefits from loans from stockholders) do not present significant coefficients.
On the whole, these findings for public firms confirm the study by Alphonse et al. (2006), except for some peculiarities of large firms. They ratify the substitution and complementary hypotheses to this type of firm.
Table 7:
The Determinants of Accounts Payable and Bank Debt – Reputation Hypothesis
The table reports coefficients estimated using the indirect least squares method, applied to two simultaneous equation system. The first panel (1) is the regression of firms with score lower than the median and the second (2) is the regression of firms with bankruptcy score above the median. The independent variables: the ratio of accounts payable to total assets (ACPAY), total debt to total assets (TDEBT), current assets to total assets (CURR), log of total income (INCOME),firm's age and square of firm's age (AGE and SQR_AGE), sales growth between 2005 and 2006 (GROWTH), pre-tax earnings to total assets (PROFIT), ownership share of principal owner (OWNER), log of total assets (SIZE), depreciable assets to total assets (DEPR), the dummies proxies for the use of capital lease (LEASE), for the use of loans from stockholders (STOCK) and the dummies for industry control (IND_1 and IND_2).
(1) (2)
Variable Accounts Payable/ Total assets
Bank debt/ Total assets
Accounts Payable/ Total assets
Bank debt/ Total assets
Constant 0.078 1.631*** -0.111 1.191***
(1.24) (4.70) (-1.17) (5.00)
TDEBT -0.021*** -0.068*
(-4.11) (-1.67)
Variable Accounts Payable/ Total assets
Bank debt/ Total assets
Accounts Payable/ Total assets
Bank debt/ Total assets
CURR 0.127*** 0.080**
(3.77) (2.08)
INCOME 0.006 0.030***
(1.21) (2.83)
ACPAY 2.224** 1.182
(2.14) (1.48)
AGE -0.006 0.047
(-0.18) (1.33)
SQR_AGE 0.001 -0.004
(0.10) (-0.67)
GROWTH -0.011 -0.031 0.002 -0.036
(-0.90) (-0.22) (0.37) (-0.40)
PROFIT -0.195*** -0.106
(-4.10) (-1.14)
OWNER 0.023 -0.216 0.049 -0.008
(1.35) (-1.59) (-1.36) (-0.10)
SIZE -0.008 -0.053*** -0.024** -0.028*
(-1.39) (-2.80) (-2.30) (-1.81)
DEPR -0.227** 0.126
(-2.57) (1.40)
DLEASE 0.036 -0.067
Table 7 (continued)
The table reports coefficients estimated using the indirect least squares method, applied to two simultaneous equation system. The first panel (1) is the regression of firms with score lower than the median and the second (2) is the regression of firms with bankruptcy score above the median. The independent variables: the ratio of accounts payable to total assets (ACPAY), total debt to total assets (TDEBT), current assets to total assets (CURR), log of total income (INCOME),firm's age and square of firm's age (AGE and SQR_AGE), sales growth between 2005 and 2006 (GROWTH), pre-tax earnings to total assets (PROFIT), ownership share of principal owner (OWNER), log of total assets (SIZE), depreciable assets to total assets (DEPR), the dummies proxies for the use of capital lease (LEASE), for the use of loans from stockholders (STOCK) and the dummies for industry control (IND_1 and IND_2).
(1) (2)
Variable Accounts Payable/ Total assets
Bank debt/ Total assets
Accounts Payable/ Total assets
Bank debt/ Total assets
(0.53) (-0.73)
DSTOCK 0.172* -0.344
(1.81) (-1.23)
IND_1 0.067*** -0.109 0.014 0.028
(3.08) (-1.21) (0.97) (0.66)
IND_2 0.017 -0.193* 0.030 -0.152**
(1.55) (-2.00) (1.50) (-2.02)
N. obs. 150 63 113 52
F-test 15.37*** 7.06*** 2.67*** 1.74*
R2 0.3627 0.3218 0.2274 0.2219
Note. ***, ** and * indicates the coefficient is significantly different from zero at the 1%, 5% and 10% level respectively.
According to the substitution hypothesis, the negative relationship between total debt and accounts payble is valid for both groups of firms. Therefore, the significant results for both classes of firms corroborate the substitution hypothesis and the findings of Alphonse et al. (2006).
According to Biais and Gollier (1997), trade credit is a result of credit rationing and a signal that facilitates access to bank debt. Based on this statement, Alphonse et al. (2006) affirm that trade credit does not play an important role when firms have a long banking relationship (reputation hypothesis) and therefore the complementary hypothesis should only be confirmed in case of firms with less access to bank loans. It implies that the accounts payable coefficient should only be significant for firms with worse financial health. Our results confirm the reputation hypothesis. Therefore, despite public firms being less opaque than SME, trade credit is supposed to make access to bank loans also for public firms facing credit constraints easier. This is explained by the fact that suppliers have access to important information about their customers before they become public. Another relevant result is the significance of the dummy proxy for stockholder loans use (Panel 1), i.e., stockholder loans also facilitate access to bank loans when firms are credit constrained.
Comparing Tables 6 and 7, we can verify that current assets are relevant for both classes of firms in obtaining trade credit. On the other hand, the significance of gross profit and size is explained by firms with greater financial health; although these factors have low sensitivity to accounts payable. Furthermore, the significance of profit is explained by firms with worse financial health. This is consistent with the findings of Evans (1998) and Wilner (2000), who say that dependent suppliers extend more credit when the buyer is in financial distress.
act as a complementary or substitute source of financing, as well as a good sign of a firm’s quality, facilitating the firm’s access to financing.
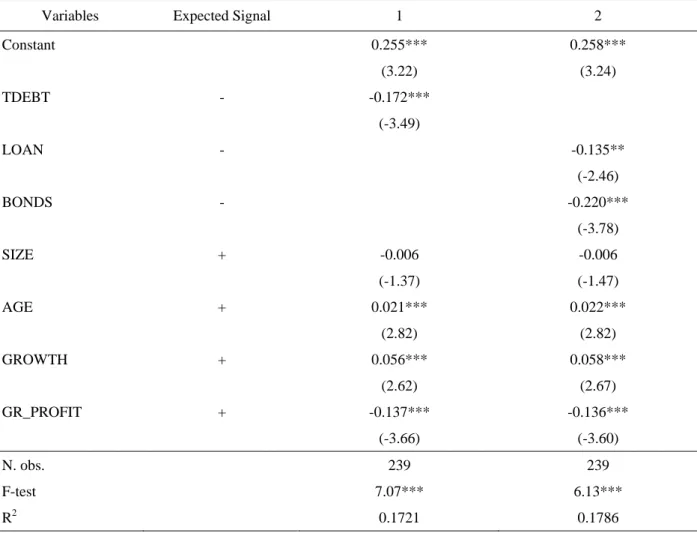
Table 8 shows the OLS regression results. Its objective was to investigate the access to credit and trade credit offer and, additionally, provide some evidence concerning the behavior of excelent reputation firms in granting credit extension to their customers.
Table 8:
The Determinants of Bank Debt and Corporate Bonds on Accounts Receivable
The table reports coefficients estimated using OLS method. The independent variables are: log of total assets (SIZE), firm's age (AGE), sale's growth between 2005 and 2006 (GROWTH),gross profit to sales (GR_PROFIT), total debt to total assets (TDEBT), total debt ratio minus corporate bonds ratio (LOAN) and volume of corporate bonds to total assets ratio (BONDS).
Variables Expected Signal 1 2
Constant 0.255*** 0.258***
(3.22) (3.24)
TDEBT - -0.172***
(-3.49)
LOAN - -0.135**
(-2.46)
BONDS - -0.220***
(-3.78)
SIZE + -0.006 -0.006
(-1.37) (-1.47)
AGE + 0.021*** 0.022***
(2.82) (2.82)
GROWTH + 0.056*** 0.058***
(2.62) (2.67)
GR_PROFIT + -0.137*** -0.136***
(-3.66) (-3.60)
N. obs. 239 239
F-test 7.07*** 6.13***
R2 0.1721 0.1786
Note. ***, ** and * indicate the coefficient is significantly different from zero at the 1%, 5% and 10% level respectively.
on their customers. For this reason, when total debt is divided into corporate bonds and other loans, the former have a negative relationship with stronger and significant trade credit coefficient.
C
ONCLUDING REMARKSThis paper investigates the use of trade credit by either financing their clients as well as supplier financing by Brazilian public firms. The rationale presented by Alphonse et al. (2006) provides the basis for the analysis of trade credit usage; the empirical tests of their hypothesis using Brazilian public firms’ data confirm the hypotheses of substitution and complementariness, that is, trade credit represents both a substitute (for all firms classes) and complementary (for credit rationed firms) source of financing in relation to bank loans, increasing the possibilities of financing for large firms. After spliting the sample into firms with poorer and better financial health, the substitution hypothesis was verified for both classes of firms, while the complementary hypothesis was ratified only for less creditworthy firms. The results provide empirical evidence to support the reputation hypothesis, i.e., trade credit seems to signal a firm’s good quality, facilitating access to bank loans. Despite public firms being more transparent than small (and private) firms, suppliers have access to relevant information about their buyers even before they become public. Therefore, trade credit can also facilitate access to credit for public firms.
Additionally, we provide empirical evidence about trade credit supply. Our results reveal that, in the case of public firms, an increase in indebtedness leads the firm to supply less trade credit to its clients. One possible explanation is that, unlike small firms, public firms are usually less dependent on their suppliers, therefore, they make fewer concessions to their clients (Frank & Maksimovic, 2004). Another possible explanation is that their clients may have access to sources of financing other than trade credit. When the debt is split into corporate bonds and other loans, this result is more significant for corporate bonds, which indicates that a firm’s good reputation intensifies the effect of low dependence on buyers. This type of loan is related to a firm’s reputation which, linked to less dependence of large firms, may be related to an increase in the firm’s market power, and for this reason these firms would make fewer concessions to their customers than the others.
The main contribution of this paper is the verification that of trade credit use and its relevance for large firms in Brazil, witnessed in the sample of publicly-listed companies, i.e., not only SME, but large Brazilian firms have the disadvantage of a lack of bank loans. We suggest, for future reseach, the use of a sample of SME and large firms in order to compare the use of trade credit between these types of firms.
A
CKNOWLEDGEMENTSRichard Saito wishes to acknowledge the financial support of the CNPq / PRONEX / FAPERJ / GV Pesquisa.
N
OTE1
Although simpler than the classification used by Giannetti et al. (2007), this categorization accounts for the main distinctions between firms; there was no single dominant category within the “others” group, which suggests that an additional group would not be necessary.
R
EFERENCESAkerlof, G. A. (1970). The market for "lemons": quality uncertainty and the market mechanism. The
Quarterly Journal of Economics , 84(3), 488-500.
Alphonse, P., Ducret, J., & Séverin, E. (2006, February). When trade credit facilitates access to bank finance: evidence from US small business data. [Working Paper]. Université de Nancy,
University of Valenciennes and University of Lille.
Beck, T., Demirgüç-Kunt, A., Laeven, L., & Maksimovic, V. (2006). The Determinants of Financing Obstacles. Journal of International Money and Finance , 25(6), 932-952.
Berger, A. N., & Udell, G. F. (1998). The economics of small business finance: the role of private equity and debt markets in the financial growth cycle. Journal of Banking and Finance , 22(6-8), 613-673.
Biais, B., & Gollier, C. (1997). Trade Credit and Credit Rationing. The Review of Financial Studies,
10(4), 903-937.
Boot, A., Thakor, A., & Udell, G. F. (1991). Secured Lending and default risk: equilibrium analysis, policy implications and empirical results. Economic Journa , 101(406), 458-472.
Burkart, M., & Ellingsen, T. (2004). In-kind finance: a theory of trade credit. The American Economic
Review, 94(3), 569-590.
Cook, L. D. (1997). Trade credit and bank finance financing small firms in Russia. Journal of
Business Venturing, 14(5/6), 493-518.
Cunninghan, R. (2004). Trade credit and credit rationing in canadian firms [Working paper s 04-49],
Bank of Canada, Ottawa, ON, Canada.
Diamond, D. W. (1991). Monitoring and reputation: the choice between bank loans and directly placed debt. The Journal of Political Economy, 99(4), 689-721.
Economática – Tools for Investment Analysis (n.d.). Retrieved October 2, 2007, from http://www.economatica.com.br
Emery, G. W. (1984). A pure financial explanation for trade credit. The Journal of Financial and
Quantitative analysis , 19(3), 271-285.
Evans, J. D. (1998). Are lending relationships valuable to equity holders in chapter 11 bankruptcy? Ph.D. Dissertation, Georgia State University, Atwems, Georgia, USA.
Ferris, S. J. (1981). A transactions theory of trade credit use. The Quaterly Journal of Economics,
96(2), 243-270.
Frank, M. Z., & Maksimovic, V. (2004). Trade credit, collateral, and adverse selection [Mimeo],
College Park, Baltimore, USA.
Giannetti, M., Burkart, M., & Ellingsen, T. (2007). What you sell is what you lend? Explaning trade credit contracts [Working paper nº 71/2005]. Social Science Research Network. Retrieved September 7, 2007, from http://papers.ssrn.com/sol3/papers.cfm?abstract_id=930390
Long, M. S., Malitz, I. B., & Ravid, S. A. (1993). Trade credit, quality guarantees, and product marketability. Financial Management , 22(4), 117-127.
Longhofer, S., & Santos, J. (2003). The paradox of priority. Financial Mangement, 32(1), 69-81.
Mian, S. L., & Simth, C. W., Jr. (1992). Accounts receivable management policy: theory and evidence. The Journal of Finance, 47(1), 169-200.
Myers, S. (1984). The capital structure puzzle. Journal of Finance, 39(3), 575-592.
Nadiri, M. I. (1969). The determinants of trade credit in the U.S. total manufacturing sector.
Econometrica, 37(3), 408-423.
Petersen, M., & Rajan, R. G. (1995). The effect of credit market competition on lending relationships.
The Quaterly Journal of Economics, 110(2), 407-443.
Petersen, M. A., & Rajan, R. G. (1997). Trade credit: theories and evidence. The Review of Financial
Studies, 10(3), 661-691.
Sanvicente, A. Z., & Minardi, A. M. A. F. (1998). Identificação de indicadores contábeis significativos para previsão de concordata de empresas [Working paper nº FLWP–03-1998]. Instituto
Brasileiro de Mercado de Capitais, São Paulo, SP, Brazil.
Schwartz, R. A. (1974). An economic model of trade credit. The Journal of Financial and
Quantitative Analysis, 9(4), 643-657.
Smith, J. K. (1987). Trade credit and informational asymetry. The Journal of Finance, 42(4), 863-872.
Spence, M. (1973). Job market signaling. The Quaterly Journal of Economics, 87(3), 355-374.
Vince, W. (2000). Two-stage least-squares regression. UCLA: academic technology services, statistical consulting group. Retrieved March 28, 2008, from http://www.stata.com/support/faqs/stat/ivreg.html
Wilner, B. S. (2000). The exploitation of relationships in financial distress: the case of trade credit.