Tatiana Barros Reis
Cereija
Tatiana Barros Reis
Cereija
Caracterização da inibição da tripsina pela boofilina
Characterization of trypsin inhibition by boophilin
Dissertação apresentada à Universidade de Aveiro para cumprimento dos requisitos necessários à obtenção do grau de Mestre em Biologia Molecular e Celular, realizada sob a orientação científica do Doutor Pedro José Barbosa Pereira, Professor auxiliar convidado do Departamento de Biologia da Universidade de Aveiro.
Apoio financeiro da FCT e do FSE no âmbito do III Quadro Comunitário de Apoio.
o júri
presidente Professora Doutora Adelaide Almeida
Professora Auxiliar do Departamento de Biologia da Universidade de Aveiro
Professor Doutor Pedro José Barbosa Pereira
Professor auxiliar convidado do Departamento de Biologia da Universidade de Aveiro Investigador principal no Instituto de Biologia Molecular e Celular, Porto
Doutora Isaura Simões
Investigadora auxiliar no Centro de Neurociências e Biologia Molecular da Universidade de Coimbra
palavras-chave Boofilina, trombina, tripsina, Kunitz, inibidor, cascata de coagulação, anticoagulante, trombose.
resumo No decurso da evolução, enquanto os vertebrados desenvolviam um complexo sistema para prevenir as perdas de sangue, os hematófagos criavam mecanismos anticoagulantes capazes de contra-atacar a reposta hemostática do hospedeiro, por forma a facilitar a extração, o armazenamento e a digestão do sangue. Muitos destes mecanismos assentam na inibição específica da trombina, proteína que tem um papel central na hemostasia. Apesar do elevado número de inibidores naturais de trombina, apenas uma pequena parte foi caracterizada bioquimicamente e, dentro desta, só alguns inibidores foram estudados de um ponto de vista estrutural. De todos aqueles com estrutura conhecida, a boofilina é o único que possui dois domínios canónicos do tipo Kunitz. No entanto, apesar de possuir domínios canónicos, a boofilina inibe a trombina através de um mecanismo não-canónico, no qual o seu N-terminal é inserido no centro catalítico da trombina enquanto que o domínio C-terminal interage com o exosite I da proteinase. Além disso, ao contrário de todos os outros inibidores caracterizados, a boofilina, em complexo com a trombina, é capaz de interagir com uma proteinase serínica adicional do tipo tripsina. Esta segunda interação envolve unicamente o domínio N-terminal, presumivelmente através do loop reactivo. In vivo, é possível que para além de inibir a trombina, a boofilina seja também capaz de inibir outra proteinase serínica da cascata de coagulação como o fXa, resultando não só na inibição da trombina mas também na diminuição da sua produção. Este aspecto faz da boofilina um bom modelo para a desenvolvimento de novos anticoagulantes terapêuticos. Pretende-se, por isso, clarificar este segundo mecanismo de inibição através do estudo da interação entre a boofilina e a tripsina. A boofilina (D1D2) e o seu domínio N-terminal isolado (D1) foram expressos em Pichia pastoris. Ambas as proteínas foram purificadas por cromatografia de afinidade numa coluna de tripsina seguida, no caso da D1D2, por cromatografia de troca iónica. Uma vez purificadas, a constante de inibição de cada uma das proteínas foi determinada e a D1 foi cristalizada por difusão vapor. Os cristais obtidos eram ortorrômbicos (grupo espacial P212121), tinham uma percentagem
invulgarmente baixa de solvente (23%) e difrataram com uma resolução mínima de 1.80 Ǻ. A estrutura cristalográfica da D1 releva uma conformação similar à observada no complexo trombina-boofilina. O complexo tripsina-D1 foi também preparado in vitro e a sua cristalização está em curso.
keywords Boophilin, thrombin, trypsin, Kunitz, inhibitor, coagulation cascade, anticoagulant, thrombosis.
abstract During evolution, while vertebrates developed a complex system to prevent blood loss, blood-feeding animals evolved anticoagulant mechanisms to counteract the haemostatic response of their hosts in order to facilitate blood drawing, storage and digestion. Many of these anticoagulant mechanisms rely on the specific inhibition of thrombin, a central enzyme in haemostasis. Although a number of a natural thrombin inhibitors from haematophagous animals have been described only a few have been fully characterised biochemically, and even fewer have been studied from a structural viewpoint. From those structurally characterised to date, only boophilin displays two tandem canonical Kunitz fold domains. However, despite its regular BPTI-like domains, boophilin inhibits thrombin by a non-canonical mechanism, in which its N-terminus inserts into the active site cleft of thrombin, while the C-terminus Kunitz domain interacts with the exosite I of the proteinase. Moreover, in contrast to all the other natural thrombin inhibitors characterised, when in complex with thrombin boophilin retains the capability to interact with an additional (non-thrombin) trypsin-like serine proteinase molecule. In this second interaction only the N-terminal domain is involved, presumably through its conserved reactive-loop. In vivo, it is likely that besides inhibiting thrombin, boophilin can target another serine proteinase of the coagulation cascade, such as fXa. This would result not only in thrombin inhibition, but also in the impairment of thrombin generation, making boophilin a good model for the design of new therapeutic anticoagulants. For this reason, this work aimed at clarifying this second inhibition mechanism by studying the trypsin-boophilin complex. Boophilin (D1D2) and its N-terminal domain (D1) were expressed in Pichia pastoris. Both proteins were purified by immobilized-trypsin affinity chromatography followed, in the case of D1D2, by ion-exchange chromatography. Once purified, the inhibition constant of both proteins was determined and D1 was crystallized by vapour diffusion. The crystals obtained were orthorhombic (space group P212121), had an unusually low solvent
content of 23% and diffracted X-rays to beyond 1.80 Ǻ. The crystallographic structure of the first domain of boophilin reveals a conformation of the reactive site loop similar to that observed in the thrombin-boophilin complex. The D1-trypsin complex was also prepared in vitro and its crystallization is underway.
6 Contents Abbreviations ... 8 1. Introduction ... 14 1.1. Haemostasis ... 16 1.2. Coagulation cascade ... 16 1.2.1. Clotting regulation ... 18
1.2.2. Clot stabilization and lysis ... 20
1.3. Thrombosis ... 21
1.3.1. Pathogenesis ... 22
1.3.2. Pathology ... 23
1.4. Searching for therapeutic anticoagulants ... 24
1.4.1. The best targets ... 25
1.4.1.1. Thrombin ... 26
1.4.1.2. Factor Xa ... 27
1.5. Coagulation inhibitors from haematophagous animals ... 28
1.5.1. Thrombin inhibitors ... 28
1.5.1.1. Boophilin ... 32
1.5.1.1.1. Inhibitor of clot formation ... 33
1.5.1.1.2. Target for Rhipicephalus microplus control ... 35
1.6. Objectives ... 36
2. Materials and Methods ... 38
2.1. Materials ... 40
2.2. Preparation of Escherichia coli DH5α competent cells ... 41
2.3. Bacterial transformation... 42
2.4. Isolation and purification of plasmid DNA ... 42
2.5. Genomic DNA extraction ... 43
2.6. Polymerase chain reaction ... 44
2.7. Purification of the PCR product ... 45
2.8. Purification of DNA from agarose gel ... 45
7
2.10. DNA sequence analysis ... 47
2.11. Expression of D1 or D1D2 ... 47
2.12. Purification of D1D2 ... 48
2.12.1. Preparation of the affinity column ... 48
2.12.2. Purification of D1D2... 49
2.13. Purification of D1 ... 50
2.13.1. Preparation of the affinity column ... 50
2.13.2. Purification of D1 ... 51
2.14. Protein quantification ... 52
2.15. SDS-PAGE ... 52
2.16. Activity assay ... 53
2.17. Titration of trypsin ... 53
2.18. Determination of the Michaelis-Menten constant of trypsin against Bz-Phe-Val-Arg-pNA ... 54
2.19. Determination of the inhibition constants of D1 and D1D2 towards bovine trypsin ... 55
2.20. Crystallization of D1 ... 57
2.21. Data collection and processing ... 57
2.22. D1 structure solution... 57
2.23. Trypsin-D1 complex preparation ... 58
2.24. Crystallization of trypsin-D1 complex ... 58
3. Results and discussion ... 60
3.1. DNA sequence analysis of pPICZαB-D1 and pPICZαB-D1D2 ... 62
3.2. Genomic DNA analysis... 65
3.3. Amplification of α-factor-D1 and α-factor-D1D2 cDNA ... 67
3.4. DNA sequence analysis of α-factor-D1 and α-factor-D1D2 cDNA integrated into Pichia pastoris genome ... 69
3.5. Expression of D1D2 ... 71
3.6. Purification of D1D2 ... 73
3.6.1. Preparation of the affinity column ... 74
3.6.2. Purification of D1D2... 75
8
3.8. Purification of D1 ... 81
3.8.1. Preparation of the affinity column ... 81
3.8.2. Purification of D1 ... 82
3.9. Trypsin titration ... 84
3.10. Determination of the maximum reaction rate and Michaelis-Menten constant of trypsin against Bz-Phe-Val-Arg-pNA ... 87
3.11. Determination of the inhibition constant of D1D2 and D1 towards bovine trypsin ... 91
3.12. D1 crystallization ... 97
3.13. Data collection, processing and refinement ... 99
3.14. D1 structure ... 100
3.15. Trypsin-D1 complex purification ... 102
3.16. Trypsin-D1 complex crystallization ... 105
4. Conclusion ... 108
5. Bibliography ... 114
10 Abbreviations
ADP Adenosine diphosphate
Ala Alanine
APS Ammonium persulfate
Arg Arginine
Asp Aspartic acid
AU Absorbance units
BIS-TRIS Bis(2-hydroxyethyl)amino-tris(hydroxymethyl)methane
BMGY Buffered glycerol-complex medium
BMMY Buffered methanol-complex medium
BSA Bovine serum albumine
Bz Benzoyl
cDNA Complementary deoxyribonucleic acid
gDNA Genomic deoxyribonucleic acid
Cys Cysteine
C-terminus Carboxyl-terminus
D1 Isolated first domain of boophilin
D1D2 Full-length boophilin
DIC Disseminated intravascular coagulation
dATP 2'-deoxyadenosine 5'-triphosphate
dCTP 2'-deoxycytidine 5'-triphosphate
dGTP 2'-deoxyguanosine 5'-triphosphate
DNA Deoxyribonucleic acid
dNTP Deoxyribonucleotide triphosphate
dTTP 2'-deoxythymidine 5'-triphosphate
EDTA Ethylenediaminetetraacetic acid
gDNA Genomic deoxyribonucleic acid
Gln Glutamine
Glu Glutamic acid
11 His Histidine Ki Inhibition constant Km Michaelis-Menten constant LB Luria-Bertani Lys Lysine
MES 2-Morpholinoethanesulfonic acid monohydrate
MOPS 3-(N-Morpholino)propanesulfonic acid
MPD 2-Methyl-1,3-propanediol
N-terminus Amino-terminus
NPGB 4-nitrophenyl 4-guanidinobenzoate hydrochloride
OD Optical density
PAI Plasminogen activator inhibitor
PAS Periodic acid-Schiff
PCR Polymerase chain reaction
PEG Poly(ethylene) glycol
Phe Phenylalanine
pI Isoelectric point
pNA 4-nitranilide
rpm Rotation per minute
Ser Serine
SDS Sodium dodecyl sulfate
SDS-PAGE Sodium dodecyl sulfate – polyacrylamide
gel electrophoresis
SOC Super optimal broth
TAE Tris, acetic acid, EDTA
TAFI Thrombin activatable fibrinolysis inhibitor
TAFIa Activated thrombin activatable fibrinolysis inhibitor
TE Tris-HCl, EDTA
TEMED N,N,N',N'-Tetramethylethylenediamine
TF Tissue factor
TFB I Standard transformation buffer I
12
TFPI Tissue factor pathway inhibitor
tPA Tissue-type plasminogen activator
Tris Tris(hydroxymethyl)aminomethane
Val Valine
Vmax Maximum reaction rate
14
1. Introduction
16 1.1. Haemostasis
Haemostasis is a group of well-regulated processes that are responsible for keeping the blood fluid and for avoiding blood loss after a vessel injury by the formation of a fast and local haemostatic plug. Normal haemostasis depends on the closely integrated and coordinated action of vascular wall, platelets and coagulation factors (Cotran et al., 2000).
After a vessel injury, the smooth muscle cells of the vessel wall contract in order to minimize blood loss. The platelets adhere to the collagen of the subendothelial matrix that is exposed by the vessel injury. Platelets become activated suffering morphological changes and releasing the content of large vesicles named granules. These granules contain adhesion proteins (fibrinogen and thrombospondin), serotonin (that promotes retention of procoagulant proteins on the platelet surface), ADP and other platelet-activating factors. Besides collagen, the cell membrane tissue factor (TF) is also exposed, and both initiate the coagulation cascade (Cotran et al., 2000).
1.2. Coagulation cascade
The coagulation cascade (Figure 1) has been traditionally presented as two relatively independent pathways: the intrinsic and the extrinsic pathways that converge into a common pathway (Ajjan and Grant, 2006; Cotran et al., 2000; Furie and Furie, 1988).
The intrinsic pathway is initiated by the activation of factor (f) XI, which in turn activates fIX to fIXa. FIXa in complex with its cofactor fVIIIa activates fX, initiating the common pathway (Cotran et al., 2000). The physiological initiator of the intrinsic pathway is not clear (Thiagarajan and Narayanan, 2001). The release of collagen from the subendothelial layer, after vessel injury, has been suggested as the initiator (Cotran et al., 2000). In vitro, this process can be induced by
17 exposing vessels to negatively charged non-physiological surfaces such as glass and other silicates (Jesty, 2001).
The extrinsic pathway is initiated by TF. TF activates fVII, forming the TF/fVIIa complex that induces the conversion of limited amounts of fIX to fIXa and catalyses the conversion of fX to fXa. The activation of fX marks the beginning of the common pathway. fXa forms a complex with fVa, phospholipids and calcium named prothrombinase complex, which activates thrombin by prothrombin cleavage (Mann et al., 2003). Thrombin is involved in a large number of reactions within and outside the coagulation cascade. The major role of thrombin in blood coagulation is the conversion of fibrinogen into fibrin. It also contributes for fibrin polymerization and stabilization by activating fXIII. Thrombin further amplifies thrombin generation by proteolytic activation of fV, fVIII and fXI. Besides its action in the coagulation cascade, thrombin is also involved in inflammation and tissue repair (Thiagarajan and Narayanan, 2001). The fibrin network, obtained at the end of the coagulation cascade, together with red and white blood cells and platelets, forms the blood clot that avoids blood loss through the site of injury (Cotran et al., 2000).
Nowadays, this rigid division is less often used to represent the coagulation mechanism (Jesty, 2001; Mann et al., 2003). The contribution of the intrinsic pathway to haemostasis seems to be small. People who lack fXII are clinically normal, even to the extent of being able to undergo major surgery. In contrast, a deficiency in TF has never been observed in humans, and in studies with transgenic mice, more than 80% of TF knock out animals die from haemorrhage (Jesty, 2001). Thus, the extrinsic pathway seems to have an important role in coagulation cascade initiation, while the intrinsic pathway contributes to the generation of additional thrombin molecules by a positive feedback mechanism. These two pathways are interdependent, in contrast to what their rigid division suggests. (Thiagarajan and Narayanan, 2001).
18 1.2.1. Clotting regulation
The coagulation cascade is tightly controlled by negative feedback mechanisms as well as by circulating and locally produced inhibitors (Figure 1). In this way, clot formation is restricted to the site of injury and the coagulation cascade is turned off once the blood clot is formed (Berkner, 2001).
When thrombin molecules diffuse away from the site of injury they are caught by thrombomodulin, present on the surface of uninjured endothelial cells. Thrombomodulin and thrombin form a complex that activates protein C, the major natural anticoagulant. Activated protein C binds to its cofactor protein S, produced by endothelial cells, and cleaves fVIIIa and fVa, shutting down the coagulation cascade. (Cotran et al., 2000) This negative feedback mechanism ensures a pulse of thrombin formation over the period during which cofactors are in their active state (Jesty, 2001).
There are also circulating inhibitors that shut off the activated clotting enzymes. Once the inhibitor-protease complex is formed it is rapidly removed from circulation and degraded (Berkner, 2001). Tissue factor pathway inhibitor (TFPI) blocks TF-fVII initiation of coagulation in a two-step mechanism: first, TFPI combines with fXa and then this complex inhibits TF-fVIIa complex. The need of fXa for inhibition of TF-fVIIa complex by TFPI allows the activation of significant amounts of fXa before inactivation of the TF-fVIIa complex (Jesty, 2001). Another circulating inhibitor is antithrombin III, a member of the serpin family of serine endopeptidase inhibitors (Rawlings et al., 2010). This inhibitor is present in plasma at levels largely exceeding those of its targets or their precursors (Jesty, 2001). Physiologically, antithrombin III inactivates thrombin and fXa and, to a lesser extent, factors IXa, XIa and XIIa (Bafunno and Margaglione, 2010). The inhibition mechanism used against thrombin is the best documented. Antithrombin III binds to thrombin, is cleaved but then traps thrombin in a complex (Berkner, 2001). The inhibition of clotting enzymes by antithrombin III is greatly increased by heparin, an highly sulfated polysaccharide (Jesty, 2001).
19 Figure 1 – Schematic representation of the coagulation cascade and its regulation. The coagulation cascade is initiated after a vessel injury when collagen or TF are exposed. The
20 successive activation of coagulation zymogens leads to the formation of thrombin, a proteinase that has a central role in coagulation and haemostasis. Thrombin cleaves fibrinogen into fibrin that, together with blood cells and platelets, forms the blood clot at the site of the injury. The coagulation cascade is tightly regulated in order to restrict clot formation to the site of injury and to turn off the cascade once the blood clot is formed.
1.2.2. Clot stabilization and lysis
The stability of the fibrin clot is determined by a delicate balance between coagulation and fibrinolysis. The fibrinolytic system is initiated after the formation of fibrin when both plasminogen and tissue-type plasminogen activator (tPA) bind to the fibrin surface to generate plasmin by proteolytic cleavage of plasminogen. The interactions between the lysine-binding sites of plasminogen and tPA and the C-terminal lysine residues of partially degraded fibrin result in the formation of a ternary complex and increase the catalytic efficiency of plasmin formation. Plasmin stimulates its own formation by generating new C-terminal lysine residues after fibrin cleavage (Figure 2). This positive feedback loop is stopped by plasminogen activator inhibitor (PAI), α2-antiplasmin and thrombin activatable fibrinolysis inhibitor (TAFI), thus protecting the fibrin clot against lysis (Bouma and Mosnier, 2003; Cotran et al., 2000).
PAI inhibits tPA interfering with plasminogen activation while α2-antiplasmin binds to plasmin forming an irreversible complex that is unable to lyse fibrin. Activated TAFI (TAFIa) inhibits fibrinolysis by removing C-terminal lysine and arginine residues from partially degraded fibrin, thereby lowering its binding capacity for plasminogen and inhibiting tissue plasminogen activator-mediated fibrin degradation. TAFI is activated by thrombin, but for this activation to occur higher concentrations of thrombin are required when compared to the amount necessary for fibrin formation. This fact combined with the short half-life of TAFI (about 10 minutes at 37ºC) suggest that regulation of its functional activity occurs most likely at the level of activation (Bouma and Mosnier, 2003).
21 Figure 2 – Clot stabilization and lysis. Fibrinolysis is initiated when plasminogen is cleaved to plasmin by tPA. Plasmin cleaves fibrin into soluble fibrin degradation products that contribute to the formation of new molecules of plasmin. This positive feedback loop is halted by PAI, α2-antiplasmin
and TAFI (adapted from (Bouma and Mosnier, 2003)).
1.3. Thrombosis
A deregulation in the processes involved in the maintenance of normal haemostasis can produce two pathologic situations: bleeding, when the deregulation leads to an inability to respond to a vessel injury, and thrombosis, when the haemostatic plug growth is not limited (Damjanov, 2000). There is also a pathology that combines bleeding and thrombosis named disseminated intravascular coagulation (DIC) (Cotran et al., 2000), in which the formation of disseminated small blood clots leads to a large consumption of platelets and coagulation proteins. With no machinery able to respond in case of injury, abnormal bleeding occurs. From this pathologies, thrombosis (in particular thromboembolism) is by far the major cause of morbility and mortality in western societies, largely due to the adopted life style and diet (Ajjan and Grant, 2006; Gross and Weitz, 2008).
22 1.3.1. Pathogenesis
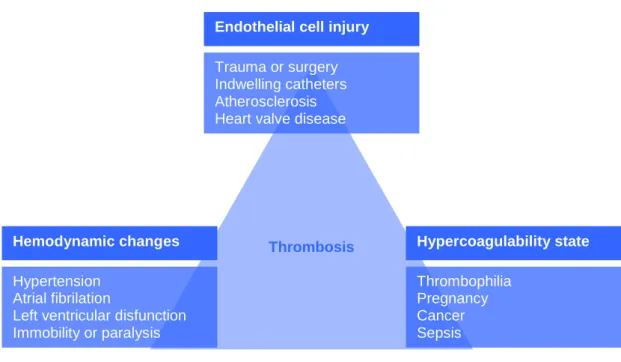
There are three predisposing conditions for the formation of pathological thrombi: endothelial cell injury, hemodynamic changes and hypercoagulability of the blood. These conditions, also known as the Virchow’s triad (Figure 3) can act independently to form a thrombus or can affect each other and have a cumulative effect (Cotran et al., 2000; Damjanov, 2000).
Figure 3 – Representation of the Virchow’s triad.
Endothelial injury leads to thrombus formation mainly in heart and arterial vessels. Sites for thrombus formation can include heart chambers (e.g. after an endocardic injury), ulcerated atherosclerotic plaques, inflammation sites or traumatic injury sites. Endothelial injury can also be produced by hemodynamic stress, radiation, bacterial toxins and smoking.
Hemodynamic factors that promote coagulation are of two kinds: those that lead to turbulence and those that slow down the blood flow. The normal blood flow
Endothelial cell injury Trauma or surgery Indwelling catheters Atherosclerosis Heart valve disease
Hemodynamic changes Hypertension
Atrial fibrilation
Left ventricular disfunction Immobility or paralysis Hypercoagulability state Thrombophilia Pregnancy Cancer Sepsis Thrombosis
23 is laminar meaning that the blood cells flow in the center of vascular lumen separated from the endothelium by acellular plasma that flows slower. Turbulence disturbs this normal flow and allows platelets to be exposed to the vessel wall and to discharge their granules as a result of mechanical stimulation. The turbulence also promotes damage of endothelial cells. On the other hand, slow blood flow promotes sedimentation of the cells and is also less efficient in washing away small thrombi than normal and more vigorous blood flow.
The factors that lead to hypercoagulability of blood can be divided into primary and secondary factors. The primary factors arise from genetic modifications of coagulation cascade factors or of regulators that lead to abnormal or absence of function. The secondary factors are acquired and the most significant are cancer, tissue injury, DIC, chronic cardiac failure, pregnancy, oral contraceptives and smoking.
1.3.2. Pathology
In most situations the formation of small thrombi is not correlated with a pathologic situation because they are lysed. Large thrombi can be incorporated into the vessel wall or recanalized, and thus blood can keep flowing. However, if a thrombus cannot be firmly attached to the vessel wall, recanalized or dissolved two situations can occur: the thrombus can block the vessel in the same place where it was formed or it breaks off from the anchoring surface giving rise to an embolus. Thromboembolus is an embolus of thrombotic origin that flows with blood and blocks small vessels (Cotran et al., 2000; Damjanov, 2000).
The occlusion of vessels leads to an interruption of the blood supply to an organ thus resulting in loss of function. This total occlusion can be observed in the histological section (Figure 4 A), where the whole diameter of a vessel is occupied by a thrombus. The presence of a vessel segment with no content confirms the absence of blood flow (Figure 4 A, thin arrow).
24 A prolonged insufficiency in blood supply can cause ischemic necrosis, named infarction. Every organ can be affected, resulting in different symptoms and conditions. The most severe thrombosis are those affecting the brain (Figure 4, B), heart or lungs, leading to irreversible damage and/or death (Cotran et al., 2000; Damjanov, 2000).
Figure 4 – Thrombosis. A) Microthrombosis in a lung vessel. Histological section PAS stained amplified 150x of pulmonary parenchyma with a capillary containing a thrombus (large arrow). The thrombus is blocking the capillary avoiding the blood flow. Notice the appearance of capillary after the thrombus (thin arrow) (Riede and Werner, 2004) B) Saggital and cortical vein thrombosis. Coronal section of the brain showing a fatal infraction and liquefaction (arrow) of the brain substance drained by the cortical veins (Cooke and Stewart, 2004).
1.4. Searching for therapeutic anticoagulants
Synthetic anticoagulants have been used to prevent and treat thrombosis in the venous and arterial circulation, including heart; however, they have well documented limitations. The increase of bleeding is the most common effect (Eikelboom and Hirsh, 2007) and some anticoagulants do not have a specific reversing agent, such as fondaparinux (Osinbowale et al., 2010). Interaction with other drugs and food were described for warfarin (Becattini et al., 2010). Some
25 anticoagulants, such as idraparinux and heparin, exert their inhibitory effect on the clotting enzymes indirectly via a potentiation of the inhibitory function of antithrombin, and thus, their inhibitory activity depends on the blood levels of this protein (Alban, 2008; Markwardt, 2003).
The need to overcome all these limitations drives a continual and intense effort to develop new, efficient and safe anticoagulants.
1.4.1. The best targets
Thrombin plays a central role in the process of haemostasis and thrombosis and for this reason it has become the primary target for the development of anticoagulant agents (Markwardt, 2003). However, thrombin has a great number of important activities within and outside the haemostatic system. For this reason, the inhibition of thrombin could affect not only the procoagulant properties of this protease but also interfere with other thrombin activities. As a consequence, the efficacy and the safety of thrombin inhibitors is questionable (Ansell, 2007).
Factor X is a good alternative to thrombin as a therapeutic target. Besides its position at the convergent point of the intrinsic and extrinsic pathways, in contrast to thrombin fXa has limited functions other than being the principal mediator of thrombin generation by prothrombinase activation. Furthermore, as the levels of serine proteinases are amplified at each step of the coagulation cascade, anticoagulants with target coagulation factors higher up than thrombin in the cascade, such fXa, are probably more effective than those directly targeting thrombin (Ansell, 2007).
Thrombin and fXa have evolved from a common ancestral protease related to chymotrypsin. However, in contrast to chymotrypsin that cleaves almost any protein, thrombin and fXa as every other clotting enzyme, cleave only a few specific proteins. The ability of each proteinase to recognize its cofactor and to cleave specific proteins is dependent upon its structure (Berkner, 2001). For this reason, understanding the structure of thrombin and fXa, as well as the
26 interactions they establish with other proteins is of high practical importance for the design of specific therapeutic anticoagulants. In fact, the initial thrombin publications have produced enormous efforts in the pharmaceutical industry worldwide, aimed at rationally designing and elaborating specific direct thrombin inhibitors, that could help to prevent venous thrombotic events (Bode, 2005).
1.4.1.1. Thrombin
Thrombin (EC 3.4.21.5) is a trypsin-like member of the chymotrypsin family of serine proteases (Rawlings et al., 2010). The human α-thrombin molecule (Stubbs and Bode, 1993) is composed of a light chain (36 residues) and of a heavy chain (259 residues), covalently linked by a disulfide bridge (Cys1-Cys122). The catalytic triad of thrombin, composed of Ser195, His57 and Asp102, occupies the bottom of a rather narrow cleft sandwiched between two large loops “inserted” at positions 60 and 149. In spite of a neutral isoelectric point, the electrostatic surface of thrombin reveals two highly positive areas sandwiching the negative active-site between them. These two positive surface regions are named anion binding exosites I and II, and play major functional roles by regulating thrombin interactions with substrates, cofactors and natural inhibitors (described below). Anion exosite I and II are also known as fibrinogen-binding site and heparin-binding site, respectively, showing their role in the specific interaction with fibrinogen and heparin (Figure 5, A).
The complex structure of thrombin reflects the multifunctional character of this proteinase: thrombin is a procoagulant and anticoagulant and it also plays a role in cellular proliferation and inflammation (Thiagarajan and Narayanan, 2001).
27 1.4.1.2. Factor Xa
Factor Xa (EC 3.4.21.6) is also a member of the trypsin-like serine proteinase family. As thrombin, fXa is composed of a light chain (16.2 kDa) and a heavy chain (42 kDa) linked together by a disulfide bond (Krupiczojc et al., 2008). The active site, by contrast, is more solvent-exposed, since the 60-loop and 149-loop are 8 and 6-residues shorter respectively, when compared to thrombin. Factor Xa also possesses two charged surface regions that are topologically equivalent to the thrombin exosites (Figure 5, B). Similar to thrombin, the exosite II of fXa is positively charged and is involved in heparin binding. On the other hand, the exosite I of fXa is negatively charged and plays a role in the activation of fX by fIXa (Chen et al., 2004; Manithody et al., 2002).
Figure 5 – Electrostatic surface potentials of human thrombin (A) and human fXa (B). The blue and red areas represent the positively and negatively charged surface, respectively. Notice the specific charge distribution of each proteinase and the accessibility of the active-sites (Corral-Rodríguez et al., 2009).
28 1.5. Coagulation inhibitors from haematophagous animals
During evolution, while vertebrate animals developed a complex haemostatic system to prevent blood loss, blood-feeding animals evolved anticoagulant mechanisms to counteract the haemostatic response of their hosts in order to facilitate blood drawing, storage and digestion. These anticoagulant mechanisms interfere with fibrinolysis, platelet aggregation and blood coagulation (Urata et al., 2003). The blood coagulation inhibitors identified in blood-feeding animals seem to be directed mainly to thrombin and its activator fXa. Unlike physiological inhibitors of blood coagulation proteinases, which are mainly of the serpin and Kunitz families, large molecular diversity is observed in the coagulation inhibitors from haematophagous animals (Koh and Kini, 2009). Although a number of natural inhibitors from haematophagous animals have been described, only a few have been fully characterised, and even fewer have been studied from a structural view-point.
Because of its special role in blood coagulation, thrombin has become the most attractive target for potential therapies against thrombosis. Consequently, special attention was dedicated to the study of haematophagous-derived thrombin inhibitors. To date, only six thrombin inhibitors were structurally characterised revealing six different inhibition strategies in a wide variety of structural scaffolds (Fuentes-Prior et al., 1997; Grütter et al., 1990; Macedo-Ribeiro et al., 2008; Richardson et al., 2000; Rydel et al., 1990; Van de Locht et al., 1995; Van de Locht et al., 1996).
1.5.1. Thrombin inhibitors
The thrombin inhibitor hirudin, isolated from the leech Hirudo medicinalis, is the best studied natural thrombin inhibitor (Grütter et al., 1990; Markwardt, 1970; Rydel et al., 1990; Stone and Hofsteenge, 1986). The N-terminal domain of hirudin folds into a globular unit stabilised by three disulfide bridges and the C-terminal
29 domain shows an extended conformation. During thrombin inhibition, the three N-terminal residues bind to an hydrophobic pocket on the active site of thrombin in a non-canonical manner, while the C-terminal region, rich in acidic residues, interacts with exosite I (Figure 6, A). Hirudin, the most potent thrombin inhibitor known so far (Ki = 22x10-15 M), has been used as a model for the development of anticoagulant inhibitors. Nowadays, structural variants of hirudin are produced as recombinant proteins (leupirudin and desirudin) for therapeutic use. However, they have limitations: bleeding, lack of a specific antidote and risk of immunoresponse (Greinacher and Warkentin, 2008).
Another member of the hirudin family is haemadin (Rawlings et al., 2010). Although hirudin and haemadin share low sequence similarity, they display a common three-dimensional structure: a globular N-terminal stabilised by three disulfide bridges with an extended acidic tail. The inhibition of thrombin by haemadin, with an inhibition constant of 2.4x10⁻¹³ M, involves the binding of the three N-terminal residues of haemadin to the active site of thrombin, similar to hirudin, and the interaction of the C-terminal tail with the exosite II instead of the exosite I (Figure 6, B) (Richardson et al., 2000).
The only thrombin Kazal-type inhibitor structurally characterized is rhodniin, isolated from Rhodnius prolixus. Rhodniin is composed by two Kazal-type domains and exhibits an inhibition constant of about 2x10-13 M (Friedrich et al., 1993). The first domain canonically binds to the thrombin active site and the second interacts with the exosite I (Figure 6, C) (Van de Locht et al., 1995).
Triabin, isolated from Triatoma pallidipennis (Noeske-Jungblut et al., 1995) , shows no similarity with any other inhibitor known, giving name to the triabin family (Rawlings et al., 2010). Its structure shows an eight-stranded β-sheet, which is smoothly rolled and annealed at both edges forming a slightly flattened and conical β-barrel with the overall appearance of a calyx (Fuentes-Prior et al., 1997). The interaction of triabin with the exosite I of thrombin effectively blocks thrombin’s cleavage of physiological substrates (Figure 6, D). The inhibition constant found for triabin was 3x10-12 M (Noeske-Jungblut et al., 1995).
Ornithodorin and boophilin are both from the BPTI-Kunitz family. Ornithodorin (Van de Locht et al., 1996) was isolated from Ornithodorus moubata
30 and is a potent thrombin inhibitor (Ki= 1x10-12 M). It is composed of two distorted Kunitz modules: the highly acidic C-terminal domain binds to the exosite I of thrombin and the first N-terminal residues interact with the active site (Figure 6, E). Boophilin (Macedo-Ribeiro et al., 2008) was isolated from Boophilus microplus, recently reclassified as Rhipicephalus microplus (Barker and Murrell, 2002). This inhibitor is composed of two canonical Kunitz-type domains. During thrombin inhibition, the N-terminal residues of boophilin bind across thrombin’s active site cleft in a parallel, hirudin-like manner while the C-terminal domain interacts with thrombin’s exosite I (Figure 6, F). Boophilin exhibits an inhibition constant of 1.8x10⁻⁹ M against thrombin.
31 Figure 6 – Interactions between thrombin and six of its inhibitors. Thrombin is represented by its electrostatic surface potential while inhibitors are shown as orange ribbons. A) Hirudin-thrombin complex (PDB: 1HRT); B) Haemadin-thrombin complex (PDB: 1E0F); C) Rhodniin-thrombin complex (PDB: 1TBQ); D) Triabin-thrombin complex (PDB: 1AVG); E) Ornithodorin-thrombin complex (PDB: 1TOC); F) Boophilin-thrombin complex (PDB: 2ODY).
C
A B
D
32 1.5.1.1. Boophilin
There are two described variants of boophilin: isoform H2 and isoform G2. The mRNA encoding for the mature protein of each isoform has eight nucleotide differences, four of which result in amino acids exchanges. However, these substitutions are conservative: in the N-terminal domain, the aspartic acid present at position 66 of isoform G2 is replaced by a glutamic acid in isoform H2; in the linker region Ser78 and Gly82 of isoform G2 are substituted in isoform H2 by an asparagine and a serine, respectively; and in the C-terminal domain, Arg110 of isoform G2 is replaced by a glutamine in isoform H2 (Figure 7) (Macedo-Ribeiro et al., 2008). Both isoforms have a molecular weight of about 13.9 kDa and an isoelectric point of 4.3.
Figure 7 – Amino acid alignment between the two isoforms of boophilin. The signal peptide is shadowed in grey. The amino acid differences between both isoforms are highlighted in red.
Boophilin inhibits thrombin, the central proteinase of the coagulation cascade (Macedo-Ribeiro et al., 2008). From a therapeutic point of view, boophilin could be used not only as an anticoagulant but also as a model for the design of
1 10 20 30 40 50 60 | | | | | | | H2 MKCIILLAVLGTAFAQRNGFCRLPADEGICKALIPRFYFNTETGKCTMFSYGGCGGNENN G2 MKYLILLAVLGTAFAQRNGFCRLPADEGICKALIPRFYFNTETGKCTMFSYGGCGGNENN 70 80 90 100 110 120 | | | | | | H2 FETIEECQKACGAPERVNDFESADFKTGCEPAADSGSCAGQLERWFYNVQSGECETFVYG G2 FETIEDCQKACGAPERVSDFEGADFKTGCEPAADSGSCAGQLERWFYNVRSGECETFVYG 130 140 | | H2 GCGGNDNNYESEEECELVCKNM G2 GCGGNDNNYESEEECELVCKNM
33 synthetic anticoagulant drugs. On the other hand, thrombin inhibitors are critical for haematophagous animals during feeding and digestion. For this reason it has been proposed that inhibitors targeting thrombin, such as boophilin, could be used as targets for the control of pathogen-transmitting parasites (Wikel and Bergman, 1997).
1.5.1.1.1. Inhibitor of clot formation
In vitro, boophilin is able to inhibit several serine proteases, including thrombin, trypsin, plasmin and urokinase-type plasminogen activator. Despite the ability to inhibit at least these proteases, boophilin is specially active against thrombin and trypsin. The activity of boophilin against these two proteases is significantly reduced in absence of the N-terminal domain (Macedo-Ribeiro et al., 2008).
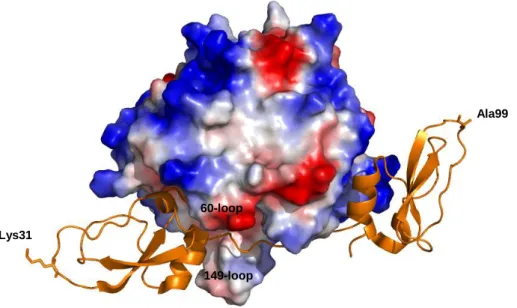
The crystallographic structure of the thrombin-boophilin complex shows that this inhibitor is composed by two canonical BPTI-Kunitz domains connected by a 10-residue linker. In spite of the presence of a reactive site loop in the N-terminal domain, boophilin inhibits thrombin according to a non-canonical mechanism, in which the N-terminal Arg17 blocks the active site of thrombin while the negatively charged surface of the C-terminal domain establishes electrostatic and hydrophobic interactions with the exosite I of thrombin (Figure 8) (Macedo-Ribeiro et al., 2008).
The most interesting feature about boophilin is that thrombin-bound boophilin retains the capability to interact with a trypsin-like serine proteinase. The presence of an alanine at the P1 position of the C-terminal domain of boophilin strongly disfavours it canonical binding to a trypsin-like protease and the ability of the isolated N-terminal domain to inhibit trypsin suggests that boophilin inhibits a subset of trypsin-like serine proteinases according to a canonical mechanism with the Lys31 occupying the S1 pocket of the bound enzyme. In fact, the structure of the thrombin-boophilin complex shows that Lys31 remains completely accessible
34 for interaction with an additional proteinase (Figure 8). (Macedo-Ribeiro et al., 2008).
Figure 8 – Boophilin in complex with thrombin (PDB: 2ODY). Thrombin is represented by its electrostatic surface potential while boophilin is shown as an orange ribbon. Boophilin is composed of two canonical BPTI-Kunitz domains. The presence of a lysine at the P1 position of the N-terminal domain of boophilin favours it canonical binding to a trypsin-like proteinase.
In vivo, it is possible that besides inhibiting thrombin, boophilin targets another trypsin-like serine proteinase of the coagulation cascade. Meizothrombin is an intermediate during the prothrombin activation by the prothrombinase complex (fXa-fVa). If boophilin is also able to inhibit meizothrombin, that already has the active site and exosite I formed, fXa seems to be the most attractive candidate because of its physical proximity. This would result not only in thrombin inhibition, but also in the impairment of thrombin generation, making boophilin a good model for the design of new therapeutic anticoagulants. However, in vitro fXa is only marginally inhibited by free boophilin. It is possible that the formation of the ternary complex depends on the proper orientation of both membrane-bound serine proteinases, and probably requires additional boophilin-fVa interactions (Macedo-Ribeiro et al., 2008). This strategy is already used by some inhibitors,
60-loop Lys31
Ala99
35 such as TFPI. The TFPI inhibits fVIIa using its first Kunitz domain, but only after its second Kunitz domain bound fXa (Broze, 1995).
1.5.1.1.2. Target for Rhipicephalus microplus control
Boophilin is produced by the cattle tick Rhipicephalus microplus, the major ectoparasite affecting livestock in America, Asia, Africa and Oceania. Besides being the vector of Babesia spp and Anaplasma spp, this blood-sucking parasite causes significant economic impact due to both blood and milk losses and leather damage. The enormous economic losses caused by this parasite could be minimized by the control of tick populations down to acceptable levels. Usually, tick control is performed with acaricides, however, the improper use of these substances has increased the incidence of acaricide-resistant ticks, besides increasing the occurrence of environmental and food contamination. Thus, the development of new control strategies is necessary (Parizi et al., 2009).
It has been proposed that preventing blood feeding of pathogen-transmitting parasites by interfering with specific inhibitors of haemostasis could provide novel approaches for improving human and animal health (Wikel and Bergman, 1997). Boophilin is the best studied and the most potent coagulation inhibitor from Rhipicephalus microplus known (Ciprandi et al., 2006; Horn et al., 2000; Macedo-Ribeiro et al., 2008; Ricci et al., 2007) and, for this reason, boophilin seems to be the best target for the development of new anti-Rhipicephalus microplus vaccines.
36 1.6. Objectives
Boophilin is a serine endopeptidase inhibitor able to inhibit in vitro thrombin and trypsin at the same time. This ability is unique between the thrombin inhibitors described to date and suggests that boophilin uses two different inhibition mechanisms. Up to now, only the inhibition mechanism used against thrombin was described. In vivo, the second inhibition mechanism is probably used against a (non-thrombin) trypsin-like serine proteinase from the coagulation cascade, such as fXa. This ability would result not only in thrombin inhibition but also in the impairment of thrombin generation, making boophilin a good model for the design of new anticoagulant drugs. This thesis proposes to clarify this second inhibition mechanism by studying the trypsin-boophilin complex.
The inhibition of trypsin by the isolated C-terminal domain (second domain) of boophilin is only observed when it is in large excess over the protease. Moreover, the presence of a lysine in the reactive-loop of the N-terminal domain (first domain) of boophilin strongly suggests that trypsin inhibition is achieved by this domain (Macedo-Ribeiro et al., 2008). We propose to clarify the contribution of each isolated domain by comparing the inhibition constants between full-length boophilin and its isolated first domain. However, to understand the inhibition mechanism used by boophilin against trypsin, additional studies are necessary.
The interaction between proteins has been studied by X-ray crystallography, which allows the visualization of the complex at atomic or near atomic level. As the name suggests, for the application of X-ray diffraction, the protein must be first crystallized. The crystallization has become the primary obstacle in X-ray crystallography since protein crystallization is highly affected by their dynamic structure (McPherson, 2004). Assuming that the second domain does not participate in the inhibition of trypsin, the complex composed by full-length boophilin and trypsin would be very flexible and hard to crystallize. If boophilin inhibits trypsin only by its first domain the complex composed by the isolated first domain and trypsin would be a good model to study the inhibition mechanism and would also probably crystallize. However, it is first necessary to confirm that the
37 isolated first domain has a conformation similar to the first domain of the full-length boophilin. We propose to crystallize and determine the structure of the isolated first domain of boophilin by X-ray crystallography.
If the crystallographic structure of the isolated first domain shows a conformation similar to the first domain of full-length boophilin, we propose to crystallize the complex composed by the isolated first domain and trypsin and to determine it crystallographic structure.
38
2. Materials and Methods
40 2.1. Materials
Bovine pancreatic trypsin, Glycine max trypsin inhibitor, Glycine max trypsin-chymotrypsin inhibitor, BSA, NPGB, primers (3’AOX1 and 5’AOX1),
phenol-chloroform-isomyl alcohol, cyanoborohydride solution, 2-mercaptoethanol,
benzamidine, TEMED, bromophenol blue, glycine, calcium chloride, BIS-TRIS, potassium phosphate monobasic, potassium phosphate dibasic, potassium acetate, manganese (II) chloride, sodium acetate, sodium cacodylate, sodium oxamate, Triton X-100, ammonium sulfate, MOPS, methanol, tryptone and the glycerol used for crystallography were acquired from Sigma-Aldrich Química S.A. (Sintra, Portugal). PEG 1000, PEG 3350, PEG 8000, MPD, sodium carbonate, myo-inositol, biotin, rubidium chloride and potassium hydroxide were obtained from Fluka, as part of Sigma-Aldrich Química S.A. (Sintra, Portugal). Magnesium sulfate and sodium citrate were acquired from Riedel-de-Haën, distributed by Sigma-Aldrich Química S.A. (Sintra, Portugal). Sodium chloride, yeast extract, Tris, sodium formate, lithium sulfate monohydrate, sodium azide, glacial acetic acid, hydrochloric acid, dextrose, EDTA, potassium chloride, magnesium chloride, MES, sodium phosphate dibasic, sodium phosphate monobasic and sodium hydroxide were purchase from Merck, distributed by VWR (Carnaxide, Portugal). Ethanol was purchased from Aga (Porto, Portugal). Imidazole was acquired from USB Corporation, distributed by Isogen Life Science (Barcelona, Spain). Agar was obtained from Liofilchem and ethidium bromide solution was acquired from AppliChem, both distributed by Frilabo (Maia, Portugal). The glycerol used in culture media was obtained from Panreac (Amadora, Portugal). BactoTM peptone was purchased from BD Biosciences, distributed by ENZIfarma S.A. (Oeiras, Portugal). Sodium dodecylsulfate (SDS), acrylamide solution, APS and Poly-Prep® Column were obtained from Bio-rad (Amadora, Portugal). PageBlueTM stain, Pfu polymerase, Pfu polymerase buffer, dATP, dTTP, dCTP, dGTP and 6x Orange Loading Dye were obtained from Fermentas, distributed by Bioportugal (Porto, Portugal). NZYMiniprep Kit was obtained from NZYTech (Lisboa, Portugal). QIAquick® PCR Purification Kit and QIAquick® Gel Extraction Kit were acquired from QIAGEN, distributed by Izasa Portugal (Carnaxide, Portugal). CNBr-activated
41 Sepharose 4B, Mono Q and Superdex 75 columns and bovine thrombin were obtained from GE Healthcare (Carnaxide, Portugal). AminoLink Plus Coupling Resin was purchased from Thermo Scientific Pierce, distributed by Dagma Lda (Carcavelos, Portugal). Agarose and ZeocinTM were purchased from Invitrogen Life Technologies (Barcelona, Spain). The chromogenic substrate Bz-Phe-Val-Arg-pNA was purchased from Bachem (Weil am Rhein, Germany). Chromozym® TH (Tos-Gly-Pro-Arg-pNA) was purchased from Roche (Amadora, Portugal). Crystal Screen, Crystal Screen 2, PEG-Ion and Index were obtained from Hampton Research (Aliso Viejo, California). Proplex, Morpheus and JCSG-plus were acquired from Molecular Dimensions (Newmarket, United Kingdom).
2.2. Preparation of Escherichia coli DH5α competent cells
Escherichia coli DH5α cells were grown in LB agar plates (Appendix I, a, i) at 37 ºC overnight. A single colony was used to inoculate 10 ml of LB medium (Appendix I, a, i). The culture was grown at 37 ºC with shaking (180 rpm) to an optical density (OD) of 0.3 at 550 nm. The biomass was then amplified by adding 4 ml of this culture to 100 ml of LB medium and incubating in the above conditions until an OD of 0.3 at 550 nm was reached. The culture was then incubated on ice for 5 minutes followed by centrifugation at 1000 g for 5 minutes at 4 ºC. The supernatant was discarded and the pellet was gently resuspended in 20 ml of ice-cold TFB I (Appendix I, b, i). After centrifugation at 1000 g and 4 ºC for 5 minutes, the new supernatant was rejected and the pellet suspended in 2.5 ml of ice-cold TFB II (Appendix I, b, ii). The cell suspension was incubated on ice for 5 minutes, aliquoted into ice-cold microcentrifuge tubes, frozen in liquid nitrogen and stored at -80 ºC.
42 2.3. Bacterial transformation
Fifty microlitres of E. coli DH5α competent cells prepared as described in section 2.2 were thawed on ice and 200 ng of pPICZαB (Appendix III) containing the cDNA for full-length boophilin (D1D2) or for its first domain (D1) was added. The mixture was incubated on ice for 30 minutes and heat-shocked at 42 ºC for 30 seconds. The mixture was incubated on ice for 2 minutes before adding 600 μl of SOC medium (Appendix I, a, ii). Cells were recovered at 37 ºC for 1 hour with shaking (180 rpm). For transformant selection two hundred microlitres of the culture were spread on Low Salt LB agar plates (Appendix I, a, iii) containing 25 μg/ml of ZeocinTM
(Invitrogen). A low salt concentration is required for the transformant selection with ZeocinTM, since a salt concentration above 90 mM inhibits the drug. The plates were incubated at 37 ºC overnight. A negative control was performed in parallel, without plasmid DNA addition.
2.4. Isolation and purification of plasmid DNA
A single colony of E. coli DH5α transformed with pPICZαB-D1D2 or pPICZαB-D1 was grown at 37 ºC overnight with shaking (180 rpm) in 10 ml of Low Salt LB containing 25 μg/ml of ZeocinTM. Each vector was purified using the NZYMiniprep Kit (NZYTech). The overnight culture was centrifuged at 4000 g for 10 minutes at room temperature and the supernatant was discarded. The cell pellet was resuspended in Buffer A1 and lysed with 250 µl of lysis buffer (Buffer A2). After mixing by gently inverting the tubes 8 times, the mixture was incubated at room temperature for 4 minutes. Three hundred microlitres of neutralization buffer (Buffer A3) were added and mixed by gently inverting the tubes 8 times. The solution was then centrifuged for 10 minutes at 16000 g and the supernatant obtained was loaded onto the NZYTech spin column already placed in a 2 ml collecting tube. After centrifugation at 16000 g for 1 minute the flow-through was discarded. The column membrane was washed in two steps by centrifugation for 1
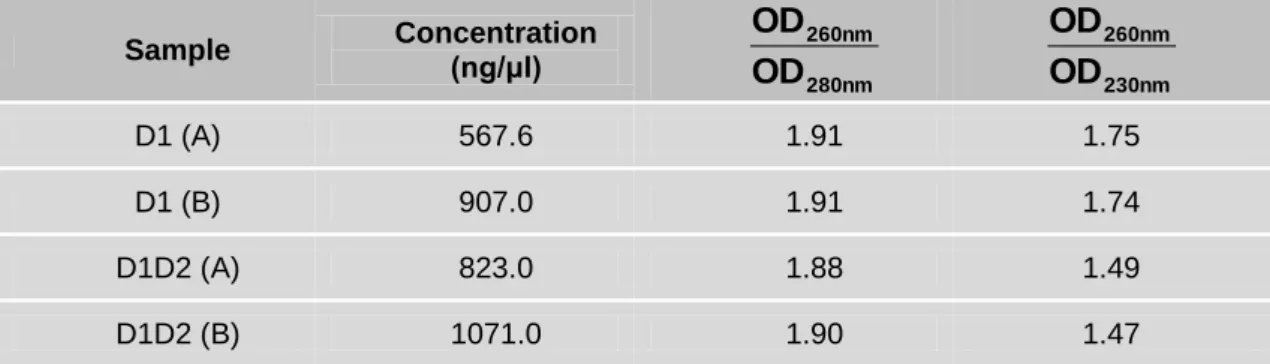
43 minute at 16000 g with 500 µl of Buffer AW pre-warmed at 50 ºC followed by 600 µl of Buffer A4. An additional centrifugation at 16000 g for 2 minutes was performed in order to remove all ethanol from the column membrane. The NZYTech spin columns were placed into clean 1.5 ml microcentrifuge tubes. Thirty microlitres of sterile water were loaded onto the column and incubated for 1 minute at room temperature. DNA was collected by centrifugation at 16000 g for 1 minute. The eluted DNA was quantified by measuring the absorbance at 260 nm and the quality was assessed by the ratio between the absorbance at 260 nm and 280 nm and at 260 nm and 230 nm. This analysis was performed on a NanoDrop ND-1000 Spectrophotometer (Thermo Scientific).
2.5. Genomic DNA extraction
Ten microlitres of each glycerol stock containing Pichia pastoris cells transformed with pPICZαB-D1 or pPICZαB-D1D2 were grown in 10 ml of YPD medium (Appendix II, a, i) containing 100 μg/ml of ZeocinTM
at 28 ºC and 220 rpm to an OD of 1.5 at 600 nm. After reaching the desired OD, the culture was centrifuged at 1200 g for 10 minutes at room temperature. The supernatant obtained was rejected and the pellet was resuspended in 500 µl of sterile water. After transferring to a microcentrifuge tube, the suspension was centrifuged at 16000 g for 5 minutes at room temperature. The supernatant obtained was rejected and the cell pellet was resuspended in 200 µl of lysis buffer (Appendix II, b, i). Three hundred milligrams of glass spheres (Ø 0.5 mm) and 200 µl of phenol-chloroform-isoamyl alcohol mixture were added and then all the components were mixed by vortexing at high speed for 3 minutes at room temperature. Two hundred microlitres of TE buffer (10 mM pH 8.0, 1 mM EDTA) were added and the mixture was mixed by vortexing. After centrifugation at 16000 g for 5 minutes at room temperature, the aqueous phase (upper phase) was transferred to a clean microcentrifuge tube. Nucleic acids were precipitated by adding 1 ml of 100% ethanol and mixing by inverting the tube. After centrifugation at 16000 g for 3
44 minutes at room temperature, the supernatant was rejected and the pellet resuspended in 400 µl of TE buffer. To remove RNA, 30 µg of RNAse A were added and incubated for 5 minutes at 37 ºC followed by precipitation of genomic DNA with 10 µl of 3 M sodium acetate and 1 ml of 100% ethanol. After centrifugation at 16000 g for 3 minutes at room temperature the supernatant was rejected and the pellet was air-dried at room temperature. The genomic DNA was resuspended in 50-100 µl of sterile water until complete dissolution. The DNA was quantified by measuring the absorbance at 260 nm and the quality was analysed by the ratio between the absorbance at 260 nm and 280 nm and at 260 nm and 230 nm. The integrity of genomic DNA was confirmed by DNA electrophoresis as described in section 2.9.
2.6. Polymerase chain reaction
The sequences coding for the D1D2 or the D1 integrated in the genomic DNA of Pichia pastoris cells were amplified by PCR. The reaction mixture containing Pfu buffer (20 mM Tris-HCl pH 8.8 at 25 ºC, 10 mM (NH4)2SO4, 10 mM KCl, 0.1 mg/ml BSA, 0.1% (v/v) Triton X-100, 2 mM MgSO4) (Fermentas), 0.2 mM of each dNTP (dATP, dCTP, dGTP, dTTP), 0.5 μM of 3’AOX1 primer
(5´-GCAAATGGCATTCTGACATCC-3´), 0.5 μM 5’AOX1 primer
(5´-GACTGGTTCCAATTGACAAGC-3´) and 2 U Pfu DNA polymerase (Fermentas) were added to about 1 μg of genomic DNA to a final volume of 50 µl. The cDNA was amplified by 30 cycles of denaturation at 95 ºC for 30 seconds, annealing at 57 ºC for 30 seconds and extension at 72 ºC for 2 minutes preceded by a initial denaturation step at 95 ºC for 3 minutes and followed by a final extension step at 72 ºC for 15 minutes. The PCR product obtained after amplification of D1D2 cDNA was re-amplified by a new PCR. The PCR product was first purified as described in section 2.7 and then 36 ng of purified PCR product were added to the reaction mixture to a final volume of 50 µl. The amplification reaction was performed in the same conditions as described previously. The PCR product was analysed by DNA
45 gel electrophoresis (section 2.9), purified (section 2.7 and 2.8) and sequenced (section 2.10).
2.7. Purification of the PCR product
The PCR product was purified using the QIAquick® PCR Purification Kit (QIAGEN). Two hundred microlitres of binding buffer (Buffer PB) were added to 40 µl of PCR product and mixed by gently pipetting up and down. Once the colour of the mixture had turned violet, 10 µl of 1 M sodium acetate pH 4.1 were added and the sample was applied to a QIAquick spin column already placed into a 2 ml collection tube. After centrifugation at 16000 g for 60 seconds at room temperature, the flow-through was discarded and the column was washed with 750 µl of Buffer PE by repeating the previous centrifugation. The flow-through was discarded and the column centrifuged for an additional 1 minute to remove all traces of ethanol. The column was placed in a clean 1.5 ml microcentrifuge tube and 30 µl of sterile water were added to the center of the QIAquick membrane. After incubation for 1 minute at room temperature, the DNA was eluted by centrifugation at 16000 g for 1 minute at room temperature. The eluted DNA was quantified by measuring the absorbance at 260 nm and the quality was assessed by the ratio between the absorbance at 260 nm and 280 nm and at 260 nm and 230 nm. This analysis was performed on a NanoDrop ND-1000 Spectrophotometer (Thermo Scientific).
2.8. Purification of DNA from agarose gel
The PCR product obtained after the second amplification of D1D2 cDNA was separated from contaminants by agarose gel electrophoresis. The band containing the D1D2 cDNA was excised from the gel with a sterile scalpel blade under UV light and the cDNA was purified using the QIAquick® Gel Extraction Kit
46 (QIAGEN). The gel slice was weighed and the agarose dissolved in 3 gel volumes (considering 1 µl = 1 μg) of solubilization buffer (Buffer QC) at 50 ºC for 10 minutes. During this incubation, the sample was mixed by vortexing every 3 minutes. After dissolution, 1 gel volume of isopropanol was added to the sample and mixed by inverting the tube. The sample was then applied to a QIAquick spin column already placed in a 2 ml collection tube. The column was centrifuged at 16000 g for 1 minute and the flow-through was discarded. In order to remove all traces of agarose, the column was washed with 0.5 ml of Buffer QG by centrifugation at 16000 g for 1 minute. The column was then incubated with 0.75 ml of Buffer PE for 2 minutes at room temperature. After centrifugation at 16000 g for 1 minute the flow-through was discarded and the column centrifuged for an additional 1 minute to remove all ethanol from the column membrane. The column was placed into a sterile 1.5 ml microcentrifuge tube and incubated with 30 µl of sterile water for 1 minute at room temperature, and then centrifuged at 16000 g for 1 minute at room temperature to collect the purified DNA. The eluted DNA was quantified by measuring its absorbance at 260 nm and its quality was assessed by the ratio between the absorbance at 260 nm and 280 nm and at 260 nm and 230 nm. This analysis was performed on a NanoDrop ND-1000 Spectrophotometer (Thermo Scientific).
2.9. DNA electrophoresis
Genomic DNA and PCR products were analysed on a 2% agarose gel containing 0.2 μg/ml of ethidium bromide. Samples were prepared by adding 1/6 sample volume of 6x Orange DNA Loading Dye (10 mM Tris-HCl pH 7.6, 0.15% orange G, 0.03% xylene cyanol FF, 60% glycerol and 60 mM EDTA) (Fermentas). The agarose gels (50 ml) were run at 100 V in TAE buffer (0.2 M Tris, 0.571% glacial acetic acid, 5 mM EDTA).
47 2.10. DNA sequence analysis
The cDNA for D1D2 and D1 cloned into pPICZαB or amplified from the
genomic DNA of P. pastoris were analysed by DNA sequencing using5’AOX1
(5’-GACTGGTTCCAATTGACAAGC-3’) as primer (Eurofins MWG, Germany). The nucleotide sequences obtained for the plasmids were translated and aligned with both boophilin isoforms (GenBank numbers CAC82583.1 and CAC82582.1). The nucleotide sequences obtained for the genomic DNA were translated and aligned with the amino acid sequences obtained for the plasmids. All alignments were
performed using the ClustalW tool (Thompson et al., 1994)
(http://www.ebi.ac.uk/Tools/clustalw2/index.html). .
2.11. Expression of D1 or D1D2
Pichia pastoris KM71H cells transformed with pPICZαB coding for D1D2 or D1 fused to a N-terminal signal peptide (α-factor) were grown in YPD agar plates (Appendix II, a, i) containing 100 μg/ml of ZeocinTM for 2 days. Ten millilitres of BMGY (Appendix II, a, ii) were used to grow one colony at 29 ºC and 220 rpm to an OD of 2-6. The cellular mass was amplified by adding the previous culture to 1 l of BMGY and growing in the same conditions to an OD of 2-6. To induce expression, the pellet obtained after centrifugation of the culture was resuspended in 200 ml BMMY (Appendix II, a, iii). The cells were incubated at 29 ºC and 220 rpm for 5 days. Every 24 hours 1 ml of 100% methanol was added to the culture. Since both recombinant proteins were secreted, cells were harvested by centrifugation at 10000 g for 5 minutes at room temperature and the supernatant was saved. The expression was confirmed by SDS-PAGE analysis (sections 2.15) and in vitro activity assays (2.16).
48 2.12. Purification of D1D2
D1D2 was first purified by affinity chromatography in an immobilized-trypsin column. This column was prepared as described below.
2.12.1. Preparation of the affinity column
An immobilized-trypsin affinity column was prepared by coupling bovine pancreatic trypsin (Sigma) to CNBr-activated Sepharose 4B (GE Healthcare). This medium was supplied lyophilized in the presence of additives. In order to remove the additives, 5 g of lyophilized powder were resuspended in 100 ml of 1 mM HCl and washed for 20 minutes in 900 ml of the same solution on a sintered glass filter (porosity G3). The swollen medium was washed with 200 ml of 0.1 M NaHCO3 pH 8.3, 0.5 M NaCl (coupling solution). Seven hundred and fifty milligrams of trypsin were dissolved in 12 ml of coupling buffer (at this stage 10 µl of the mixture were saved for protein quantification by measuring the absorbance at 280 nm). Two millilitres of 200 mM benzamidine solution were prepared in coupling buffer and added to the 12 ml of trypsin solution. The trypsin-benzamidine solution was incubated with the medium at 4 ºC overnight. The suspension was filtered on a sintered glass filter (porosity G3) and the flow-through was collected. The benzamidine present in the flow-through was eliminated by 3 cycles of dialysis each against 100 volumes of coupling buffer at 4 ºC. After dialysis the trypsin present in the flow-through was quantified by measuring the absorbance at 280 nm. The medium was washed with 100 ml of coupling buffer to remove the excess of trypsin. The remaining reactive groups of the medium were blocked by incubating with 50 ml of ethanolamine pH 8.0 for 2 hours at room temperature with end-over-end rotation. The medium was washed with 3 cycles of alternating pH. Each cycle included a wash with 50 ml of 0.1 M sodium acetate pH 4.0 containing 0.5 M NaCl followed by 50 ml of 0.1 M Tris-HCl pH 8.0 containing 0.5 M NaCl.
49 The coupling efficiency was determined by subtracting the amount of trypsin present in the dialysed flow-through to the total protease in the trypsin solution. The percentage of active trypsin coupled to the medium was also quantified in order to determine the effective binding capacity. One millilitre of medium was loaded into a Poly-Prep® Column (Bio-Rad) and equilibrated with 20 ml of 50 mM Tris-HCl pH 8.0, 150 mM NaCl (binding buffer). Twelve milligrams of Glycine max trypsin-chymotrypsin inhibitor (Sigma) were dissolved in binding buffer and added to the column. The column was washed with 30 ml of binding buffer and bound material was eluted with 8 ml of 0.5 M KCl pH 2.0. One millilitre fractions were collected and their pH neutralized by adding 50 µl of 1 M Tris (pH not adjusted). The eluted material was quantified by measuring the absorbance at 280 nm. The amount of trypsin inhibitor present in the eluted material was used to quantify the binding capacity of the column.
2.12.2. Purification of D1D2
The supernatant obtained after D1D2 expression was filtered (0.45 µm pore) and applied to the immobilized-trypsin affinity column prepared as described before, previously equilibrated with at least 20 column volumes of 0.1 M Tris-HCl pH 8.0. The column was washed with at least 20 column volumes of 0.1 M Tris-HCl pH 8.0 and bound proteins were eluted by competition with 4 column volumes of 1 M benzamidine in the same buffer. The benzamidine present in the eluted material was eliminated by 3 cycles of dialysis each against 100 sample volumes of 20 mM Tris-HCl pH 8.0, 150 mM NaCl at 4 ºC. Purified material was analysed by SDS-PAGE and by activity assays (see section 2.14 and 2.15) before the second purification step. The dialysed material was diluted 10 times with 20 mM Tris-HCl pH 8.0 and applied to a MonoQ column (5 x 50 mm) (Amersham) pre-equilibrated with at least 5 column volumes of the same buffer. The column was washed with 10 column volumes of 20 mM Tris-HCl pH 8.0, and bound proteins were eluted with a linear gradient from 0 to 1.0 M NaCl in the same buffer. The