JOSÉ MANUEL
SANTOS PEREIRA
OTIMIZAÇÃO
COMPUTACIONAL
DE
BIO-ADSORVENTES
PARA
A
REMOÇÃO
DE
FÁRMACOS DA ÁGUA
COMPUTATIONAL
OPTIMIZATION
OF
BIO-ADSORBENTS
FOR
THE
REMOVAL
OF
JOSÉ MANUEL
SANTOS PEREIRA
OTIMIZAÇÃO
COMPUTACIONAL
DE
BIO-ADSORVENTES
PARA
A
REMOÇÃO
DE
FÁRMACOS DA ÁGUA
COMPUTATIONAL
OPTIMIZATION
OF
BIO-ADSORBENTS
FOR
THE
REMOVAL
OF
PHARMACEUTICALS FROM WATER
Dissertação apresentada à Universidade de Aveiro para cumprimento dos requisitos necessários à obtenção do grau de Mestre em Biotecnologia Industrial e Ambiental, realizada sob a orientação científica do Doutor Sérgio Miguel Fernandes dos Santos, Investigador do Departamento de Química da Universidade de Aveiro, e da Doutora Vânia Maria Amaro Calisto, Estagiária de Pós-doutoramento do Departamento de Química da Universidade de Aveiro.
Apoio financeiro da FCT e COMPETE2020 no âmbito do projeto de investigação PTDC/AAG-TEC/1762/2014
o júri
presidente Doutora Mara Guadalupe Freire Martins
Investigadora Coordenadora do Departamento de Química da Universidade de Aveiro
Doutor Jorge Manuel Campos Marques
Professor Auxiliar do Departamento de Química/Faculdade de Ciências e Tecnologia da Universidade de Coimbra
Doutor Sérgio Miguel Fernandes dos Santos
Investigador Auxiliar do Departamento de Química da Universidade de Aveiro
agradecimentos Gostaria de agradecer a todos os que de uma forma ou outra contribuíram não só para ao desenvolvimento desta tese de mestrado como também para o meu próprio desenvolvimento pessoal ao longo deste ano.
Um agradecimento especial aos meus orientadores Sérgio e Vânia pela paciência e ajuda incansável.
palavras-chave Adsorção; Carvões Ativados; Fármacos; Tratamento de água; Sustentabilidade; Química Computacional, Dinâmica Molecular, Monte Carlo;
resumo Os fármacos estão entre os contaminantes aquáticos mais persistentes, resistindo aos processos convencionais aplicados nas estações de tratamento de águas residuais (ETAR) e, muitos deles, representam uma ameaça séria para organismos não-alvo e para o meio ambiente. Neste contexto, a adsorção a carvões ativados (CA) é uma das mais promissoras metodologias para a remoção de fármacos da água dada a sua versatilidade e alta eficiência de remoção. Contudo, os CAs implicam custos elevados. A lama primária da resultante do tratamento de efluentes da indústria papeleira foi anteriormente apresentada como uma potencial fonte de carbono alternativa e barata para a produção de CA por pirólise.
A química computacional pode ser uma ferramenta valiosa na elucidação de alguns aspetos do mecanismo molecular de adsorção de poluentes orgânicos a CAs. No presente trabalho, é proposta a utilização de lama primária da indústria papeleira para a produção carvões (não)ativados. Os diferentes materiais foram caracterizados por um conjunto de técnicas experimentais, e os dados adquiridos usados na formulação de um modelo computacional válido, na tentativa de reproduzir a variabilidade do CA em termos de composição elementar, grupos funcionais e porosidade. O modelo desenvolvido foi usado na obtenção de informação pertinente através de técnicas de dinâmica molecular/Monte Carlo que possibilite o melhoramento do CA inicial,
Os resultados adquiridos em simulações Monte Carlo sugerem que CAs com teores de oxigénio superiores apresentam valores de área superficial mais elevados, e, consequentemente, capacidades máximas de adsorção superiores. A presença de iões positivos no meio de adsorção apresenta-se como um fator cooperativo para a adsorção de SMX, dada a formação de complexos CA-Na+ -SMX em dupla camada e estabilização de conformações abertas, tal como demonstrado através de simulações de dinâmica molecular.
keywords Adsorption; Activated carbons; Imerging contaminants; Water treatment; Sustainability; Computational chemistry; Molecular dynamics, Monte Carlo
abstract Pharmaceutically active ingredients are amongst the most persistent wastewater contaminants, resisting to wastewater treatment plants (WWTP) conventional processes, and some of them are proved to pose serious threats to organisms and the environment. In this context, adsorption by activated carbons (AC) is one of the most promising methodologies for the removal of pharmaceuticals from water due to its versatility and high removal efficiency. However, ACs are expensive and therefore now widely applied. Primary sludge from paper mills has been previously appointed as a potential cheap and renewable source of carbon for activated carbon production by pyrolysis.
Computational chemistry may help shed some light unto the molecular mechanisms underlying the adsorption of organic pollutants in ACs. In this work, it is proposed the usage of primary paper mill sludge in the production of (non)activated carbons. The different materials were characterized by a set of techniques and the gathered data was used in the formulation of a validated model in an attempt to reproduce the elemental composition, functional group variability and porosity. The developed model was used in order to collect relevant information through molecular dynamics/Monte Carlo techniques, enabling the improvement of the initial AC material.
The obtained data in Monte Carlo simulations suggest that AC with higher oxygen levels present greater values of surface are, and consequently superior maximum capacity values. The presence of positive ions in the adsorption medium presents itself as a cooperative factor for SMX adsorption, given the formation of AC-Na+-SMX complexes and the estabilization of open configurations, such as demonstrated in molecular dynamics simulations.
Chapter 1: Introduction ... 1
1.1) The prevailing issue of water contamination ... 3
1.2) Activated Carbons: a solution to pharmaceutical contamination of water ... 8
1.3) Harnessing the potential of paper mill primary sludge as feedstock for activated carbon production ... 13
1.4) Computational chemistry as a powerful tool to understand adsorption mechanisms ... 16
1.5) Present work objectives ... 19
Chapter 2: Materials and methods ... 21
2.1) Production of carbon materials... 23
2.2) Characterization of carbon materials ... 24
2.2.1) Point of zero charge (PZC) determination ... 24
2.2.2) Fourier transform infrared spectroscopy with attenuated total reflectance (FTIR-ATR) ... 24
2.2.3) Transmission electron microscopy (TEM) ... 24
2.2.4) Scanning electron microscopy (SEM) and Energy-dispersive X-ray spectroscopy (EDS) ... 24
2.2.5) Total organic carbon (TOC) content ...25
2.2.6) Proximate and ultimate analysis ...25
2.2.7) Specific surface area (SBET) ...25
2.2.8) X-Ray Photoelectron Spectroscopy (XPS) ... 26
2.3) Computational modelling approaches ... 27
2.3.1) Carbon model development ... 27
2.3.2) Pharmaceutical molecules parametrization ... 29
2.3.3) Molecular dynamics simulations ... 30
2.3.5) Monte Carlo surface area determination ... 32
2.3.6) Visualization methods... 32
Chapter 3: Results and discussion ... 33
3.1) Carbon materials production ... 35
3.2) Carbon materials characterization ... 36
3.2.1) Fourier transform infrared spectroscopy with attenuated total reflectance (FTIR-ATR) ... 36
3.2.2) Point of zero charge (PZC) determination ... 37
3.2.3) Transmission electron microscopy (TEM) ...38
3.2.4) Scanning electron microscopy (SEM) and Energy-dispersive X-ray spectroscopy (EDS) ... 40
3.2.5) Total organic carbon (TOC) content ... 42
2.3.6) Proximate and ultimate analysis ...43
2.3.7) Specific surface area (SBET) ... 44
2.3.8) X-Ray Photoelectron Spectroscopy (XPS) ... 46
3.2) Carbon model development ... 48
2.3.1) Residue library assembly ... 48
2.3.2) Carbon model production and characterization ... 50
2.3.3) Pore study ... 54
2.3.4) Dipole moment visualization ... 55
2.3.4) GCMC essays ... 56
2.3.5) Molecular dynamics ... 59
Chapter 4: Conclusion ... 62
AC Activated carbon
APBS Adaptive Poisson-Botlzmann Solver
C Competitive adsorption
CA Chemical activation
CBZ Carbamazepine
D Average pore diameter
DFT Density Functional Theory
EDS Energy-dispersive X-ray spectroscopy
EQS Environmental Quality Standards
FTIR-ATR Attenuated total reflection Fourier-transform infrared spectroscopy
GAC Granular activated carbon
GAFF Generalized Amber Force Field
GCMC Grand Canonical Monte Carlo
IC Inorganic carbon
LINCS Linear constraint solver
MC Monte Carlo
MD Molecular Dynamics
OC Organic carbon
PA Physical activation
PAC Powdered activated carbon
PBC Periodic boundary conditions
PC Critic pressure
PS Primary sludge
PZC Point of zero charge
RESP Restrained electrostatic potential
SBET Surface area
SC Single component adsorption
SEM Scanning electron microscopy
SMX Sulfamethoxazole
TC Total carbon
TEM Transmission electron microscopy
TGA Thermogravimetric analysis
TOC Total organic carbon
TP Transformation product
VP Total pore volume
VPC Virtual porous carbon
ω Acentric factor
W0 Total micropore volume
WWTP Wastewater treatment plant
XPS X-Ray photoelectron spectroscopy
Illustration index
Fig. 1. Main routes of pharmaceutical contamination of the environment ... 3
Fig. 2. Sulfamethoxazole and carbamazepine structural changes based on pH ... 6
Fig. 3. Standard activated carbon production methods ... 10
Fig. 4. Main forms of activated carbons distribution ... 11
Fig. 5. Schematic representation of primary sludge origin ... 14
Fig. 6. Activated carbon model examples ... 17
Fig. 7. Proposed work map... 19
Fig. 8. Multi conformational analysis results ... 29
Fig. 9. System preparation for molecular dynamics simulations ... 30
Fig. 10. Production step yield % (m/m) for different carbon material samples ... 35
Fig. 11. FTIR-ATR spectra of the precursor and different carbon materials ... 37
Fig. 12. PZC determination for each carbon ...38
Fig. 13. Transmission electron microscopy images ... 39
Fig. 14. Scanning electron microscopy images ... 40
Fig. 15. Energy-dispersive X-ray spectroscopy spectra ... 41
Fig. 16. OC and IC content in PS and the produced carbon materials ... 42
Fig. 20. Schematic representation of the proposed functional groups ... 47
Fig. 21. Non-minimized residue example from one of the created libraries ... 49
Fig. 22. Non-minimized residues from different libraries ... 49
Fig. 23. Clustering process ... 50
Fig. 24. Visual representation of different instances of the proposed AC model ... 51
Fig. 25. Surface area evolution with oxygen content ...52
Fig. 26. Elemental and functional content comparison ...52
Fig. 27. Micropore structures in the proposed models ... 54
Fig. 28. Electrostatic potential maps ... 55
Fig. 29. Electrostatic potential map of the resulting AC model ... 55
Fig. 30. GCMC adsorption results for different AC models ... 56
Fig. 31. Adsorption capacity and surface area evolution ... 57
Fig. 32. GCMC adsorption results for different AC models (in presence of Na+) ... 58
Fig. 33. Adsorption capacity and surface area evolution (in presence of Na+) ... 59
Fig. 34. Adsorbed CBZ in fullOx model ... 60
Fig. 35. Different configurations of SMX on a single microcrystallite ... 60
Fig. 36. Na+ and SMX complexes with AC charged groups ... 61
Fig. 37. Competitive adsorption interaction between SMX and CBZ ... 61
Table index
Table 1. Characteristics of pharmaceutical compounds studied ... 5Table 2. Carbamazepine and Sulfamethoxazole concentrations in WWTP ... 7
Table 3. Water treatment processes efficacy in pharmaceutical removal ... 8
Table 4. Alternative renewable sources of cellulosic precursors... 13
Table 5. Sample preparation guide ... 23
Table 6. Critical properties and acentric factors calculated ... 31
Table 7 - Textural parameters of characterized carbon materials... 45
Introduction
“The leaves, by themselves, are no more than trivial fluttering
decoration. It is the trunk and limbs that give the tree its grandeur and
the leaves themselves their meaning. There is not a discovery in science,
however revolutionary, however sparkling with insight, that does not
arise out of what went before. 'If I have seen further than other men,' said
Isaac Newton, 'it is because I have stood on the shoulders of giants.”
- Isaac Asimov, Adding a Dimension: Seventeen Essays on the
History of Science, 1964
1
C
h
a
p
t
e
r
1.1) The prevailing issue of water contamination
______________________________________
Both humans and animals have greatly benefited from the last century advances in medicine. However, the consistent increase in drug production, consumption and disregarded disposal poses severe threats to human health and non-target organisms and is a serious cause of environmental damage (1,2). This steady increase in consumption during the last decades can be ascribed to several factors, such as the discovery of new drugs, increase in population and industrialization levels, demographic ageing and expiration of patents resulting in an increase of low-cost generics production (3). As an example, China’s pharmaceutical compound production has tripled from 2003 to 2011, accounting for over 20% of the total global production (4), and global consumption rates of antibiotics has increased by over 30% in the last decade (5).
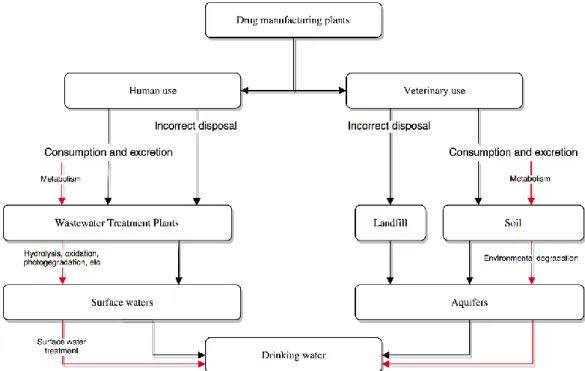
Over 200 pharmaceutically active compounds have been identified in the environment, with concentrations ranging from a few nanograms per liter to a thousand micrograms per liter (3,6). Such pharmaceuticals, mainly antibiotics, painkillers, vascular drugs and antidepressants (7), find their way into the ecosystem through several routes, as described in Fig. 1 (8).
Fig. 1. Main routes of pharmaceutical contamination of the environment. Pharmaceutical transformation products origin and propagation routes are schematically represented in red.
Wastewater treatment plants (WWTP) receive contaminated effluents from drug manufacturing plants and municipal sewage systems. After administration, pharmaceuticals are metabolized and excreted by the treated organism. While human used pharmaceuticals often find their way to a WWTP, pharmaceuticals used in veterinary applications such as with domestic pets and livestock are directly delivered to the soil where, through infiltration, are lead to aquifers and groundwater systems. Also, aquaculture derived residues are delivered directly to the water. Incorrect disposal of pharmaceuticals also contributes to the contamination of aquifers, directly or through landfill leakage, even though the major cause for environmental contamination resides on WWTP effluent discharges (9,10). It has been reported that about 64% of these emerging contaminants are only partially removed (< 50%), while up to 9% are not removed at all by the standard treatment processes in WWTPs (11).
Furthermore, pharmaceutical transformation products (TPs) are produced by a variety of processes (12):
Metabolism - as an example, 26% of the administrated ibuprofen, a
common pharmaceutical used in inflammatory diseases, pain,
dysmenorrhea, or fever, is excreted in the form of hydroxy-ibuprofen, a
TP generally considered more toxic to the aquatic life forms than the
parent compound (5,13);
Wastewater treatment processes (such as hydrolysis, oxidation,
photodegradation, among others);
Digestion by microbial activity and other natural processes in the
environment;
Treatment processes for surface water.
Some TPs have been identified as being more ecotoxic than the parent compound, or as having synergetic and additive effects while in mixture (14). This is the case of acridine, a photodegradation product of carbamazepine (CBZ) regarded as mutagenic and carcinogenic (15).
Even though the concentration of therapeutic compounds in the water supply are below the minimum levels for human consumption concern in terms of an acute response, the presence of this type of pollutants still pose a series of risks (16–18):
Environmental damage to non-target organisms;
Biomagnification through the food-chain;
Long-term/sub-therapeutic exposure to both individual compounds and
mixtures;
Release of antibiotics to the ecosystem acts as a selection force that can
lead to the development of antibiotic resistant pathogens;
Different dose sensitivity in the young, elderly or pregnant are not studied.
For this reasons, some pharmaceutical compounds are now regarded as priority substances in the field of water policy according to European directives (19). Within the scope of the present work, sulfamethoxazole (SMX) and CBZ, two pharmaceutical compounds frequently found in the environment (20–22), are proposed as target active agents for adsorption, whose details are expressed in Table 1 (23–27).Table 1. Characteristics of pharmaceutical compounds studied
SMX CBZ
Chemical formula C10H11N3O3S C15H12N2O Molecular weight (g mol-1) 253.3 236.3
Water solubility (mg L-1) 610 (37ºC); < 100 (20ºC) 17.7 (25ºC)
Hydrogen bond acceptor 4 1
Hydrogen bond donor 2 1
Polar surface area (Å) 98.22 46.33
VdW volume (Å3) 204.70 210.15 Number of rings 2 3 pKa 1.97; 6.16 2.3; 13.9 EQSa (µg L-1) Acute: 2.7 Chronic: 0.6 Acute: 2000 Chronic: 2
The structure of both pharmaceuticals is schematically represented in Fig. 2, as
well as structural changes based on pH of the medium. An overview of CBZ and SMX
concetrations in effluents of various WWTPs can be found in Table 2 (28–36).
Fig. 2. Sulfamethoxazole (left) and carbamazepine (right) structural changes based on pH. Red circles highlight the structural group who suffered deprotonation with the pH increase.
SMX is an antibiotic extensively used in the control of human or animal urinary,
respiratory and gastrointestinal infections, and it is estimated that 10% to 30% is excreted
by urine in the original active form (37,38). It is highly persistent to biological
degradation in common wastewater treatment processes: maximum concentrations of
4.46 µg L
-1(Germany) have been measured in WWTP effluents, over double of the
environmental quality standards (EQS) proposed by Oekotoxzentrum (2016) for chronic
effects (24). In the case of SMX, bacterial resistance dissemination is a major concern,
and therefore additional cautionary measures should be taken, in order to improve the
removal rate of this antibiotic from water, especially considering that some of its
metabolites are more ecologically toxic than the parent compound (39).
Table 2. Carbamazepine and Sulfamethoxazole concentrations in WWTP effluents around the world
CBZ is generally applied on the treatment of seizures, neuropathic pain, and second-line medication of bipolar disorders and some cases of schizophrenia (40). As one of the most frequently detected pharmaceutical in wastewater (41), this compound is highly recalcitrant to standard wastewater treatments, and poses serious risks to the environment and human health (42–44). It has been detected in WWTP effluents with maximum concentrations as high as 6.30 µg L-1 (Germany), over triple the EQS for chronic effects (2 µg L-1) proposed (24). In previous studies, it has been shown that some photodegradation products of CBZ (acridine and acridone) are even more toxic than the parent compound (45).
For these reasons, removal of SMX and CBZ from water without the risk of
developing dangerous degradation products becomes imperative.
Country
WWTP effluent (ng L
-1)
CBZ
SMX
Germany
< 6300
300 – 2460
France
980 – 1200
70 – 90
Belgium
< 1200
-
Italy
300 – 500
10 – 30
Spain
< 1290
-
Greece
1030
90
Norway
< 3400
-
Sweden
< 1180
< 200
USA
110 – 190
79 – 2200
Japan
18 - 86
10 - 76
UK
230 – 1060
< 50
1.2) Activated Carbons: a solution to
pharmaceutical contamination of water
______________________________________
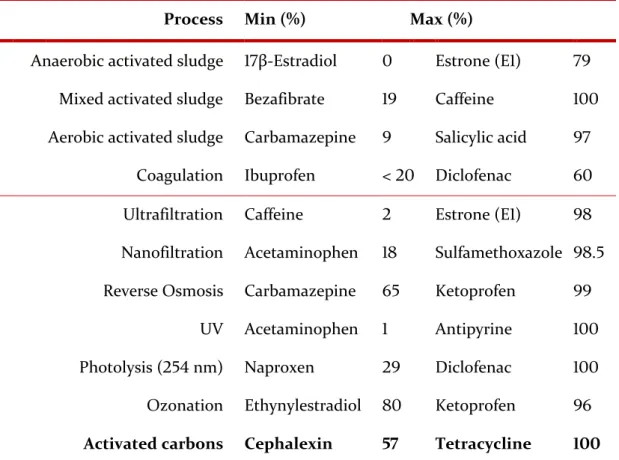
Currently, wastewater treatments consist mainly of two classes of methods: on one hand, conventional methods, such as flocculation, filtration and biodegradation, are mainly ineffective on the removal of persistent organic compounds. On the other hand, chlorination, oxidation by ozone and ion exchange resins are examples of advanced methods that although having better efficiencies for the removal of pharmaceuticals, may generate transformation products that are even more dangerous to the environment and are generally more expensive to employ in standard WWTPs (26,46). In this context, over the last decade, some research has been undertaken in order to quantify the efficiency of pharmaceutical removal by standard and advanced water treatment processes currently employed, as stated in Table 3.
Table 3. Water treatment processes efficacy in pharmaceutical removal – adapted from (47–49)
Process Min (%) Max (%)
Co n ve n tio n al
Anaerobic activated sludge 17β-Estradiol 0 Estrone (E1) 79 Mixed activated sludge Bezafibrate 19 Caffeine 100 Aerobic activated sludge Carbamazepine 9 Salicylic acid 97
Coagulation Ibuprofen < 20 Diclofenac 60
Adv
an
ced
Ultrafiltration Caffeine 2 Estrone (E1) 98 Nanofiltration Acetaminophen 18 Sulfamethoxazole 98.5 Reverse Osmosis Carbamazepine 65 Ketoprofen 99
UV Acetaminophen 1 Antipyrine 100 Photolysis (254 nm) Naproxen 29 Diclofenac 100 Ozonation Ethynylestradiol 80 Ketoprofen 96 Activated carbons Cephalexin 57 Tetracycline 100
As for conventional processes, coagulation treatments were mostly ineffective in pharmaceutical removal. Although activated sludge processes can achieve significant removal rates (79% to 100% of maximum removal), these values can vary immensely due to factors such as tank temperature, hydraulic retention time and sludge age, among others. This unpredictability of results can pose a liability. Furthermore, the optimization of such factors for removal of therapeutic compounds may lead to lower removal rates of other contaminants, such as pathogenic microbial agents, and therefore priority guidelines should not be overridden (17).
Advanced wastewater treatments such as membrane filtration or ozonation allow higher removal rates of pharmaceuticals from wastewater (99% and 96% of maximum removal efficiency, respectively), but require an intensive capital investment when compared to standard practices, and therefore are not employed to a meaningful extent. UV treatments, as well as photolysis and ozonation can produce TPs and should be applied with caution. Moreover, ultraviolet radiation presents a fluctuating range of removal rates (1-100%), and can be, therefore, unreliable in industrial scale applications (17,50).
In this context, adsorption of contaminants by activated carbons (AC) emerges as an optimistic solution, with advantages such as versatile usage and high removal efficiencies and the ability to regenerate and reuse spent adsorbents (51), even though it is still not widely used because of its high-cost (52) and the fact that it doesn’t mineralize the contaminants (49). Current estimations place the world’s demand for AC around 1.1 million tons per year, and it is expected to grow at a rate of over 10% per year until at least the 2020’s (53). AC are carbon-rich materials with a porous structure, that can be activated by thermal/physical and/or chemical processes in order to increase internal superficial area and therefore, adsorption capacity (54). AC applications vary, including adsorption of industrial pollutants, heavy metals, organic and inorganic compounds, microorganisms, as well as energy storage (55).
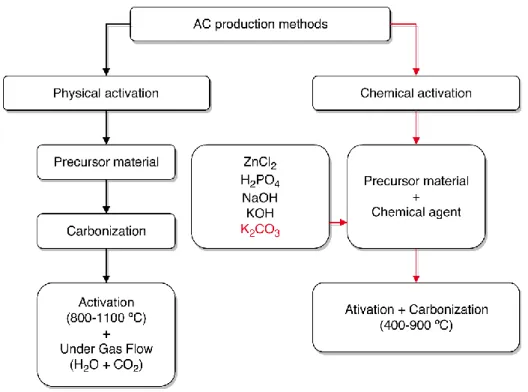
Regarding AC production processes, Fig. 3 schematizes two routes to achieve carbonization and activation of precursor materials. Through physical processes, the starting material is firstly carbonized, and then suffers activation under an oxidizing gas flow such as water vapor (H2O), carbon dioxide (CO2), or a mixture of both, at high temperatures (800 to 1100 ºC) (56,57), whereas in common chemical activation there is carbonization and activation of the initial material simultaneously when impregnated with activating chemical agents at medium-high temperatures (400 – 900 ºC) (55,57,58).
The most common activating agents are zinc chlorine (ZnCl2), di-hydrogen phosphate (H2PO4-), sodium hydroxide (NaOH), potassium hydroxide (KOH) and potassium carbonate (K2CO3). Chemical activation has shown some benefits over physical processes, such as higher yields, inferior pyrolysis temperatures, and the fact that it generally produces AC with highly developed micro porosity, higher surface area (600 to 2000 m2 g-1) and reduced mineral matter content (20). However, chemical activation is commonly more expensive, deals with corrosive substances and requires an extra washing step (59). Although a considerable number of different attributes need to be analyzed in order to fully characterize an AC, the specific surface area (SBET) and average pore diameter (D) are some of the significant influential factors and the most commonly found attributes described in the available literature (21).
Fig. 3. Standard activated carbon production methods. The proposed method for the present work is illustrated in red.
Washing is often required in order to remove impurities originated by the chemical
activation process, usually with water or an acid chemical agent such as hydrochloric acid
(HCl) (60). Carbonization using high-power microwaves (1200 W) instead of nitrogen
(N
2) purged muffles has been discussed, with proposed advantages such as shorter
On the subject of activation agent selection, K
2CO
3emerges as a promising
choice, based on its environmental advantages, such as avoiding eutrophication problems
associated with phosphate use (61) and not being corrosive of hazardous as some
alkalimetal hydroxides (62). Also, in previous studies, K
2CO
3activation resulted in AC
with high specific surface areas. For instance, by using industrial pre-treated cork, a S
BETof 907 m
2g
-1was achieved (63), when testing AC production from sisal waste a S
BETof
1038 m
2g
-1was obtained (64), cornstalk lignin based AC showed a S
BETof 1410 m
2g
-1(61) and when using chitosan as feedstock, AC showed a S
BETof 2130 m
2g
-1, although
with a larger percentage of mesopores (65). Although the activation method is not
thoroughly studied, it is believed that activating agents containing potassium improve the
microporous nature of the feedstock material by intercalation of the metal with the
carbonaceous structure and acting as a cast during pyrolysis (62,66,67).
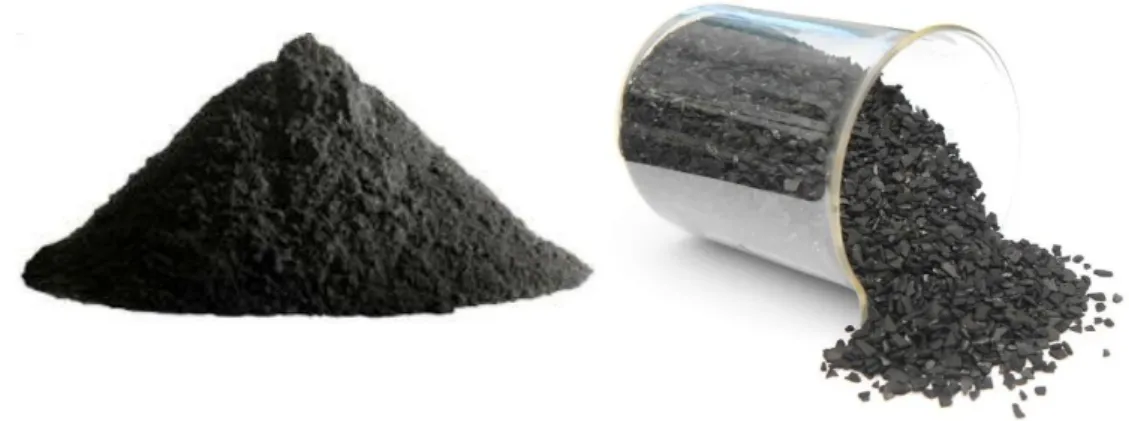
Commercially available AC are commonly produced from fossil fuels such as
petroleum or bituminous coal and mainly distributed in two forms: powdered activated
carbons (PAC) and granular activated carbons (GAC), illustrated in Fig. 4. Both were
shown to have consistent removal rates of over 90% for more than 25 types of
pharmaceutical agents. Usually, PAC is continuously fed into the treatment reactors as a
new product, while GAC can be regularly regenerated (68). Some other unusual forms of
distribution include fibers, cloths, nanotubes or pellets (55). Since AC removal from the
reaction medium after adsorption can be troublesome, studies using magnetized AC for
magnetic removal were carried, showing promising results (69).
Regarding pharmaceuticals adsorption, AC efficiency greatly depends on the
target molecule chemistry, given that adsorption is generally governed by
hydrophobic/hydrophilic interactions, non-covalent attractions (π-π stacking) and
electrostatic attraction/repulsion based on the surface functional groups of the carbon. It
was previously reported that PAC DETOX 1600, a commercially available AC, presented
removal rates of 92%, 76% and 73% towards Triclosan, Metoprolol and Trimethoprim,
while only removing 9%, 3% and 1% of Acetaminophen, Caffeine and Ibuprofen, where
the authors point electrostatic interactions, chemical bounding and other non-specific
forced as the main agents in the adsorption process. This lower removal rates were
improved by combining AC adsorption with ultrafiltration, reaching removal rates of over
90% towards all pharmaceutical compounds (70).
Given the presence of functional groups on the AC surface, previous works
demonstrated the influence of pH on removal rates of pharmaceuticals and regeneration
capacity of AC. Results regarding the adsorption of pramipexole dihydrochloride (PD), a
popaminergic antiparkinsonism agent, and dorzolamide (D), an ophthalmic glaucoma
agent, using AC derived from potato peels, showed that adsorption was favored by lower
pH (around 2), (61% maximum removal rate of PD and 55% removal rate of D), while
regeneration of the used AC was favored by higher pH (around 10). (71). A different
study showed similar results, where the adsorption of ceftazidime was favored at low pH.
This effect was attenuated by the impregnation of the AC with metals such as iron,
aluminum and copper (4). In opposition, alanine adsorption by commercially available
AC was shown to be favored by basic pH (above 8) and low content of oxygen (72),
revealing that the protuberant adsorption mechanism is dependent on the target molecule
chemistry.
Therefore, two main characteristics in the adsorbent are of importance: the
superficial area/pore development and surface chemistry (26).
1.3) Harnessing the potential of paper mill primary
sludge as feedstock for activated carbon production
______________________________________
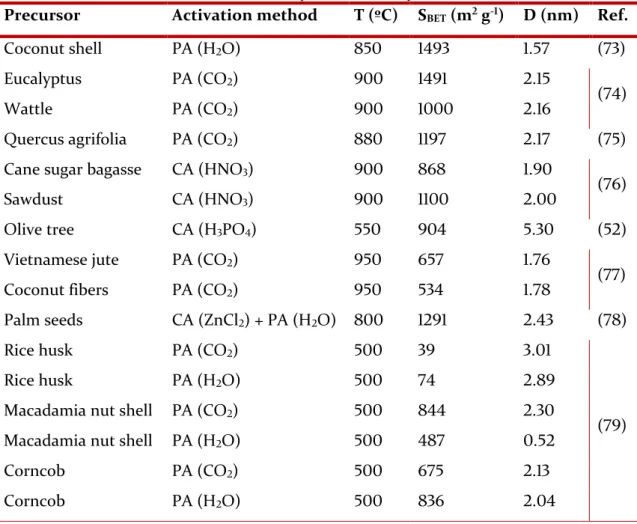
Currently, AC are primarily derived from fossil fuels hydrocarbons resulting from the heavy fractions of petroleum and coal or expensive lignocellulosic materials, so its use is therefore restricted by cost and availability, as well as environmental concerns regarding particulate matter generation or heavy metal contamination during carbonization processes, as well as extensive exploration of natural resources (51,56,57). As summarized in Table 4, abounding alternative renewable sources of cellulosic precursors have been proposed and studied as alternative precursors for AC production, either by physical activation (PA) or chemical activation (CA).
Table 4. Alternative renewable sources of cellulosic precursors for AC production
Precursor Activation method T (ºC) SBET (m2 g-1) D (nm) Ref.
Coconut shell PA (H2O) 850 1493 1.57 (73)
Eucalyptus PA (CO2) 900 1491 2.15
(74)
Wattle PA (CO2) 900 1000 2.16
Quercus agrifolia PA (CO2) 880 1197 2.17 (75)
Cane sugar bagasse CA (HNO3) 900 868 1.90
(76)
Sawdust CA (HNO3) 900 1100 2.00
Olive tree CA (H3PO4) 550 904 5.30 (52)
Vietnamese jute PA (CO2) 950 657 1.76
(77)
Coconut fibers PA (CO2) 950 534 1.78
Palm seeds CA (ZnCl2) + PA (H2O) 800 1291 2.43 (78)
Rice husk PA (CO2) 500 39 3.01
(79)
Rice husk PA (H2O) 500 74 2.89
Macadamia nut shell PA (CO2) 500 844 2.30
Macadamia nut shell PA (H2O) 500 487 0.52
Corncob PA (CO2) 500 675 2.13
Corncob PA (H2O) 500 836 2.04
T - Temperature
SBET – Surface area
Regarding average pore diameter (D), it’s possible to infer that such values usually prevail between 1.5 and 3.0 nm. IUPAC recommendations define a micropore as being a pore with a diameter of less than 2 nm (80).
Besides agricultural precursors, some industrial wastes have been studied as
potential feedstock for AC production. Primary paper mill sludge (PS) is the result of
primary treatment of paper mill effluents, as described in Fig. 5. This material mainly
consists of wood fibers and organic matter such as amino acids, polycyclic aromatic
hydrocarbons, heterocyclic compounds and organofluoride compounds (81,82).
Fig. 5. Schematic representation of primary sludge origin in paper mill effluent treatment processes, highlighted in red
Pulp and paper mills around the globe produce large amounts of PS: USA, Japan,
China, Europe and South Africa together produce nearly 30 million tons per year (83).
For comparison, in North America, 4 kg of sludge is produced for every 100 kg of paper
(84). Furthermore, disposal of PS is currently a major issue. Traditionally, it involves
landfilling or energy production though incineration/combustion. However, such
solutions are rapidly becoming unsustainable based on a number of factors (81,82,84):
Water removal from crude PS in order to meet landfill standards, as well as
transportation to the landfill, is economically suboptimal;
Leachate production in landfills constitutes a ground water pollution source;
Progressively stringent measures have been employed regarding landfill space
depletion;
Given the high water content of untreated PS, energy production is far from
ideal due to energy loss to water evaporation;
Combustion of PS, if improperly handled, may cause atmospheric pollution
due to NO
X, SO
Xand suspension dust emissions;
Given its abundance and sizable content in carbon, PS has been proposed as a feedstock for AC production (26,46,85–89), after showing interesting results for the production of non-activated carbons, and therefore acting as a starting point for the study of AC production. When compared to commercial ACs, alternative adsorbents generated from PS showed faster adsorption kinetics, comparable SBET and higher adsorption capacity, especially when considering samples activated with ZnCl2. Another study using PS as a starting point for AC production showed that further biological activation with Pseudomonas putida resulted in an increase from 65% removal rate of phenol to 97% (90). These results further substantiate the notion that AC generated from PS material is a versatile and competitive option to common AC.
1.4) Computational chemistry as a powerful tool to
understand adsorption mechanisms
______________________________________
Despite being thoroughly studied, the adsorption process at the molecular level in AC remains shrouded and constitutes a point of divergence in the scientific community. For example, disparity in theories regarding the primary adsorption principle exists, where some studies point functional group interactions as the main force guiding molecular adsorption, while others assign it to microporous structure and specific surface areas (77). Therefore, deeper insights into the interactions between adsorbates and the AC are necessary. This would allow the modulation of the AC characteristics in order to increase adsorption capacities and rates or target compound selectivity.
Computational chemistry harnesses the power of generalized and readily available computers use to simulate dynamic aspects of molecular systems (91) by molecular dynamics (MD) and/or Monte Carlo (MC) simulations. Citing Tamar Schlick (92):
“MD is the science of simulating motion of a system of particles according to
Newton’s classical equations of motion.”
In other words, MD allows the study of molecules movement in detail, bridging molecule structure to function. Besides molecular dynamics techniques, MC approaches became a standard practice in adsorption simulations (93). Grand Canonical Monte Carlo (GCMC) is highlighted among the several ensembles proposed. In this technique, the chemical potential, volume and temperature of the system are fixed, leaving the pressure/concentration of the species involved as the sole parameter contributing for the addition/deletion of molecules in the system (94). This ensemble allows for an easy definition of adsorption isotherms and helps to highlight competition effects, such as co-adsorption (95).
Several models for AC have been previously proposed as schematically shown in Fig. 6. Structureless models use a continuous surface without isolated atoms (96). Slit pore models assumes an array of semi-infinite and rigid carbon walls at a given distance (pore size) (96). They are often decorated with functional groups to study their influence in a simple manner. Both approaches try to simplify the carbon material surface and often fail
to account for more complex situations, such as pore architecture or edge effects. Mimetic models try to imitate the synthesis process, through techniques such as Reverse Monte Carlo, template mesoporous structures or quenching (94). This results in more complex models that more closely mimic the structure of real ACs, but often lack experimental characteristics and uniqueness between different instances of the same model, and are computationally expensive to generate (97). Finally, we have the reconstruction models: these models often use data from experimental characterization techniques to build the model of the AC. A common approach is the usage of microcrystallites: graphitic structures with less than 5 nm in diameter, comprised of stacked carbon layers and based on experimental observations, as to create a virtual porous carbon (VPC) models. The spatial orientation and stacking of this building blocks in 3D space creates pores that give the VPC’s their characteristic high surface area (98).
Fig. 6. Activated carbon model examples. The proposed model type for the present work is highlighted in red.
The VPC reconstruction method has been explored in previous works, since the first proposed model by Segarra and Glandt in 1994 (99). For this reason, the VPC models are sometimes referred to as SG models. Platelets with an homogeneous size and nature were used, without explicit atoms described, in a very simple fashion. Several authors upgraded this initial model in order to define more complex behaviors. Some works of interested are highlighted below.
Liu et al. (100) explored the usage of the VPC reconstruction method in order to study the adsorption of water in AC’s, using GCMC. The results show that the created model is in accordance to experimental data in terms of isotherm shape, further validating the VPC model.
Di Biase et al. (101) used simple fullerene-like molecules packed in a simulation box, where the density was tuned in order to achieve the desired surface area of the resulting material. Some platelets were further adorned with hydroxyl (-OH) or carboxyl (-COOH) to study the effect of oxygen concentration and nature. GCMC was then employed to develop adsorption isotherms of CH4 and CO2 in gaseous phase. The results show good agreement with experimental data. Oxygen groups in the carbon surface increased CO2 adsorbance, with the nature of the oxygen groups not being relevant.
Gonciaruk et al. (102) followed a similar strategy, but introduced the use of different types of platelets, with varying sizes. However, the resulting AC model surface area was not explicitly defined, and resulted from natural microcrystallite packaging. This packaging resulted in a porous structure with surface areas between 175 and 500 m2 g-1. Although these values are lower than expected, the proposed model was not optimized based on any experimental data. GCMC was then used to study CO2 and CH4 adsorption, with appropriate similarity to experimental results.
More recently, Bahamon et al. (95) further explored the usage of VPC models, with the addition of more complex molecules as targets for adsorption (ibuprofen, in this example, is one of the few studies performed with organic contaminants). The used AC model included different sized platelets, defects and oxygenated groups (hydroxyl, pyran, carboxyl and carbonyl). Finally, ibuprofen adsorption from an ibuprofen/water mixture was simulated using GCMC. Results are in general accordance with experimental results available in literature, since the defined model was not optimized in accordance to any specific AC sample in a quantitative manner, being a pure qualitative behavior study.
1.5) Present work objectives
______________________________________
The possibility to adapt the existing computational models in a quantitative manner to a real sample of AC naturally emerges as an interesting development in the field of AC modelling and as a tool for designing improvements in AC production. Such study would allow the modulation of the characteristics of AC to improve adsorption rate, capacity or selectivity towards certain target molecules. This objective requires substantial characterization of real AC sample in terms of surface area, elemental constitution, charge, particle size and functional group composition. Characterization of the feedstock and carbon materials of intermediary steps allow a broader overview of the process.
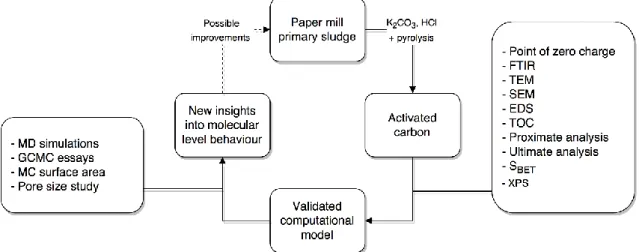
As previously stated, paper mill PS showed promising results when used as feedstock for AC production, making it a compelling candidate for the present study. The application of AC in water treatment has showed consistency on obtaining good results when it comes to pharmaceutical adsorption from contaminated water systems, therefore CBZ and SMX emerge as interesting adsorption targets. However, questions regarding which properties constitute an efficient adsorbent persist. Therefore, an assortment of computational chemistry strategies is proposed to elucidate molecular behaviors otherwise inaccessible, such as molecular dynamics simulations and GCMC adsorption studies. The development of a unified model which can accurately replicate experimental data is hereby proposed as a step towards a better understanding of the chemistry underlying pharmaceutical adsorption by AC, as schematically represented in Fig. 7.
Hence, the objectives of this work are as follows:
To produce real AC using paper mill PS as feedstock, by chemical activation using
K
2CO
3and HCl washing.
To fully characterize the AC structure and surface chemistry using a battery of
techniques to obtain a set of relevant data:
o Point of Zero Charge (PZC);
o Fourier transform infrared spectroscopy (FTIR);
o Transmission (TEM) and Surface (SEM) Electron Microscopy;
o Energy-dispersive X-ray spectroscopy (EDS);
o Total Organic carbon determination (TOC);
o Proximate and ultimate analysis;
o Specific Surface Area (S
BET);
o X-ray photoelectron spectroscopy (XPS).
To use the gathered experimental data to develop and test a validated model for
AC regarding pore distribution, surface area and superficial functional groups;
To use a validated model for AC in the interest of obtaining pertinent conclusions
regarding molecular behavior in adsorption experiments, resorting to
computational chemistry tools:
o MD simulations;
o GCMC essays;
o MC surface area determination and pore size studies.
To extrapolate the modelled data into factitious models with different
characteristics to study the effect of:
o Oxygen content;
Materials and methods
“The important thing is not to stop questioning. Curiosity has its own
reason for existence. One cannot help but be in awe when he
contemplates the mysteries of eternity, of life, of the marvelous structure
of reality. It is enough if one tries merely to comprehend a little of this
mystery each day.”
- Albert Einstein, LIFE Magazine, 2 May 1955
2
C
h
a
p
t
e
r
2.1) Production of carbon materials
______________________________________
Three different carbon materials were produced using primary paper mill sludge (PS) as a precursor. The sludge was obtained from a Portuguese factory operating an elemental chlorine free kraft process, using Eucalyptus Globulus. PS was dried at 60 ºC in an oven, for 24h and grinded with a blade mill before further treatment. A description of each sample treatment can be found in Table 5.
ACs were produced by chemical activation with potassium carbonate (K2CO3), in a proportion of 1:1 (w/w). The activating agent solution was prepared with the proportion of 50 mL of distilled water (H2Od) to 15g of K2CO3. PS was impregnated during 1h in ultrasounds bath at room temperature. The impregnated PS was left to dry for 7 days on the hotte.
Pyrolysis of PS or impregnated-PS was performed in porcelain crucibles. The pyrolysis was performed in a furnace muffle under inert atmosphere with a nitrogen flow, at 800ºC, heating rate of 10 ºC min-1 and residence time of 150 minutes. Nitrogen flow was maintained during the cooling of the furnace. Samples without further treatment were grinded with a blade mill, and named PS800.
Some samples were subjected to a washing step using HCl in a proportion of 1.2 g of carbon material to 40 mL of 1.2 M HCl (37%, Panreac). The carbon material and the washing solution were kept in contact for 1h. The resulting slurry was vacuum filtered and washed with distilled water until neutral pH of the washing leachate was achieved. The samples were then dried for 7h in an oven at 105 ºC, and subsequently grinded with a blade mill. Such samples were named PS800-HCl and PS800-K2CO3-HCl, the latter having suffered chemical activation.
Table 5. Sample preparation guide
Samples Pyrolysis Washing Activation
PS800
PS800-HCl
2.2) Characterization of carbon materials
______________________________________
2.2.1) Point of zero charge (PZC) determination
PZC was determined by batch equilibration. 2 mg of each carbon sample were shaken in polypropylene tubes with 10 mL of NaCl 0.1 M (≥99.5%, Fluka) solution, for 12h in a overhead shaker at 25ºC, at different pH values. A total of 11 tubes were used from pH values ranging from 2 to 12. Initial pH values were measured and adjusted using 0.1 M and 0.05 M HCl (37%, Panreac), and 0.1 M and 0.05 M NaOH (99.3%, José Manuel Gomes dos Santos, Portugal). The final pH was measured and the PZC was determined by plotting the ∆pH (pHf – pHi) versus the pHi. The PZC is the pH value at which the curve intersects the x-axis. All carbon samples were subjected to this technique, except PS.
2.2.2) Fourier transform infrared spectroscopy with attenuated total reflectance (FTIR-ATR)
FTIR-ATR spectra were obtained using a Shimadzu-IRaffinity-1 spectroscope, with nitrogen purge. The measurements were recorded in the range of 600-4000 cm-1, 4.0 of resolution, 128 scans and with atmosphere and background correction. All carbon samples, including PS, were subjected to this FTIR-ATR analysis.
2.2.3) Transmission electron microscopy (TEM)
TEM images were obtained using a HR-(EF)TEM JEOL 2200FS microscope at the following magnitudes: 5 000x, 20 000x, 50 000x, 80 000x, 100 000x, 150 000x and 200 000x. All carbon samples were subjected to TEM imaging, except PS. Higher magnitudes of 150 000x and 200 000x were only applied in PS800-K2CO3-HCl samples.
2.2.4) Scanning electron microscopy (SEM) and Energy-dispersive X-ray spectroscopy (EDS)
SEM images were obtained at the following magnitudes: 300x, 1 000x, 3 000x, 10 000x, 30 000x and 50 000x, using a Hitachi SU-70. The apparatus was also used to
perform EDS analysis using a Bruker QUANTAX 400. All carbon samples were subjected SEM imaging and EDS, including PS.
2.2.5) Total organic carbon (TOC) content
Total carbon (TC) and inorganic carbon (IC) were determined using a TOC-VCPH Shimadzu analyzer, with a solid sample module SSM-5000A, and the TOC content was obtained by difference. Glucose (C6H12O6, 40% of carbon) was used as standard to establish and test the calibration curve for TC determination, while sodium carbonate (Na2CO3, 11% of carbon) was used as the standard for IC determination. Carbon content of the materials was determined as the average of 3 replicates. All samples, including PS, were subjected to TOC content determination.
2.2.6) Proximate and ultimate analysis
Standard methods to determine the moisture (UNE 32002), volatile matter (UNE 32019) and ash content (UNE 32004) were employed in a LECO TGA-601 automatic analyzer, for proximate analysis. The remaining fraction after ash and volatile matter (at dry basis) was determined to be the fixed carbon content.
Ultimate analysis were performed in a LECO CHNS-932 analyzer, determining the content in carbon (C), hydrogen (H), nitrogen (N) and sulfur (S) in the samples. The difference between the remaining fraction, in dry basis, and the ash percentage was considered to be the oxygen (O) content.
All carbon samples, including PS, were subjected to proximate and ultimate analysis.
2.2.7) Specific surface area (SBET)
Specific surface area (SBET) was determined on a Micromeritics ASAP2420 apparatus using the N2 adsorption isotherm at -196ºC and Brunauer–Emmett–Teller equation in the relative pressure range 0.01–0.1. Degasification process of the sample was carried overnight. Additionally, average pore width and total pore volume were also determined from the amount of nitrogen adsorbed at a relative pressure of 0.99. All carbon samples were subjected to SBET determination, except PS.
2.2.8) X-Ray Photoelectron Spectroscopy (XPS)
Functional group content was determined by XPS analysis. Spectra were acquired in an Ultra High Vacuum system with a base pressure of 2x10⁻¹⁰ mbar located on TEMA, University of Aveiro. The system is equipped with a hemispherical electron energy analyzer (SPECS Phoibos 150), a delay-line detector and a monochromatic AlKα (1486.74 eV) X-ray source. High resolution spectra were recorded at normal emission take-off angle and with a pass-energy of 20 eV, which provides an overall instrumental peak broadening of 0.5 eV. Only PS800-K2CO3-HCl sample was targeted for XPS analysis.
2.3) Computational modelling approaches
______________________________________
2.3.1) Carbon model development
Carbon models were obtained by clustering carbon microcrystallites into a VPC. The carbon material was considered to be a disordered configuration of platelets of different sizes, decorated with specific functional groups, as an extension of the Segarra and Glandt model (103), and more recently, the Bahamon approach (95). Experimental data was considered in order to mimic the real material characteristics, namely the AC surface area, elemental constitution and functional content, having PS800-K2CO3-HCl as a starting point. The applied strategy and resulting AC models are further discussed in detail in chapter 3.
A great deal of attention was given to automation throughout the present work. A series of Python scripts were developed in order to produce the AC model in a reliable and autonomous way, so that replicas could be easily studied. An online repository version of the developed and used scripts during this work can be found at github.com/JosePereiraUA/carbon/. In this context, the following tasks were programmed in the produced scripts:
Carbon residue design, with the following options:
o Size and number of carbon layers;
o Functionalization content, where the following functional groups were
designed: ethers, carbonyls, carboxyls and edge hydrogens;
o Atom charges determination;
o Functional group hydrogenation in accordance to pH;
Residue library construction, with variable number of residues;
Clustering process of residues into AC models, with the following options:
o Atom count limits;
o Charged ions addition;
Atomtypes for all molecules used in the present work, including the carbon models, were extracted from Generalized Amber Force Field (GAFF) forcefield (104), and simplified for this model application. For this matter, non-bonded interactions were considered to be Lennard-Jones pairs, with Lorentz-Berthelot combination rules as defined in GAFF forcefield. Lennard-Jones and electrostatics 1-4 interactions were multiplied by a 0.5 and 0.833 factor, respectively.
For functional group’ partial charge definition, small sets of carbon rings were manually designed using Avogadro 1.1.1 (105), and the different types of functional groups were added separately. The resulting molecules were optimized by Density Functional Theory (DFT) at the B3LYP/6-31G* level using Gaussian09 (106). The minimized structure was then used in the calculation of the electrostatic potential map, at the HF/6-31G* level, from which Restrained Electrostatic Potential (RESP) partial charges were obtained using Antechamber (107).
The obtained partial charges were used in the developed Python script. A functional group was considered as all the heteroatoms involved, the carbon atom where the functional group is attached to (C0) and the neighbor carbon atom connected to C0. All functional groups had a neutral charge: positive charges were dispersed by C0 and neighbor atoms to keep the sum neutral.
2.3.2) Pharmaceutical molecules parametrization
CBZ and SMX molecules were manually designed on a first approach, using Avogadro 1.1.1, and relaxed using GAFF forcefield and Steepest Descent Algorithm.
The resulting molecules were subject to a multi conformational analysis as follows: the molecules were firstly brought up to 1500K in a molecular dynamics simulation in vacuum (translation/rotation around the system center of mass was removed), allowing them to rearrange in conformations with associated energies distinct from the global minimum energy value. Snapshots were gathered every 1 ps, for 2.5 ns, resulting in 2500 different conformations gathered. Each of the resulting frames was minimized, and the resulting conformations were sorted based on the structure energy, where the 20 molecules with the lowest energies were selected for superimposed visualization. As illustrated in Fig. 8, all the resulting conformations were similar.
Fig. 8. Multi conformational analysis results (20 conformations aligned): Left – CBZ shows a rotation center; Right – SMX present rotation to some extent on the CH3 group, but adopts a closed conformation on itself
The conformation with the lowest energy was then further optimized by DFT at the B3LYP/6-31G* level, using Gaussian09 software. The eletrostatic potential map was calculated at the HF/6-31G* level, and partial charges for the pharmaceutical molecules were obtained using RESP method on Antechamber.
2.3.3) Molecular dynamics simulations
Molecular dynamics simulations were performed using the GROMACS software (108), in 125 nm3 cubic boxes (5 nm each side) with periodic boundary conditions (PBC) applied. All simulation stages used: the Verlet cut-off scheme for neighbor searching; particle-mesh Ewald for electrostatics beyond 12 Å cut-off; 12 Å cut-off for van der Waals interactions. Water molecules were modeled according to the TIP3P model (109).
Firstly, pharmaceutical molecules of interest were attempted to be introduced in the system until the requested number was placed or no more available space was identified (100 insertion trials per molecule). Secondly, solvent molecules were added until no more space was free, as described in Fig. 8. Molecular dynamics simulations were split into 5 different stages:
Solvent relaxation: Position restrictions were imposed to carbon and pharmaceutical molecules, in order for the water molecules to adopt a more natural position. Minimization criteria were: Fmax < 10 kJ mol-1 nm-1, 100 000 steps or ∆F lower than machine tolerance;
Minimization: The whole system was energy minimized without restrictions, following the previous criteria;
Heat equilibration: The simulation was brought up to 300K, for 1 to 2 ns, using a Nose-Hoover extended ensemble, and maintained stable towards the end of the stage;
Pressure equilibration: The simulation box vectors were compressed by a Parrinello-Rahman extended-ensemble to equilibrate the system at 1 bar pressure, during 1 to 2 ns.
Fig. 9. System preparation for molecular dynamics simulations: Top – Carbon model; Middle – Pharmaceutical addition; Bottom – Solvation
Data gathering: The equilibrated system settings was kept for 10 ns for data collection, having snapshots collected every 20 ps for further analysis. Linear Constrain Solver (LINCS) algorithm was employed to convert all bonds and angles that involve hydrogen atoms to bond constrains.
2.3.4) Monte Carlo adsorption essays
Monte Carlo adsorption essays were carried out in the GCMC ensemble using RASPA 2.0 software (110). Partial pressure values were converted to fugacity using the Peng-Robinson equation of state (111), as stated in Eq. 1.
𝑝 = 𝑅𝑇 𝑉𝑚− 𝑏− 𝑎𝛼 𝑉𝑚2+ 2𝑏𝑉𝑚− 𝑏2 , 𝑤ℎ𝑒𝑟𝑒: 𝑎 =0.45724 𝑅 2𝑇 𝐶2 𝑝𝐶 𝑏 =0.07780 𝑅 𝑇𝐶 𝑝𝐶 𝛼 = ( 1 + 𝑘 (1 − 𝑇𝑅0.5))2 𝑘 = 0.37464 + 1.54226𝜔 − 0.26992𝜔2 𝑇𝑅= 𝑇 𝑇𝐶 Eq. 1
Critical temperature (TC), critical pressure (PC) and acentric factor (ω) values were extracted from available literature for water and ions. SMX and CBZ critical properties were estimated using Joback method (112), and acentric factors were predicted using Positional Distributive Contribution method (113). The calculated values used in the present work are available in Table 6. GCMC essays were performed for 3000 to 6000 steps (or until equilibrium), at 300K and 1 atm. Water was used as solvent in all essays. Partial pressures of the components in the simulation were tuned to reflect the desired concentration of the pharmaceutical molecules in the mixture.
Table 6. Critical properties and acentric factors calculated for the pharmaceutical molecules studied
TC (K) PC (kPa) ω
SMX 1006.40 5175.72 0.2389
Simulated concentrations of pharmaceuticals in water were 1, 100 and 1000 ppb, as to reflect the values commonly found in literature regarding their concentrations in the environment. Two modes of adsorption were studied: single component and competitive adsorption. In competitive adsorption, the considered pharmaceuticals were in an equimolar mixture. Four types of moves were employed, with equal probability, in the GCMC ensemble: translation, rotation, reinsertion and identity change. Translation and rotation move and orient the molecule in 3D space; reinsertion moves try to remove or insert a new molecule in the simulation box with equal probability.; identity change moves try to remove one molecule and insert a different one in the same place and with the same orientation. This move was especially useful in competitive adsorption essays.
2.3.5) Monte Carlo surface area determination
Geometric surface area of the modelled materials was computed using Monte Carlo, where a probe atom (radius σ = 2.958 Å) was “rolled” over the AC model surface, and the SBET was considered as the summation of all non-overlapping probe spheres after 104 steps. Additionally, void fraction volumes were also computed using MC. Helium probes were inserted in the AC model box using Widom particle insertions, and the void fraction was determined to be the empty space divided by the total volume.
2.3.6) Visualization methods
Molecular structures were visualized with PyMol (114). Carbon atoms are displayed in dark grey, oxygen atoms in red, hydrogen atoms in light grey, nitrogen atoms in blue and sulphur atoms in yellow. In pharmaceutical molecules, SMX carbon atoms are displayed in light brown and CBZ carbon atoms are displayed in dark green, for clarity.
Macromolecular electrostatic potential maps were obtained with the Adaptive Possion-Boltzman Solver (APBS) plugin for PyMol (115). APBS writes out electrostatic potentials in dimensionless units of kb T ec-1 where kb is Boltzmann’s constant (1.38 x 10⁻²³ J K-1), T is the temperature (K) and e
c is the charge of an electron (1.6 x 10⁻¹⁹ C).
Pore studies were performed with the aid of MOLE 2.0 software (110), considering only pores with diameters less than 2nm (micropores). A 30 Å surface probe was used to find cavities.
Results and discussion
“No, you're not going to be able to understand it. … That is because I
don't understand it. Nobody does. Quantum mechanics describes nature
as absurd from the point of view of common sense. And yet it fully agrees
with experiment. So I hope you can accept nature as She is - absurd.”
- Richard Feynman, The Strange Theory of Light and Matter, 1985
3
C
h
a
p
t
e
r
3.1) Carbon materials production
______________________________________
As previously described, 3 carbon materials were prepared for characterization. As illustrated in Fig. 10, production yields were vastly different among samples: PS800 had a production yield of 43.2%. When the carbon material suffered a washing step with HCl, the production yield plummeted to 15.1%. This difference can be attributed to the removal of inorganic material and also inevitable losses of carbon. Furthermore, when the carbon material was activated using K2CO3, the overall yield of the production step was 3.5%, as a result of the reaction between the percursor and the activating agent which resulted in an extremely low-density material.
3.2) Carbon materials characterization
______________________________________
3.2.1) Fourier transform infrared spectroscopy with attenuated total
reflectance (FTIR-ATR)
It has been previously shown that surface chemistry may play a major role in adsorption mechanisms in ACs Therefore, FTIR-ATR was employed as technique to provide insights regarding the functional group contents of the studied samples. Fig. 11 shows the FTIR-ATR spectra obtained for each of the samples characterized. It is possible to distinguish a fingerprint region on the spectra, around wavenumber 500 to 1700 cm-1. Several peaks can be identified, namely:
The small set of peaks from 500-750 cm-1 are usually acknowledged as signals from in- and out-of-plane vibrations from aromatic ring deformations, while the 1650 cm-1 peak can be attributed to C=C stretching in benzene rings;
The peaks at 1030, 1110 and 1160 cm-1 are recognized as C-O-C stretching vibrations signals;
The peak around 1350 cm-1 can be related to C-H bending vibrations; The broad peak at 1440 cm-1, in conjugation with a sharp strong signal at
875 cm-1 is characteristic of carbonate ions;
Although with smaller intensity, the broad peak at 3300 cm-1, in conjugation with smaller peaks at 2920 and 3640 cm-1 indicates the presence of -OH alcohol or phenol groups;
The identified peaks fade in PS800-K2CO3-HCl sample. Such information can give us a first indication of the surface chemistry of the characterized samples. The gathered data suggests that PS-derived carbon material’s functional groups are primarily composed of ethers, phenols, alcohol and C-H groups. It is still possible to observe the disappearance of FTIR-ATR signals related to carbonate ions in materials subjected to HCl washing, in PS800-HCl and PS800-K2CO3-HCl samples, being expected that formed pores and cavities become unobstructed by these carbonate impurities, increasing the carbon material effectiveness in adsorption experiments.
Fig. 11. FTIR-ATR spectra of the precursor and different carbon materials
3.2.2) Point of zero charge (PZC) determination
For the PZC determination, tubes with a salt solution, at different pH values between 2 and 12 (pHi), were incubated with a carbon material sample. It is expected that the carbon functional groups interact with the medium to provide or receive protons, contributing for a variation in the final pH (pHf) of the sample. For this reason, the PZC is defined as the pH value at which the pH of the medium is similar to the one on the carbon surface, and therefore there is an insignificant change in pHf. In Fig. 12, this is shown as the pH value at which the ΔpH is 0. PZC values of the studied samples are as follow: