José Evaldo Geraldo Costa
Master in Business Management
Mass introduction of electric passenger
vehicles in Brazil: impact assessment
on energy use, climate mitigation and
on charging infrastructure needs for several case studies
Thesis submitted in partial fulfilment of the requirements for the degree of Doctor of Philosophy in Climate Change and Sustainable Development Policies – Speciality inEnvironmental Scienses
Supervisor: Prof. Maria Júlia Fonseca de Seixas, Associate Professor,
Faculdade de Ciências e Tecnologia da Universidade
NOVA de Lisboa
Co-supervisor: Prof. Lieselot Vanhaverbeke, Professor of Faculty of
Economic, social and political sciences and Solvay business
School Vrije Universiteit Brussel, Belgium
Examination Committee:
Chairperson: Prof. Maria Paula da Costa Antunes, Full Professor, FCT/UNL
Raporteurs: Prof. Filipe Manuel Mercier Vilaça e Moura, Associate Professor, IST/UL
Prof. Francisco Manuel Freire Cardoso Ferreira, Associate Professor, FCT/UNL
Members: Prof. Filipe Duarte Branco da Silva Santos, Full Professor Emeritus, FC/UL
Prof. Maria Paula Baptista da Costa Antunes, Full Professor, FCT/UNL
Prof. Maria Júlia Fonseca de Seixas, Associate Professor, FCT/UNL
Prof. Thierry Coosemans, Professor, Faculty of Sciences and Bio-Engineering Sciences – Vrije Universiteit Brussel
Copyright © José Evaldo Geraldo Costa, Faculdade de Ciências e Tecnologia e Universidade Nova de Lisboa “A Faculdade de Ciências e Tecnologia e a Universidade Nova de Lisboa têm o direito, perpétuo e
sem limites geográficos, de arquivar e publicar esta dissertação através de exemplares impressos reproduzidos em papel ou de forma digital, ou por qualquer outro meio conhecido ou que venha a ser inventado, e de a divulgar através de repositórios científicos e de admitir a sua cópia e distribuição com objetivos educacionais ou de investigação, não comerciais, desde que seja dado crédito ao autor e editor.”
ACKNOWLEDGMENTS
I am very grateful to all the people who contributed to this document. Certainly, I will not be able to name all people, as I wish, due to the limited space for this purpose. However, I could not fail to record my special thanks.
To my illustrious adviser from Lisbon, Portugal, Prof. Doctor Julia Seixas, who spared no effort to support my activities. Her memorable teaching, reception, advice and logistical support were very important to the development of the work. Without her help, reaching this point would be almost impossible. It was a privilege to have her as an adviser.
To my distinguished adviser from Brussels, Belgium, Prof. Doctor Lieselot Vanhaverbeke for availability, hosting, follow-up, criticism and other support. It was an honor to have her as mentor. Without her assistance, completing this work would be a much more complicated task.
To Doctor Patricia Baptista, who was always present, offering direction and providing efficient feedback. Her support contributed significantly to the results of the work.
To Prof. Doctor Daniel Sperling, Prof. Doctor Brian Ó Gallachóir, Prof. Doctor Cathy Macharis, Prof. Doctor Joeri Van Mierlo, Prof. Doctor Thiago Farias, Prof. Doctor Thomas Turrentine and Prof. Doctor Lew Fulton for the welcome, availability, direction and logistical support.
To Doctor Angela Sanguinetti, Doctor Cedric De Cauwe, Doctor Dahlia Garas, Doctor Eamonn Mulholland, Doctor Emma Hanley, Doctor Hengbing Zhao, Doctor Hickey Conor, Doctor Maarten Messagie, Doctor Parveen Kumar, Doctor Peter Deeney, and Doctor Tarun Sharma, for the valuable feedback.
To Mrs. Lili Fulton, for the friendship, welcome, availability and collaboration. Your support was very important.
To Prof. Doctor Filipe Duarte Santos for the patience, wisdom, and direction. Although brief, the classroom life was motivating, enlightening and contributed significantly to the results achieved.
To Prof. Doctor Ana Delicado, Doctor Ana Horta, Doctor Gil Penha Lopes, Doctor Gonçalo, Gonçalves, Doctor Joao Ferrao, Doctor Jose Lima Santos, Doctor Jose Saldanha Matos, Doctor Luisa Schmidt, Doctor Maria Jose Roxo, Doctor Olivia Bina, Doctor Ricardo Aguiar, Doctor Rodrigo Oliveira, Doctor Rui Ferreira Santos, Doctor Tim O'riordan, Thierry Coosemans and Doctor Viriato Soromenho-Marques for the invaluable teaching.
To Mrs. Elsa Godinho, Mrs. Helena Padamo, Mrs. Gracinda Caetano, Mrs. Liliana Santos, Mrs. Alexandra Carapinha and Mrs. Raquel Brito for their availability and logistical assistence.
To Mrs. Ana Helena de Andrade (Director AGCO South America), Mr. Alberto Maluf (BYD Director), Mr. Andre Fraga (Secretary of Environment of Salvador), Mr. Antonio Ademir Stroski
(Secretary of Environment of Amazonas), Mr. Antonio Megale (President of Anfavea), Mr. Carlos Alberto Matter (Superintendent ANEEL), Mr. Fabricio Biondo (Vice-Chairman PSA Group), Mr. Luiz Augusto Barroso (President of EPE), Mrs. Margarete Maria Gandini (Director of the Ministry of Mines and Energy), Mr. Ricardo Augusto Martins (Executive Director of Hyundai and vice president of Anfavea), Mr. Ricardo Auriema (Cooperative President of Taxi of São Paulo - Catumbi), and Mr. Ricardo Guggisberg (President of the Brazilian Electric Vehicle Association - ABVE) for their support of surveys realization. To the Encuestafacil that kindly allowed the use, at no cost, of its survey tool.
To my wife Norma, my son Gustavo and my daughter Cristiane for friendship, companionship, love, trust, motivation and unconditionally supporting me. All of you are wonderful. Thank God for giving me this family.
To my parents Mr. Ignacio de Aguiar Costa (in memory), and to my mother Mrs. Dagmar Geralda Costa (in memory) for the excellent examples of their lives, and unlimited support. My sisters Enerides, Edna, Ednia, Helena and Helia (in memory) and to my brother Jorge for their support in the moments that I needed it the most. All of you are amazing. Thank God for being part of this family, and finally, thank you God for the gift of life.
"There are no passengers on Spaceship Earth. We are all crew." Marshall McLuhan
Abstract -
Mobility has proved to be a major challenge for human development, especially in urban centers worldwide, where more displacement is required, since fossil fuels consumption is increasing as well as greenhouse gas (GHG) emissions, causing air quality degradation and global warming. The predicted population increase in cities tends to increase the demand for mobility and to further exacerbate those impacts. Therefore, sustainable transport is key for the future of mobility, and electric vehicle (EV) has emerged as a recognized sustainable option. However, there are many electric vehicle barriers diffusion. This research aims to contribute to the diffusion of EV in Brazil, by assessing: 1) whether EV is a more sustainable technology when compared with ethanol vehicle; 2) the impacts of the expansion of electric mobility on CO2 emissions, in Sao Paulo; 3) how to overcome the barriers for the charging infrastructure deployment at the municipality level, in Sao Paulo, Rio de Janeiro and Belo Horizonte; and 4) key challenges and opportunities from the mass adoption of EV in Brazil. A plethora of different methods were used, including scenario analysis, multi-criteria decision methods, geographic information systems and SWOT analysis.
Main results point to EV as the best technology to mitigate passenger transport related CO2 emissions in Brazil, due to its low carbon footprint. In Sao Paulo, this option could reduce around 11 MtCO2 by 2030 and save 6,200 billion USD in energy with the replacement of 20 percent of gasoline cars with EV. To meet 1 percent of EV's market share, Sao Paulo, Rio de Janeiro and Belo Horizonte together will need around 6,500 charging stations concentrated in around 1/3 of their territories (level 2). Brazil may likely have up to 10 percent of EV penetration by 2030, with the diffusion taking place mostly in southeastern municipality. Ethanol, lack of electric mobility public policy, non-urbanized like subnormal agglomerates, and risk areas, like flood hazard, are major obstacles for EV diffusion in Brazil.
Resumo
A mobilidade provou ser um grande desafio para o desenvolvimento humano, especialmente nos centros urbanos em todo o mundo, onde mais deslocamentos são necessários, o consumo de combustíveis fósseis está aumentando, assim como as emissões de gases de efeito estufa (GEE), causando degradação da qualidade do ar e aquecimento global. O aumento previsto da população nas cidades tende a aumentar a demanda por mobilidade e a agravar ainda mais esses impactos. Portanto, o transporte sustentável é fundamental para o futuro da mobilidade, e o veículo elétrico (VE) surge como uma opção sustentável reconhecida. No entanto, existem muitas barreiras à difusão de veículos elétricos. Esta pesquisa visa contribuir para a difusão do VE no Brasil, avaliando: 1) se o VE é uma tecnologia mais sustentável quando comparado ao veículo a etanol; 2) os impactos da expansão da mobilidade elétrica nas emissões de CO2, para o caso de São Paulo; 3) como superar as barreiras para a implantação da infraestrutura de carregamento a nível municipal, para os casos de São Paulo, Rio de Janeiro e Belo Horizonte; e 4) principais desafios e oportunidades da adoção em massa de EV no Brasil. Diferentes métodos foram utilizados, incluindo análise de cenário, métodos de decisão multicritério, sistemas de informação geográfica e análise SWOT.
Os principais resultados apontam para o EV como a melhor tecnologia para mitigar as emissões de CO2 relacionadas ao transporte de passageiros no Brasil, devido à sua baixa pegada de carbono. Em São Paulo, essa opção poderia reduzir em torno de 11 MtCO2 até 2030 e economizar 6,2 bilhões de dólares em energia com a substituição de 20 porcento dos carros a gasolina por VE. Para atender a 1 por cento da participação de mercado do EV, São Paulo, Rio de Janeiro e Belo Horizonte juntos precisarão de cerca de 6.500 estações de carregamento concentradas em cerca de 1/3 do território (nível 2). O Brasil pode ter até 10 por cento de penetração de veículos elétricos até 2030, com a difusão ocorrendo principalmente no Sudeste. O etanol, a falta de políticas públicas para a mobilidade elétrica, espaços não-urbanizados como aglomerados subnormais, e áreas de risco, como o risco de inundação, são grandes obstáculos para a difusão do VE no Brasil.
Palavras-chave: veículo elétrico, energia renovável, transporte, emissão de CO2, mudança climática, Brasil
TABLE OF CONTENTS
LIST OF FIGURES ... xix
LIST OF TABLES ... xxi
ACRONYMS ... xxiii
CHAPTER 1 | INTRODUCTION ... 1
1.1 Relevance and Problem statement ...5
1.1.1 Energy consumption CO2 emissions from transport in Brazil ...6
1.1.2 Electric vehicle potential as massive climate mitigation option ...7
1.2 Research questions ...8 1.3 Research strategy ...9 1.4 Case studies ...17 1.5 Scientific Outputs ...18 1.6 Outline of thesis ...19 References ...19
CHAPTER 2 | ELECTRIC MOBILITY: BARRIERS AND CHALLENGES
FOR MASSIVE EXPANSION ... 25
2.1 Evolution of electric vehicles ...30
2.2 Technological disruption ... 34
2.2.1 Personal road personal transportation technology disruption ...34
2.2.2 Current stage and future perspective of EV ...43
2.3 Incentives for EV adoption ...45
2.3.1 EV benefits provided by sector ...45
2.3.2 Public policy and subsidies to encourage EV mass adoption ...50
2.3.3 The EV potential to mitigate GHG: opposition and advocates ...53
2.3.4 Energy dependence reduction, efficiency, and the renewable energies ...58
2.4.1 Barriers by market stakeholders’ group ...62
2.4.2 Information and adoption barriers’ analysis ...66
2.4.3 The Brazilian market barriers ...67
2.5 Circular economy and innovative business models ...69
2.5.1 Synergies between EV and circular economy ...69
2.5.2 Innovative business model to support EV evolution ...72
2.5.3 Circular economy and business model to support Brazilian EV market ...76
2.6. Key Findings ...77
References ...78
Appendix A ... 99
CHAPTER 3 | ELECTRIC VEHICLES AS LOW CARBON
MOBILITY OPTION: THE CASE OF SAO PAULO ... 105
3.1 INTERPLAY BETWEEN ETHANOL AND ELECTRIC VEHICLES AS LOW CARBON MOBILITY OPTIONS FOR PASSENGERS IN THE MUNICIPALITY OF SAO PAULO ...107
3.1.1 Introduction ...107
3.1.1.1 Passenger transport in Sao Paulo ...108
3.1.1.2 Sustainable transportation ...109
3.1.1.3 Electric mobility potential to promote sustainable passenger transport in Sa~o Paulo ...109
3.1.2 Methodology ...110
3.1.3 Results ...114
3.1.3.1 Passenger cars fleet by technological option ...114
3.1.3.2 Energy consumption in passenger cars ...115
3.1.3.3 CO2 emissions ...116
3.1.4 Discussion ...117
3.2.1 Introduction ...125
3.2.2 Methodology ...127
3.2.3 Data Collection For SP And SH ...128
3.2.4 Collection analysis ...134
3.2.4.1 Correlation of the actions to mitigate CO2 emissions in SP and SH’s urban road transportation ...134
3.2.4.2 Correlation economic and social data from SP and SH municipalities ...135
3.2.4.3 Performance of urban road transportation of SP and SH ...135
3.2.4.4 Comparison of urban road transportation of SP and SH for 100,000 residents ...135
3.2.4.5 Correlation by emission of urban motor vehicle of SP and SH in the 2000s ...136
3.2.4.6 Correlation between the energy consumption of SP and SH’s urban transportation ...136
3.2.4.7 Correlation of CO2 emissions of urban road transportation of SP and SH municipalities ...138
3.2.5 Conclusion ...138
References ...139
3.3 CONTRIBUTION OF ELECTRIC CARS TO THE MITIGATION OF CO2 EMISSIONS IN THE CITY OF SAO PAULO ...145
3.3.1 Introduction ...145
3.3.2 Methodology ...148
3.3.3 Results ...150
3.3.4 Conclusion ...151
References ...151
CHAPTER 4 | ASSESSING ELECTRIC VEHICLES’ CHARGING
INFRASTRUCTURE AT THE MUNICIPALITY LEVEL: THE CASES OF RIO
DE JANEIRO, BELO HORIZONTE AND SAO PAULO ... 155
4.1 SPATIAL PLANNING OF ELECTRIC VEHICLE INFRASTRUCTURE FOR BELO HORIZONTE, BRAZIL ...157
4.1.1 Introduction ...157
4.1.2.1 Characterization of the studied region ...159
4.1.2.2 Electric vehicle penetration ...160
4.1.2.3 Importance of EVSE for the success of EV ...161
4.1.3 Material and methods ...162
4.1.3.1 Method definition ...162 4.1.3.2 Territorial divisional ...163 4.1.3.3 Demand identification ...163 4.1.3.4 Survey to specialists ...164 4.1.3.5 GIS analyses ...165 4.1.4 Results ...169 4.1.4.1 Survey results ...170
4.1.4.2 GIS analysis results of recommended area for EVSE_L1 ...171
4.1.4.3 GIS analysis results of recommended area for EVSE_L2 ...172
4.1.4.4 GIS analysis results of recommended area for EVSE_L3 ...172
4.1.5 Discussion ...173
4.1.6 Conclusion, limitations, and recommendations ...173
References ...175
4.2 SUITABLE LOCATIONS FOR ELECTRIC VEHICLES CHARGING INFRASTRUCTURE IN RIO DE JANEIRO, BRAZIL ...183
4.2.1 Introduction ...183
4.2.2 Methodology ...185
4.2.2.1 For EVCI demand in Rio de Janeiro ...185
4.2.2.2 Survey to identify the best areas to expand EVCI ...185
4.2.2.3 Data processing ...186
4.2.2.4 Evaluation of variables ...187
4.2.3.3 Recommended location for the EVCI_L3 ...191
4.2.4 Conclusion ...192
References ...192
4.3 ASSESSING CHARGING INFRASTRUCTURE LOCATIONS FOR FUTURE EXPANSION OF E-MOBILITY: A CASE STUDY FOR SAO PAULO ...197
4.3.1 Introduction ...197
4.3.1.1 Literature review ...198
4.3.2 Methods ...200
4.3.2.1 Case study: Sao Paulo ...201
4.3.2.2 EVCS demand and proportion of EVCS by level ...201
4.3.2.3 Survey to identify and value the attributes determinants of the EVCS location ...202
4.3.2.4 GIS analysis ...204
4.3.3 Results and discussion ...206
4.3.3.1 Score values from the EV experts’ survey ...206
4.3.3.2 GIS analysis ...207
4.3.4 Conclusion, limitations and future research ...209
References ...210
CHAPTER 5 | LEARNING FROM BRAZILIAN STAKEHOLDERS:
CHALLENGES AND OPPORTUNITIES ASSOCIATED WITH THE MASS
PENETRATION OF ELECTRIC MOBILITY ... 213
5.1. ELECTRIC VEHICLES CHALLENGES, OPPORTUNITIES AND PERSPECTIVE: BRAZIL AUTOMOTIVE SURVEY AND ANALYSIS ...215
5.1.1 Introduction ...215
5.1.2 Critical factors for EV market expansion ...217
5.1.2.1 The EV global evolution, current status and future perspectives ...218
5.1.2.2 Policies to develop EV market: barriers, challenges and lessons ...218
5.1.2.3 EV policies, relevance and perspectives in Brazil ...220
5.1.3.1 Data production ...220
5.1.3.2 Methodology focused on the SWOT analysis ...221
5.1.4 Results and discussion ...223
5.1.4.1 Sample description ...223
5.1.4.2 Views from stakeholders on the development of EV in Brazil ...223
5.1.4.3 SWOT analysis ...225 5.1.5 Discussion ...227 5.1.5.1 Policy implications ...228 5.1.6 Conclusion ...229 References ...230 Appendix B ...235
CHAPTER 6 | GENERAL DISCUSSION AND CONCLUSIONS ... 237
6.1 Answering research questions ...239
6.1.1 RQ#1: What is the most appropriate technology for the purpose of climate mitigation and energy consumption reduction in the case of Sao Paulo: electric or ethanol vehicle? ...239
6.1.2 RQ#2: What will be the expected impacts of the likely expansion of electric mobility in Sao Paulo municipality, in terms of CO2emissions and energy consumption and how effective are current public policies in place to promote such expansion? ...242
6.1.3 RQ#2: How to overcome the barriers regarding the deployment of the charging infrastructure at the municipality level, in the case of Sao Paulo, Rio de Janeiro and Belo Horizonte? ...244
6.1.4 RQ#2: What are the main perceived challenges and opportunities from the mass penetration of electric mobility in Brazil? ...246
mobility in Brazil? 6.2 Limitations and future work ...246
6.3 Final remarks ...247
LIST OF FIGURES
1.1 – Global vehicles sales from 2005 to 2017 (Adapter from OICA 2018) ...3
1.2 – Vehicles sales in Brazil from 2005 to 2017 (Adapted from ANFAVEA 2017) ...4
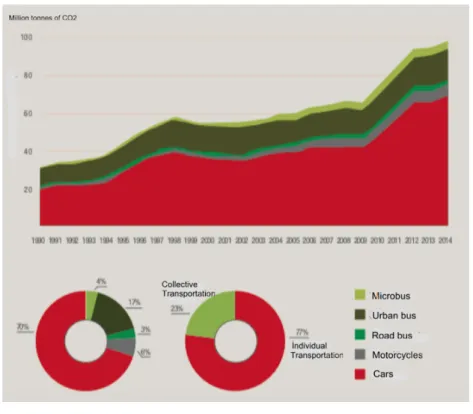
1.3 – Evolution of CO2e emissions in road passenger transport in Brazil from 1990 to 2014 (Adapted from SEEG 2016) ...4
1.4 – Worldwide evolution of energy consumption from 1990 to 2014 (Adapted from IEA 2018) ...5
1.5 – Transportation Sector Energy Consumption - 103 toe (Adapted from EPE 2018) ...6
1.6 – Research scheme (Adapted from EPE 2018) ...9
1.7 – Research scheme (Adapted from EPE 2018) ...15
2.1 – Electrified vehicles scheme ...27
2.2 – The remarkable facts on electric vehicles evolution from 1801 to 1896 ...30
2.3 – The remarkable facts on electric vehicle evolution from 1897 to 1965 ...31
2.4 – The remarkable facts related electric vehicle evolution from 1966 to 2000 ...32
2.5 – The remarkable facts regarding electric vehicle evolution after 2000 ...33
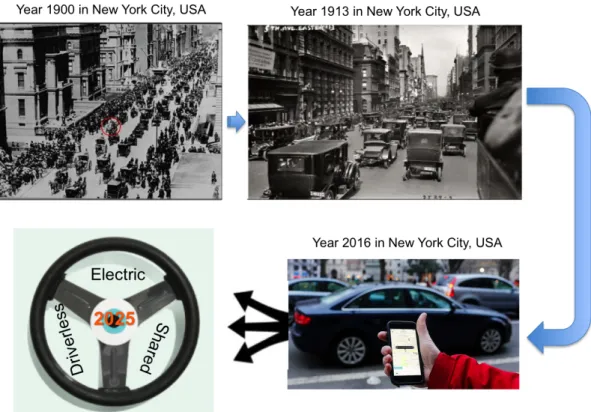
2.6 – Phases of private road transport disruption (Adapted from Archives 2018, Hewitt 2018 ...37
2.7 – Global stock scenarios of passenger PEV from 2010 to 2017 (Adapted from Hertzke et al. 2018) ...44
2.8 – Market share of the sales shares based in scenarios for 2020, 2030 and 2050 distinguished by EV type ...45
2.9 – Public policy is needed to support EV mass-market penetration (Adapted from Pellischek, 2013) ...51
2.10 – Comparison of CO2 emissions between EV and ICEV (Adapted from Gambhir, A. et al. 2018) ...57
2.11 – The main impacts caused by the growth of the EV fleet in the electricity distribution network ...60
2.12 – Scheme for the analysis of EV barriers ...62
3.1 – The energy reference system of passenger transportation sector in Sao Paulo ...111
3.2 – The energy reference system of small passenger cars in Sao Paulo ...112
3.3 – Evolution of the stock of passenger cars by technology in Sao Paulo between 2011 and 2030 ...114
3.4 – Energy mix in transportation of passenger cars in Sao Paulo between 2011 and 2030 ... 115
3.5 – CO2 emissions of passenger cars in Sao Paulo between 2011 and 2030 ...116
3.6 – Performance of energy consumption and emissions of CO2 in 2030 in relation to 2011 ...117
3.7 – Model for research ...128
3.9 – CO2 emissions of the SH municipal urban road transportation: 2003-2010 ...133
3.10 – Brazilian electricity supply by sources in 2012 ...148
3.11 – Share of electricity supply in Sao Paulo in 2010 ...148
4.1 – South-Central region of the municipality of Belo Horizonte ...159
4.2 – Replies received from the specialists ...170
4.3 – Average rating of expert rated attributes and standard deviation ...171
4.4 – Optimal locations for EVSE_L1 ...171
4.5 – Optimal locations for EVSE_L2 ...172
4.6 – Optimal locations for EVSE_L3 ...172
4.7 – Data processing in a GIS environment ...187
4.8 – Sending and responses of survey questionnaires ...189
4.9 – Values attributed to attributes by the experts ...189
4.10 – Ideal location for EVCI_L1 ...190
4.11 – Ideal location for EVCI_L2 ...191
4.12 – Ideal location for EVCI_L3 ...191
4.13 – Territorial divisions of the municipality of Sao Paulo ...201
4.14 – Works flowchart ...206
4.15 – Areas for the optimal location of EVCS in Sao Paulo municipality ...208
5.1 – Step-by-step methodology, focused on the SWOT analysis process ...222
5.2 – Main results of the SWOT analysis ...225
LIST OF TABLES
2.1 Vehicle definitions model and engine type ...28
2.2 EV evolution by remarkable phases ...30
2.3 Countries that demonstrated their intention to limit or ban fossil fuel vehicles ...35
2.4 Global car-sharing market trends ...38
2.5 Predictions about the future of driverless cars (ND = not declared) ...42
2.6 Key social (s), economic (e), technological (t) and political (p) benefits of EV ...47
2.7 Summary of EV benefits provided by complementary perspective ...49
2.8 Subsidy types available for EV by country by the month July 2018 ...54
2.9 Positive impacts (benefits) of integrating EV with renewables ...60
2.10 Key EV (Social (S), Economic (E), Technologic (T), Political (P), Information (I), and Access (A) barriers ...64
2.11 EV by types, cars and battery weight ...70
2.12 Some new electric mobility businesses model that did not thrive ...75
3.1 CO2 emission factors ...112
3.2 CO2 Measures to support low-carbon mobility ...113
3.3 Comparison of energy consumption and CO2emissions between carspowered by ethanol and electric in Sao Paulo ...118
3.4 Motor vehicle fleet evolution in SP: 2003-2010 ...129
3.5 Energy consumption of the transportation sector in SP: 2003-2010 ...130
3.6 Current urban road transportation of Shanghai Municipality: 2003-2010 ...132
3.7 Energy consumption of the urban road transportation of Shanghai: 2003-2010 ...132
3.8 Actions to mitigate CO2 emissions from 2000 to 2010 in SP and SH ...134
3.9 Economic and social data from SP and SH municipalities ...135
3.10 Analysis of urban road transportation in Sao Paulo (SP) and Shanghai (SH) ...136
3.11 Urban road transportation for 100,000 residents: SP vs SH-2003/2010 ...136
3.12 Implementation phases of the standards for vehicle emissions: SP vs SH ...136
3.13 Analysis of energy consumption of urban road transportation SP and SH ...137
3.14 Analysis of CO2 emissions from urban road transportation of SP and SH ...138
3.15 Estimated Current Fleet In Sao Paulo(SP)(2012) ...146
3.16 Consumption Of Gasoline And Ethanol In Sao Paulo ...147
3.17 Specific Electricity Consumption And Autonomy ...149
3.18 Table 3.18 –Gasoline Consumption From 2015 to 2030 ...150
3.19 Reduction In CO2 Emission In 2020 And 2030 ...150
3.20 Economic Gains For Sao Paulo For 2020 And 2030 ...151
4.1 Attributes used in similar studies (√ – presence) ...162
4.3 Data source of the attributes in vector format ...165 4.4 Data source of the attributes in vector format ...166 4.5 AHP Analysis Criterion ...166 4.6 Number of attributes and random index ...167 4.7 L2 scenario ...168 4.8 L2 Pairwise matrix for L3 scenario ...168 4.9 Attributes Used In Research ...186 4.10 Input Variables And Treatment Sig ...186 4.11 Selected attributes (√ = presence; ✗ = absence) ...190 4.12 Attributes used in studies related with EV charging infrastructure ...199 4.13 Technical specifications of the different levels of EVCS ...202 4.14 Participation of the sectors surveyed ...203 4.15 Survey characterization ...203 4.16 Spatial data, used and sources ...204 4.17 Criteria used in GIS analysis for the three types of EVCS ...205 4.18 Scores from the EV specialists on the attributes to condition the location of EVCS in Sao Paulo ...207 5.1 Participation of the sectors surveyed ...221 5.2 Topics of the survey questionnaire ...221 5.3 Stakeholders' profile ...222 6.1 Comparison of LDV average CO2 emissions between ethanol versus EV ...242 6.2 Dissertation overview: from design problem to advanced knowledge and key insights to policy makers and stakeholders ...249
ACRONYMS
AC – Alternating Current
AHP – Analytical Hierarchy Process
APP – Application (a computer program that is designed for a particular purpose) AV – Autonomous Vehicle
BEV – Battery Electric Vehicles BH – Belo Horizonte
BM – Business Model
BYD – Build Your Dreams (EV car manufactory) CaaS – Car-as-a-Service
CCS – International’s Combined Charging System CE – Circular economy
CO2 – Carbon Dioxide
CTB – Company Tax Benefits DC – Direct Current
DER – Distributed Energy Resources DMS – Demand Management System DPS – Direct Purchase Subsidies EM – Electric Mobility
EPA – Environmental Protection Agency EU – European Union
EURO – European emission standards for vehicles
EV – Electric Vehicles
EVCI – electric vehicle charging infrastructure EVCS – Electric Vehicle Charging Station EVIP – Electric Vehicle Initiative Program EVSE – Electric Vehicle Supply Equipment FCEV – Fuel Cell Electric Vehicle
GDP – Gross Domestic Product GHG – Greenhouse Gases Emissions GIS – Geographic Information Systems GM – General Motors
HEV – Hybrid Electric Vehicle HOV – High occupancy vehicle ICE – Internal Combustion Engine
ICEV – Internal Combustion Engine Vehicle IEA – International Energy Agency
INI – Infrastructure National Incentives IoT – Internet of Things
IPCC – Intergovernmental Panel on Climate Change IVA – Individual Voluntary Arrangement
LCA – Life-Cycle Assessment LCI – Living City Incentives
LDEV – Light-Duty Electric Vehicles LDV – Light-Duty Vehicles
LE – Linear economy
LEAP – Long-range Energy Alternatives Planning System LIDAR – Light Detection and Ranging
MCDM – Multi-criteria Decision Making
OECD – Organization for Economic Co-operation and Development
OHB – Other Benefits
OPEC – Organization of The Petroleum Exporting Countries OTB – Ownership Tax Benefits
PHEV – Plug-In Electric Vehicle PPM – Parts Per Million
RD&D – Research, Development and demonstration REE – Rare Earth Element
RJ – Rio de Janeiro
RTB – Registration Taxes Benefits SDS – Sustainable Development Scenario SH – Shanghai
SP – Sao Paulo
SPSS – Statistical Package for the Social Sciences SUV – Sport Utility Vehicle
SWOT– Strengths, Opportunities, Weaknesses, and Threats Analysis TCO – Total Cost of Ownership
TPES – Total Primary Energy Supply TTW – Tank-to- Wheels
USA – United States of America USC – Union Scientists Concerned
V2N – Vehicle-to-Neighborhood V2S – Vehicle-to-Street
V2X – Vehicle-to-Everything
WLC – Weighted Linear Combination WTT – Well-To-Tank
WTW – Well-to-Wheels ZEV – Zero Emissions Vehicle
Human activity has been very carbon intensive, which has resulted in a significant increase in carbon dioxide (CO2) concentration in the atmosphere. It has increased from about 280 parts per million (ppm) in the pre-industrial period to average concentration of 411 ppm in January 2019, a growth of almost 47 percent (NASA 2019). Santos (2011) quoted Rockstrom saying that the safe limit for the planet's CO2 concentration in the atmosphere is 350 ppm. Consequently, avoiding the increase of global CO2 emissions to maintain the global average temperature between 1.5 and 2°C above pre-industrial levels is a major challenge for humankind, in order to support the targets of the Paris Agreement.
Cities account for more than half of the world's population and are great mobility demanders. Also, they constitute a driving force for economic development, holding about 80 percent of global GDP, accounting for two-thirds of all primary energy consumption and for 70 percent of carbon dioxide (CO2) emissions (Energy & Transformations 2017).
Figure 1.1 – Global vehicle sales from 2005 to 2017 (Adapter from OICA 2018)
Global transport is the second largest sector regarding energy consumption, just after industry. Over the last twelve years, global sales of road vehicles have been growing almost constantly. Between 2005 and 2017 the growth in sales was of around 56 percent, reaching almost 100 million units sold in 2017. Focusing on light-duty vehicles (LDV), in the same period, global sales grew by around 58 percent, reaching around 71 million units in the same year, as show in Figure 1.1 (OICA 2018).
Regarding energy consumption and greenhouse gases (GHG) emissions in 2016, the transport sector was responsible for almost 1/4 of worldwide energy-related emissions and road transportation was responsible for around 1/5 of the fuel consumption (Energy & Transformations 2017). The projections show that without mitigation action, transport emissions could more than double by 2050 (SLoCaT 2018).
In Brazil, the situation is similar, with a rapid growth of the road vehicle market, due to increasing urbanization level and consumers’ access to cars. Between 2005 and 2017 there was a growth of around 30 percent in road vehicle sales in Brazil, reaching more than 2 million units licensed in 2017, of which about 81 percent were LDV. In particular LDV sales grew by around 29 percent, in the same period, in
the Brazilian market (ANFAVEA 2017). The decline in sales after 2013 was due to the reduction of subsidies for car purchases (2012-2014), economic slowdown and political crisis, as shown on Figure 1.2.
Figure 1.2 – Vehicle sales in Brazil from 2005 to 2017 (Adapted from ANFAVEA 2017) The growth of penetration of road vehicles in the Brazilian market has contributed to worsening levels of CO2 emissions, since the country's transport sector consumes around 32 percent of the final energy consumption of which road transport represents 92 percent (EPE 2015).
Individual transportation (automobiles and motorcycles) emits more than three times in comparison to collective transportation (buses) despite transporting a smaller number of people, as shown in Figure 1.3. In this context, it is important to find new ways to develop alternative transportation solutions linked with resource efficiency under a circular economy collaborative process, aiming to mitigate anthropogenic emissions, including pollutants, and implement them in ways that limit emissions to target levels is a considerable challenge.
1.1 Relevance and Problem statement
The quest for the sustainable development of the global economy has demanded actions from policy makers aimed at limiting CO2 emissions from the energy and transportation sectors. According to the Intergovernmental Panel On Climate Change (IPCC), about 78 percent of the total GHG emissions increased from 1970 to 2010 were from fossil fuel combustion and industrial processes (IPCC 2014).
In 2010, emissions from energy combustion were around 2/3 of global GHG emissions, and energy demand continues to grow as a result of global economic development. According to IEA (2018) from 1971 to 2014, the global total primary energy supply (TPES) has grown by almost 150 percent and remains dependent on fossil fuels. Since 2014, fossil sources have been responsible for around 82 percent of the global TPES (IEA 2018).
Global energy consumption grew by over 40% between 1990 and 2015, as shown in Figure 1.4, with significant participation of the oil industry. The expected population increase should contribute to the growth of demand for energy. In this context, mitigation actions will be important to avoid the growth of energy consumption in the proportion recorded so far.
Figure 1.4 – Worldwide evolution of energy consumption from 1990 to 2014 (Adapted from IEA 2018a)
In 2015, road vehicles were responsible for almost 80 percent of the energy consumed in transport, and LDV accounted for 64 percent of this amount (IEA 2019). Globally, CO2 emissions from the
transport sector grew by 71 percent between 1990 and 2014 with road transport accounting for about three quarters of this growth (IEA 2018).
1.1.1 Energy consumption CO
2emissions from transport in Brazil
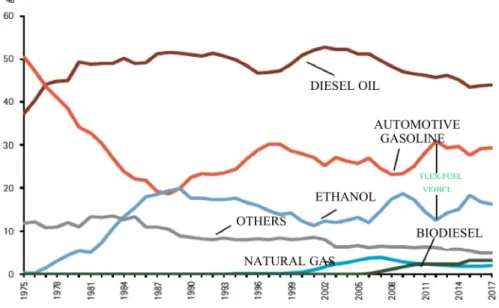
In Brazil the status is not so different. In 2014, the transportation sector was responsible for 32 percent of energy consumption and road transportation represented more than 92 percent of that measure. Fossil fuel is responsible for about 50 percent of the energy consumption for transport and it’s not greater due to the share of ethanol in the consumption mix (in Figure 1.5, the gasoline line refers to automotive gasoline which includes 27% of ethanol). The growth in the energy consumption of transport has been constant. Between 2008 and 2017 there was an increase of nearly 40 percent, with road transport accounting for more than 90 percent of total transport consumption. The highest energy consumption is diesel, followed by gasoline, as shown in Figure1.5. The gasoline energy consumption dropped from the second half of the 1980s due to ethanol production programs for transportation.
Figure 1.5 – Transportation Sector Energy Consumption - 10 toe (Adapted from EPE 2018)
The growth of the LDV fleet was one of the main factors responsible for the increase in CO2 emissions in transportation in the country (EPE 2015). In the municipality of Sao Paulo, the highest concentration of road vehicles in Brazil was recorded in 2010, with LDV representing more than 70 percent of the fleet and the transport sector accounting for more than 70 percent of CO2 emissions related to the energy sector; gasoline and diesel combined accounting for more than 75 percent of CO2 emissions from road transport. In 2010, the CO2 emissions from road urban transport in the municipality of Sao Paulo – the largest municipality in Brazil in population, GDP and car fleet – grew 80 percent, compared
transport sector, with individual transport (mostly light duty vehicles) being responsible for 78% of the road transport emissions (SMMA-RJ 2011). In 2013, the total fleet of Rio de Janeiro was around 2.7 million vehicles (about 50 percent of Rio de Janeiro state fleet). In the municipality of Belo Horizonte – the third largest fleet in Southeastern Brazil and the fourth-largest Brazilian city in population and GDP – the road transport sector accounted for around of 90 percent of the CO2 emission from transport sector of the major municipality of Minas Gerais (Estadual et al. 2008). In 2016, the municipality of Belo Horizonte accounted for 1.7 million vehicles (around 20 percent of Minas Gerais state fleet) of which almost 70 percent are LDV (IBGE 2018).
Sao Paulo, Rio de Janeiro and Belo Horizonte are the three major cities in Southeastern Brazil, being responsible for more than 50 percent of the Brazil’s GDP (IBGE 2017a). The Southeast region accounts for a higher level of industrial and urban development, concentrating 68 percent of the industry production, business activity, and services activity, and holding around 96 percent of Brazil Southeast GDP (IBGE 2017).
1.1.2 Electric vehicle potential as massive climate mitigation option
The reduction of anthropogenic greenhouse gas emissions is recognized as imperative to stabilize the Earth’s climate. The energy and transport sectors need to significantly reduce their GHG emissions in order to support the targets of the Paris Agreement of limiting the global temperature increase well below 2°C from the pre-industrial level, which requires the decarbonization of the transport by 2050 (Pachauri et al. 2014). Given this scenario, the electric vehicle (EV) has been assumed as an interesting alternative to the internal combustion engine (ICE). In the context of this thesis, the term ‘Electric Vehicle’ (EV) refers to a vehicle that uses electricity exclusively to propel the vehicle, and receives electricity by plugging into the electric system and storing the energy in batteries. It is synonymous with BEV, as detailed in Chapter II - State of the art in electric mobility. The EV engine is around 90 percent efficient and ICE engine around 20 percent (Eaves 2004). Therefore, EV reduces GHG emissions (cleaner at the same proportion of the renewables share in the power mix), and improves urban air quality, providing significant lower impact on climate change. EV is also pointed to as a case to support the transition for a circular economy specially when using renewable enegy (Sperling & Gordon 2010; Messagie 2014; IEA 2018a).
The GHG emission, by the LCA method, shows that EV emits less than the equivalent ICE model using the LCA method. EV reduces the overall emissions by 51 percent over the lifetime of the vehicle (Nealer et al. 2015). In 2018, in USA, China and United Kingdom all electric cars models emit less carbon dioxide per kilometer than the best-selling petrol vehicles (Gambhir et al. 2018). Besides that, the electric propulsion seems to be a better option specially in urban centers, because of their zero tailpipe emissions (Van Mierlo et al. 2017). More information about GHG emission by LCA principle is in topic 2.3.3 in this thesis. Although EV has potential to mitigate GHG emissions, EV shows slow and restricted diffusion in a small number of developed economies around the world. In 2006, only
twenty metropolitan areas accounted for about 40 percent of the global EV stock and 43 percent of EV sales (Hall et al. 2017). To become mainstream, EV must overcome the barriers that prevent its massive diffusion.
Among the main challenges to overcome is the implementation of electric vehicle supply equipment (EVSE) in appropriate volume by level1, type2 and suitable locations. This subject is even
more critical in most developing countries because of the limited resources for research investments. The creation or expansion of an EVSE network requires research to identify the main variables and attributes typical, and often unique to each region (Costa et al. 2018).
For EV mass-market deployment to take place, barriers from socio-economic transition involving socio-technical factors, environmental-political elements and innovations aspects (Steinhilber et al. 2013) must be overcome. The most common EV mass-market barriers are those of low range perception, lack of charging infrastructure, long time to recharge the batteries, and higher EV price acquisition than the fossil fuel equivalent model. However, there are several other types of barriers that can affect the mass diffusion of EV, as revealed in topic 2.4 of this thesis.
On the other hand, the transportation sector in Brazil offers other low emission vehicles, such as ethanol, which can also contribute to mitigate GHG emissions. However, research is needed to identify the most appropriate technology, the main challenges and opportunities associated with the mass penetration of low emission cars, and the impacts of the expansion in energy system and CO2 emissions.
1.2 Research questions
The main objective of the research presented in this thesis is to provide knowledge to support the possibility of electric vehicles becoming an alternative for the Brazilian market, as an effective climate mitigation option, while delivering the mobility service needed for the country’s development. For that purpose, the following specific research questions (RQ) were undertaken, for the case of Brazil. RQ#1: What is the most appropriate technology for the purpose of climate mitigation and energy consumption reduction in the case of Sao Paulo: electric or ethanol vehicle?
RQ#2: What will be the expected impacts of the likely expansion of electric mobility in Sao Paulo municipality, in terms of CO2 emissions and energy consumption and how effective are current public policies in place to promote such expansion?
RQ#3: How to overcome the barriers regarding the deployment of the charging infrastructure at the municipality level, in the case of Sao Paulo, Rio de Janeiro and Belo Horizonte?
RQ#4: What are the main perceived challenges and opportunities from the mass penetration of electric mobility in Brazil?
1.3 Research strategy
To answer the research questions listed in the previous section, a careful and comprehensive research strategy was adopted, supported by extensive literature review on the modeling methodologies available for each one. It was sought not only to identify the tools, but also to understand their efficiency and the critical factors in each application. The same principle was used to determine the methods of execution as well as the techniques of analysis. Figure 1.6 presents an overview of the methods adopted throughout the research to provide the answers to the research questions, which includes three main phases as explained below.
Figure 1.6 – Research scheme
Phase “A” –Climate mitigation and energy, energy consumption and appropriate
technology
This phase was carried out to answer questions RQ#1 – What is the most appropriate technology for the purpose of climate mitigation and energy consumption reduction in the case of Sao Paulo: electric or ethanol vehicle? And RQ#2 – What will be the expected impacts of the likely expansion of mobility in Sao Paulo municipality, in terms of CO2 emissions and energy consumption and how effective are current public policies in place to promote such expansion?
Prospective analysis (GODET, 1993) was used to construct scenarios that may influence the decisions regarding the expansion of EV in Brazil. Scenarios were built to tackle the uncertainty behind technical and optional aspects involving uncertain and complex scenarios for the mass diffusion of electric mobility in Brazil. Indeed, the expansion of EV depends on the performance of new and different
technologies and on how they impact environmental and energy issues. Using prospective analysis allowed identifying what would likely be the best technology for light duty vehicles (LDV) in Sao Paulo. Regarding the environmental issues involving the CO2 emissions of the LVD, as well as the energy issues aiming to understand the impacts on the generation of energy for diffusion of EV, a modeling system was used with elaboration of future scenarios capable of pointing out the environmental and energy impacts with EV mass-market.
The research focused on two major aspects. Firstly, the goal was to assess the energy and environmental impacts caused by scenarios of EV adoption instead of gasoline or ethanol. The replacement of fossil fuel and ethanol-powered passenger cars by EV was assessed. Regarding energy consumption, the study aimed to identify and quantify the increase in the electricity demand, as well as the saving of fossil fuels through a balance of energy consumption. The environmental issue focused on the elaboration of the CO2 emissions inventory (it was contemplated by the indirect emission from the increase of the electricity demand to attend EV penetration). In summary, the study aimed to identify the impacts of EV expansion considering the CO2 emissions and the energy aspects.
Secondly, the research aimed to identify if the diffusion of EV is suitable when compared with ethanol, since Brazil is the world’s leading producer of sugarcane ethanol (Filoso 2015) and has a broad ethanol support program. Ethanol is considered a fuel with less GHG emissions, when compared with fossil fuels (Florez 2015). In addition, Brazil is a major oil producer with vast oil reserves and incentive programs for its extraction. Therefore, the research aimed to identify, from the environmental and energy perspective, which technology can provide better benefits: EV, fossil fuel or ethanol cars. The following methods, techniques and tools were used.
i) The Top-Down and Bottom-up methods were used (in two different analyses) to organize information and process ordered data to meet a particular demand. The two methods usually required processing tools for their implementation and are widely used in various fields of knowledge, especially in the transport sector to determine fuel consumption and GHG emissions (Peng et al. 2015; Chavez-Baeza & Sheinbaum-Pardo 2014; Hong et al. 2016; Ruzzenenti & Basosi 2009).
The essence of the Top-Down method is to fragment processes, always from the largest to the smallest (or the upper-level to to the lower-level) of the studied subject. Through this method one can obtain a broad understanding of the studied subject. In the case of transport – the object of the study – the method was adopted to estimate emissions of pollutants from fuel consumption by road transport in the demarcated geographical area. (Peng et al. 2015; Chavez-Baeza & Sheinbaum-Pardo 2014; Hong et al. 2016; Ruzzenenti & Basosi 2009). The method uses fuel emission factors (not the vehicle).
ii) Well-to-Wheel (WTW) and Tank-to-Wheels (TTW) are used to evaluate energy efficiency and GHG emissions. The well-to-wheel analysis is commonly used to assess total energy consumption, or the energy conversion efficiency and emissions of motor vehicles, including their carbon footprint, and the fuels used in each of these transport modes. The WTW analysis "refers to specific lifecycle analysis applied to transportation fuels and their use in vehicles. The WTW stage includes resource extraction, fuel production, delivery of the fuel to vehicle, and end use of fuel in vehicle operations. Although feedstock for alternative fuels do not necessarily come from a well, the WTW terminology is adopted for transportation fuel analysis" (Verbruggen et al. 2011).
TTW is used to determine the efficiency of the vehicle based on fuel consumption. The TTW analysis considers the manufacturer's information about fuel consumption and emissions coefficients. Although widely used the techniques present approximate results, as there are several aspects that are difficult to be measure; i.e. conditions of use of the vehicle, driving style, conditions of maintenance of the vehicle. The WTW techniques differ from the LCA method because they do not consider energy and emissions involved in building facilities and the vehicles, or end of life aspects.
iii) In order to identify the most appropriate technology, indicators and coefficients from the life cycle assessment (LCA) method, available in the literature and adopted by the Brazilian government were used. The LCA method is widely used in transport (Nealer et al. 2015) to identify benefits for EV compared to ICEV (Ellingsen et al. 2016); to identify how clean they are EV (Hooftman et al. 2016) compared to the measure GHG emissions from fossil fuel vehicles (Anair & Mahmassani 2012; Van Mierlo et al. 2017); to EV charged using coal-based electricity (Ellingsen et al. 2016); to the analysis of ethanol and hydrous ethanol emissions (Florez 2015; Ometto et al. 2009) or to clarify the differences presented in several LCA studies (Nordelöf et al. 2014). For the Brazilian case, the method was adopted to compare the environmental impacts between cars using ethanol and EV.
iv) Secondary data methodology analysis (SDMA) is all the data collected and made available by the respective sources, including census data, data collected from reports or government databases, organizational records. Secondary data analysis is well-known and a well-established methodology for re-using quantitative data in social research (Dale et al. 1988; Hakim 1982). The recourse to secondary data was essential for this research, as it is the natural way to properly capture past changes and / or developments. Among the main advantages of using secondary data are (Heaton 2008).
i. It makes the study possible (it is often not possible to complete a study without recourse to secondary data),
ii. It is faster to get than primary data, iii. It is more affordable to obtain,
iv. It specifies the primary data (with the help of secondary data, we can identify gaps and deficiencies and what additional information needs to be collected).
Among the disadvantages are cited bellow.
i. It is not always available in the desired format, ii. It has limitation of access to clarify divergences
The analysis of secondary data was adequate to compare CO2 emissions and public policies adopted by the largest Brazilian city and the city of Shanghai in China in relation to the first decade of 2000 (Costa et al. 2018). Both these Brazilian and Chinese cities seek to reduce emissions from road transport and are the gateways to new technologies in their respective countries. The method of analysis of secondary data allowed the evaluation of the emissions and public policies adopted by two cities.
v) Long-range Energy Alternatives Planning (LEAP) is an integrated modeling tool used to track energy consumption, production and resource extraction in various sectors of the economy. LEAP is able to evaluate GHG emissions from the production chain involving the extraction of raw material, processing, distribution and combustion, which can provide a more efficient use of energy. In addition, LEAP can be used to assess emissions of local and regional air pollutants and short-lived climate pollutants (SLCPs), which makes it suitable for studies to assess the climate benefits derived from the reduction of local air pollution.
LEAP is a widely-used software tool for energy policy analysis and climate change mitigation assessment (SEI 2018). Developed by the Stockholm Environment Institute, LEAP is generally used to analyze national energy systems. Around 190 countries – including government agencies, academics, NGOs, consulting firms and energy companies – use the LEAP modeling tool (SEI 2018).
LEAP has become an interesting option for the Brazilian study because it is an adequate tool to evaluate applications in energy (Gajjar, H. & Mondol 2016; Gil. 2011), environment (HAO 2015), and in the transport sector (MVX 2014). For the present study, LEAP was used to simulate scenarios of energy consumption and CO2 emissions from urban road transport.
Phase “B” – Charging infrastructure
This phase was carried out to answer question RQ#3 – How to overcome the barriers regarding the deployment of the charging infrastructure at the municipality level, in the case of Sao Paulo, Rio de Janeiro and Belo Horizonte? A set of case studies and spatial analysis were performed. As the investigation required the application of in-depth qualitative and quantitative methods involving groups of specialists in electrical mobility and consequent analysis and evaluation of the information collected, the case study was timely. The case study proved to be a valuable resource in view of the need to reveal the complexity of the optimized construction of a charging network for EV in three large Brazilian municipalities.
Systems (GIS) and Analytical Hierarchy Process (AHP), it was possible to determine the best location within the delimited areas for the different levels of EV charging equipment, thus indicating the opportunities and the critical factors for the creation of a network of EVSE in three large Brazilian municipalities. This phase also included a modeling and prospective analysis system, as shown in Figure 1.7.
In order to evaluate the infrastructure to support the diffusion of EV in the studied region, three case studies were assessed. One specific study for the municipality of Sao Paulo was based on geographic data of 96 districts, and two complementary case studies: one for the municipality of Rio de Janeiro carried out based on 33 districts, and a second for the municipality of Belo Horizonte considering 487 neighborhoods (one preliminary study was carried out to consider nine administrative regions).
The accomplishment of the two complementary case studies’ analysis was important to evaluate possible similarities and differences in the ideal location of an EVSE network, since they are the three largest municipalities (in GDP, fleet of vehicles and population) of the Brazilian Southeast. These are responsible for more than 50 percent of the Brazilian GDP (IBGE 2015) and can be considered as leading markets for penetration of new technologies in Brazil. The analysis of the three Brazilian large municipalities may give policymakers and stakeholders feasible information for future projects and investments in the diffusion of electric mobility in Brazil. The development for the analysis was supported in the following methodologies, technique and tools of modeling.
i) Multi-criteria Decision Making (MCDM) is a method used to explicitly evaluate several conflicting criteria in decision making; i.e. in a car purchase process cost, comfort, safety, and fuel economy may be some of the main criteria to be considered. The method aims to reduce the risks in decision making of complex issues involving multiple criteria. Attempts to find the best trade-off decisions have been around for a long time. The first attempts to create a method to deal with the trade-off in important decisions came with Benjamin Franklin (Köksalan et al. 2011) who addressed the issue of multiple objective mathematical programming.
However, MCDM emerged as a method in the 1950s with the publication of "The Theory of Decision Making" by Ward Edward and the book "The Behavior Model of Rational Choice" published in 1955 by Herbert A. Simon. From the 1970s the MCDM method became popular with Simon (won the Nobel Prize in Economics in 1978) and he published a series of studies on MCDM (Köksalan et al. 2011).
The MCDM method provides the consistent analysis of distinct qualitative and quantitative variables giving more consistency to the choice process, thus becoming widely used in various disciplines such as the environment, energy (Kylili et al. 2016) and transport (Costa et al. 2017; Costa et al. 2018). The MCDM method becomes even more important in incipient issues and as with little information available, such as the infrastructure for EV, thus requiring maximum assertiveness (Coelho et al. 2012). The method relies on a wide variety of software to support its implementation, such as the
Geographic Information System GIS, which was adapted to the development of the Brazilians’ case studies.
ii) Weighted Linear Combination (WLC) is an analytical technique commonly used to assist in decision-making involving multi-attribute problem processes in which more than one attribute should be evaluated. After attributes are treated according to their importance (through weight assignment) the results are generated with spatial characteristics. The results obtained after generation of the respective weights (AHP for the Brazilian study) will be used for the WLC processing in the modulation tool (GIS for the Brazilian study). The WLC technique applied in the GIS tool must follow the following steps: 1) definition of the attributes; 2) identification of possible alternatives; 3) alignment of the maps considering the attributes; 4) definition of criteria (attribute importance); 5) perform the processing according to the scoring of each cell; and 6) order according to the total score of each attribute (Malczewski 2000).
The WLC approach is widely used in decision rules in the GIS environment (Hopkins 1977, Tomlin 1990, Eastman et al. 1993). One of its most common applications is land use analysis, site adequacy and selection, as well as resource assessment problems (Hobbs 1980; Han 1988), geographic analysis and land use (Duc 2006; Aruldoss et al. 2013) and transport and infrastructure (Abbasi & Seyedhoseini 2011; Terh & Cao 2018). The WLC technique (adopted in the Brazilian study) was implemented in the GIS environment (ArcGIS for Desktop 10.3 software) with the support of map reclassification and algebra tools (AHP provided attribute weights). The weighted linear combination allowed for the performance of the processing considering the weights assigned in relation to the selected variables and in a geo-referenced form.
iii) Analytical Hierarchy Process (AHP) is a technique that involves organizing data in a structured way to provide analysis clarity for complex and group decision-making. The AHP technique is based on mathematical and psychological foundations (Saaty 2008). The AHP technique selected criteria or alternatives respecting a certain criterion, in a natural, pairwise mode. AHP uses a range of absolute numbers to capture individual preferences over attributes that can be quantitative and qualitative to facilitate the solution of complex problems (Forman & Gass 2001).
In summary, the AHP converts the individual preferences into weights of reason scale and can be used to compare and classify the alternatives, thus facilitating the process of choice. The AHP consists of three basic functions: structuring complexity, measuring a ratio scale, and synthesizing. If processed in a structured way it is able to help simple people make complex decisions (Forman & Gass 2001). The AHP technique assigns attributes to attribute weights taking into account three basic steps (Lin et al. 2014): creating a hierarchical structure of factors influence; structuring a judgment matrix consisting of
compared on a peer-by-peer basis, ranked according to the example of Saaty (1990). The AHP technique was developed by Thomas L. Saaty who worked since the 1970s to find a way to facilitate decisions involving complex problems, but it was in the 1990s when Saaty lectured at Wharton School that he found the form he considered ideal giving it the name Analytical Hierarchy Process (Forman & Gass 2001). The AHP technique is widely used by various organizations such as universities, companies and governments. In the Brazilian study the AHP was adopted combined with the MCDM methodology to facilitate the decision process about the choice of the best location for the implementation of an EVSE network (Costa et al. 2018).
iv) The Geographic Information System (GIS) is a software tool developed to treat spatial information with the goal of collecting, storing, retrieving, manipulating, visualizing and analyzing spatially referenced data in a known coordinate system in order to facilitate the generation of geographic information (maps) and facilitate the process of analysis, management or representation of space and the phenomena that occur in it (Clarke 1986; Maliene et al. 2011). The emergence of the GIS system began in the 1960s with the contribution of English geographer Roger F. Tomlinson3 considered the first to use computerized mapping in studies conducted in Canada. Later the system became known as ARDA Data Coordinate System, assuming a few years later the current name Geographic Information System (GIS). For his contributions, Tomlinson is considered the "father of GIS" and received several awards (Rura et al. 2014).
Figure 1.7 – Structure of data processing for Brazilian case studies
In the 1970s, the first vector GIS called ODYSSEY GIS, developed by Harvard Laboratory Computer Graphics, emerged. In the 1980s, several software companies provided several enhancements to the GIS system. Esri, one of the companies that contributed to the enhancement of GIS, has become
3There is record stating that the history of GIS all started in 1854 with the British physician John Snow began mapping
the world's leading GIS software company. GIS can aggregate different processes, techniques, and methods that enable the integration with other technologies. GIS provides various applications and is used in many areas such as engineering, planning, management, transportation, logistics, insurance, telecommunications, marketing, business. (Maliene et al. 2011).
For the studies conducted in Brazil the GIS processed information that was structured according to the data shown in Figure 1.7. GIS was adopted to support the Brazilian study because it is a tool widely used to accurately identify the desired spatial location and is used in several other similar studies (Church 2002; Hakimi 1964), including in Brazil where GIS is widely used for studies in various segments such as energy (Tíba et al. 2010), and transport (Lopes et al. 2014). For the present research, the GIS was used to identify the best location for EV charging infrastructure (Costa et al. 2018; Costa et al. 2017).
Phase “C”: Challenges and opportunities from massive adoption of electric vehicles
This phase was carried out to answer question RQ#4 – What are the main perceived challenges and opportunities from the mass penetration of electric mobility in Brazil? The research with the stakeholders of electric mobility in Brazil was the most efficient since it was necessary to identify new knowledge from the accumulation of information obtained from Brazilian electric mobility stakeholders and specialists. With the research, it was possible to gather data from multiple sectors and people with different specialties and characteristics, providing - with the use of consistent techniques and methods - new knowledge capable of identifying opportunities and challenges for the future of electric mobility in Brazil. To valuate socio-technical issues, innovation-environmental and political-economic factors to adequately assess the challenges and opportunities of EV diffusion for the Brazilian case the following method, the following technique and tools were adopted.i) SWOT analysis considers strengths to be tangible and intangible positive attributes capable of supporting business success. It is a strategic planning method used to evaluate the strengths (characteristics of the business or project that gives it an advantage over others), weaknesses (characteristics that place a business or a project at a disadvantage relative to others), opportunities (external factors capable of benefiting the evolution of the institution and threats are considered externalities capable of hindering the achievement of the desired results), and threats (elements in the environment that could cause trouble for the business or project) in the business area or adapted for other areas (Dyson 2004). The SWOT method also examines the object of study considering the possibilities of growth, development, survival and maintenance.
The invention of the SWOT method is attributed to prof. Albert S. Humphrey, who led a research project at the Stanford Research Institute (now SRI International) in the 1960s and 1970s (Arslan & Er
organization and the external environment in which the institution is inserted (external factors: the opportunities and threats presented by the environment external to the organization). The analysis of the internal factors (frank and strong points) must take into account not only the current situation under analysis, but also the objectives of the institution under study. The external factors can be macroeconomic, technological changes, legislation and socio-cultural events, as well as the foreseeable changes in the market and the factors of competitiveness (Dyson 2004).
SWOT analysis has expanded into many areas beyond the business sector. For example, the transport sector often uses the SWOT matrix to evaluate mobility projects (Gil et al. 2011; Barrella et al. 2013), thus revealing that it is appropriate to examine the object of study, from the Brazilian automotive industry perspective.
ii) Statistical Package for the Social Sciences (SPSS) is the original name of the software (currently IBM SPSS Statistics) created in 1968 to meet the need for statistical analysis of the social sciences. The invention is attributed to Norman H. Nie, C. Hadlai and Dale H. Bent. Initially, between 1969 and 1975, SPSS was represented by the National Opinion Research Center of the University of Chicago, USA (Nie et al. 1975). Before 1983, the program aimed at large computers, popularized among institutions of higher education, especially in the USA. In 1984 a version was released for personal computers. Regarding the Brazilian study case, the SPSS was adopted to perform cross-analysis among the different groups represented in the survey.
iii) "Encuestafacil" is an online tool that works through the internet to conduct a survey. The tool is widely used in Europe and Latin America. The "Encuestafacil is a relatively simple and fast software that allows customization and permits the export of data to other tools. The flexibility of the "Encuestafacil” survey – e.g. allowing the respondent to save the information from the survey and continue filling it on another occasion – as well as the clarity of the reports – e.g. information such as open, partially answered or fully answered questionnaires are reported online – simplify the follow-up, the interaction with respondents, and provide speed and improvement in the response rate.
The "Encuestafacil" tool also allows the execution of pre-tests, which helps in improving the questionnaire and consequently optimizing the results. The fact that the tool is in widespread use in Brazil advantaged the interaction with the respondents and contributed to a rapid return of the answers. The biggest obstacle was preventing quiz submissions from being blocked by guests' firewalls. In this study the SWOT analysis was used to analyze the critical factors to the opportunities for the expansion of EV in Brazil. The SPSS tool was used for the elaboration of cross-analyses and the Encuestafacil software for sending and managing of questionnaires and research
1.4 Case studies
Brazil is a big country with many differences across the regions. For this work, different case studies were adopted as a strategy to deal with a coherent and structured transport system, conditioned by specific physical characteristics of each case.