MANAGEMENT OF NORTHERN ATLANTIC BLUEFIN TUNA:
THE TIME CONSISTENCY OF THE COOPERATIVE
MANAGEMENT SOLUTION
*Ana Brasão†
Faculdade de Economia, Universidade Nova de Lisboa
January 2000
Abstract
The purpose of this paper is to examine the stability of the cooperative management agreement of the North Atlantic Bluefin tuna fisheries over time, as the stock recovers, assuming that the players were engaged in previous cooperation for a certain period of time.
This analysis is focused on the sharing of the total net returns from cooperation using the concept of Shapley value. It is based on simulation and optimization results from a multi-gear age structured bio-economic model both for the East and the West Atlantic and assumes that the nations were initially in cooperation for either 5 or 15 years.
In general terms, the results show, as expected, that the net present values from both cooperation and non-cooperation increase as the stock recovers. Nevertheless, the latter increases more than the former and consequently, the net gains from cooperation decrease.
More specific results are obtained for the East and West Atlantic. In the former, it is proved that, the net bargaining power decrease and, as a result, the shares of the net gains from cooperation based on the Shapley Value tend to be equalized, that is, we tend to the Nash bargaining solution. In the latter, the bargaining power may increase and the trend for the equality is not clear. In both, cases there are situations in which the cooperative solution is in the core of the game, meaning that no other strategy yields better outcomes for the players.
Keywords: Shapley value, time consistency, Bluefin tuna, cooperative games
*
This paper is part of the project PL96.1778 – “The Management of High Seas Fisheries”, financed by the European Commission. This document does not necessarily reflect the views of the Commission of the European Communities and in no case anticipates the Commission’s position in this domain.
2
Contents
1. INTRODUCTION ...3
2. THE SETTING ...4
3. RESULTS FOR THE EAST ATLANTIC...7
3.1 CASE 1 ...8
3.2 CASE 2 ...10
4. RESULTS FOR THE WEST ATLANTIC...10
4.1 CASE 1 ...11 4.2 CASE 2 ...12 5. CONCLUSIONS ...13 6. REFERENCES ...14 7. APPENDIX ...15 7.1. EAST ATLANTIC...15
Table 2: v*(K) – Case 1 after 5 years of cooperation ...15
Table 3: Shapley Value – Case 1 after 5 years of cooperation...15
Table 5: v*(K) – Case 1 after 15 years of cooperation...16
Table 6: Shapley Value – Case 1 after 5 years of cooperation...16
Table 8: v*(K) – Case 2 after 5 years of cooperation...16
Table 9: Shapley Value – Case 2 after 5 years of cooperation...17
Table 11: v*(K) – Case 2 after 15 years of cooperation ...17
Table 12: Shapley Value – Case 2 after 15 years of cooperation...17
7.2. WEST ATLANTIC...18
Table 14: v*(K) – Case 1 after 5 years of cooperation...18
Table 15: Shapley Value – Case 1 after 5 years of cooperation...18
Table 17: v*(K) – Case 1 after 15 years of cooperation ...19
Table 18: Shapley Value – Case 1 after 15 years of cooperation...19
Table 20: v*(K) – Case 2 after 5 years of cooperation...19
Table 21: Shapley Value – Case 2 after 5 years of cooperation...20
Table 23: v*(K) – Case 2 after 15 years of cooperation ...20
Table 24: Shapley Value – Case 2 after 15 years of cooperation...20
7.3 WEST ATLANTIC – CASE 2– ELL AND ER&R EQUAL TO E95 ...21
Table 26: v*(K) – Case 2 after 5 years of cooperation...21
Table 27: Shapley Value – Case 2 after 15 years of cooperation...21
Table 29: v*(K) – Case 2 after 15 years of cooperation ...22
Table 27: Shapley Value – Case 2 after 15 years of cooperation...22
†
The Author is a Graduate Student at Universidade Nova de Lisboa, Faculdade de Economia. Address: Travessa Estevão Pinto, 1070 Lisboa. Telephone: 351-1-3933624: E-mail: PL1778@feunix.fe.unl.pt
3
1. Introduction
According to Munro (1998), the management of highly migratory species is a key issue in the management of ocean fisheries. Several examples of endangers species are found, namely the case of Northern Atlantic Bluefin tuna. This species have been harvested by several countries leading to its overexploitation. Therefore, it urges to enforce optimal policies through Regional Fisheries Management Organization (RFMO) as suggested by the UN Agreement, in such a way that the nations search for cooperation in the sustainable use of the resource (Munro 1998,1999).
For the particular case of the Bluefin tuna, the cooperative management solution was developed in Pintassilgo, 1999. The main result show as expected that significant gains can be attained from cooperation and a particular cooperative solution based on the Shapley Value was applied as a way of sharing the benefits from cooperation (Duarte, Brasão and Pintassilgo, 1999). This solution concept divides the gains in accordance to each player’s average contribution for the coalition payoffs. It is relevant to enhance that this case study points out some particular cases where the distribution of gains according to the Shapley value is not enough to guarantee cooperation. That is to say that the cooperative agreement is not stable, meaning that there is another strategy that could yield a higher outcome to one of the players.
Once a strategy of cooperation is essential for the preservation of Bluefin tuna, it is interesting to examine how the payoffs of this strategy will evolve over time
The present analysis is based on a multi-gear, multi-age structured bio-economic model developed both for the East and the West Atlantic and the purpose is to re-examine the cooperative solution defined after 5 and 15 years of initial cooperation whose result is a stock recovery. Specifically, it is relevant to examine the effects of a stock recovery on the optimal policy, on the cooperative strategy and on the distribution of gains based on the Shapley Value.
4 In general terms, the results prove that as the stock recovers, that is as more years of initial cooperation are allowed, the net present values of both cooperation and non-cooperation increase. Note, however, that the latter increase is greater than the former, thus the net gains from cooperation tend to decrease.
More specific results are obtained for the East and West Atlantic fisheries. In the former, the bargaining power of the coalitions decreases and attain zero as the stock recovers. As a consequence, the shares of the net gains from cooperation based on the Shapley value tend to be equalized that is, tend to the Nash bargaining solution. In the latter, there are cases where the bargaining power of the coalitions increase and the trend of the shares mentioned above is not clear. In both cases, though, there are situations in which the cooperative solution becomes stable.
This paper is organized as follows: In section 2, a brief discription of the Bluefin tuna fishery is presented. In section 3, the setting of the game is defined. In section 4, the results of the optimal management as well as the coalitions are presented and examined for the East Atlantic. Section 5 presents a similar analysis for the West Atlantic. Finally, section 6 concludes the paper.
2. The setting
The approach followed is based on the work developed in Duarte, Brasão and Pintassilgo 19991. A similar setting is adopted with the same players both for the East and the West Atlantic2. Nevertheless, a brief description is given.
Consider a conservation and management of highly migratory stocks by a Regional Fisheries Management Organization (RFMO). In this paper, two RFMO are considered, for the East and West Atlantic respectively. Each of them is composed of 3 members,
1
A simplification of the initial model was undertaken but the main results in the referred work remain unchanged.
5 denoted from hereon Charter Members. In the East Atlantic the members are: European Union (EU), the distant water fishing nations (DWFN) and the other coastal states (OCS). For the West Atlantic they are: DWFN, USA and Canada (CAN). Each of these countries catch Bluefin tuna using different fishing gears. In the East Atlantic the gears are: the longline (LL), the purse seine (PS), the trap, the baitboat (BB) and the remainder (the set off all other gears). In the West there are the longline, the purse seine, the rod and reel and finally the remainder. It is assumed that these are the only participants in the negotiation processes for managing the Bluefin tuna stock.
The non-cooperative solution or threat point of this game is the open access simulation derived by the bio-economic model (see Pintassilgo et al. 1999), whereas the cooperative solution or grand coalition is considered to be the fixed fishing strategy for each gear that maximizes the net present value (NPV)3. In this particular study, the optimal strategy is always a constant fishing effort.
Based on the bio-economic model, an optimization routine is used to choose the optimal management fixed strategy (constant level of effort), that is, the one that maximizes net present value of profits for all gears in the 25-year period.
Two different scenarios are examined: in the first, the players have already cooperated for five years, when the RFMO decides to re-examine the cooperative agreement. In the second scenario the cooperative management solution is re-negotiated after 15 years of initial cooperation. The reason for this particular division in time is to study the impact of the stock recovery on the results, that is, after 5 years of cooperation it is possible to observe some increase in the stock, meaning some impact on the relevant variables, which is expected to be enhanced after 15 years of cooperation. Note that each
2
We recommend the reader to see the work by Duarte, Brasão and Pintassilgo (1999) for more detailed information on the subject.
3
The fishing gears are explained in Duarte et all (1999). A 4% discount rate was assumed to be reasonable and it is in accordance with other applied studies, using similar investment horizons, such as the “Final Environmental Impact Statement for the Western Atlantic Bluefin Tuna” (1995).
6 management policy is re-defined for the next 25 years. In each case, the new initial conditions are the values obtained from the cooperation in the moment of revision. Within each scenario two cases are studied: the restricted (case 1) and unrestricted optimization (case 2). In the former, it is assumed that all gears will be maintained active and that the optimal strategies for each gear will be proportional to their relative importance in 1995, although the initial conditions now are those of the years 2000 and 2010 respectively. As was said in Duarte, Brasão and Pintassilgo (1999), this scenario imposes some restrictions to the optimal management of this stock but it is certainly a realistic base for a cooperative agreement. Concerning the unrestricted optimization, the cooperative strategy is characterized by letting all members to choose the composition of their fleets optimally. In this case, it is assumed that the gears that were initially optimally forbidden to catch are now allowed to do so in non-cooperation whenever the strategy is re-examined4. Considering that these gears catch species other than the Bluefin tuna, it was assumed that 10% of the fishing effort in 1995 in directed to this species. In both cases, the assumption of a re-entry with the fishing effort of 1995 was also tested.
The set of all possible coalitions for this game is: ({EU, OCS, DWFN}, {EU, DWFN}, {EU, OCS}, {DWFN, OCS}, {EU}, {DWFN}, {OCS}, {Ø}).
In the two player coalitions, the model assumes that the third party, which is outside the coalition, is catching Bluefin tuna in open access following the market dynamics established in Pintassilgo 1999.
As in Kaitala and Lindroos 1997, it is assumed that agreements upon being achieved are binding and that side payments among the players are a feasible policy instrument.
4
7 The concept of Shapley value is applied to define a fair way to allocate extra benefits of cooperation between the fishing nations. Let the Shapley value be the imputation Z=(Z1, Z2, Z3) defined by:
( )
(
{}
)
[
]
(
) (
)
∑
⊂ − − − − = M K i ! m ! k m ! 1 k i K v K v Zwhere K includes all the coalitions to which member i belongs, M is the set of all possible coalitions, k denotes the number of elements in K and m is the total number of players. Also, v(K)=v*(K)/e(X), where v*(K) measures the increase in NPV achievable with this coalition K and e(X) denotes the net global gains from cooperation to be shared among the Charter Members, v(K-{i}) defines the value of coalition K excluding the member i. Therefore (v(K)- v(K-{i})) represents the contribution of member i to the coalition K.
This means that the players have already agreed to cooperate with one another. Thus the grand coalition, including all players exists at the beginning of the game. The choice upon this concept was based on the fact that it exists in finite games and identical players will be treated equally.
It is important to refer that an agreement is considered to be stable if no player can do better in any other situation.
3. Results for the East Atlantic
The purpose of this section is to discuss the changes in the cooperative management solution that arise from re-examining the optimal policy in the East Atlantic, after allowing for five and fifteen years of initial cooperation, respectively. Additionally, the distribution of the gains from cooperation according to the Shapley value is examined.
8 This section is divided into two subsections: subsection 3.1 where case 1 is examined both for 5 and 15 years of initial cooperation and subsection 3.2 which follows the same guidelines for case 2.
3.1 Case 1
The immediate consequence of an initial cooperation among players, either for five or fifteen years, is a recovery of the Bluefin tuna stock. As a consequence, whenever the cooperative strategy is re-defined, the optimal policy is to increase the fishing effort compared to the effort in the years 2000 and 2010 respectively, which are identical as a constant effort instrument was defined. The net present values of both the non-cooperation and the cooperation increase, as can be seen in Table 1 in the appendix. Nevertheless, the net global gains from cooperation to be shared among the Charter Members decrease as the stock recovers:
e(X2000) = 1,670,400,000 – 920,850,000 = 749,550,000 USD e(X2010) = 2,332,300,000 - 2,187,300,000 = 145,000,000 USD
where e(X2000) and e(X2010) are respectively, the net gains from cooperation after 5 and 15 years of initial cooperation. X2000 and X2010 are the levels of stock in the years 2000 and 2010. As the stock recovers, the non-cooperation becomes more profitable when compared with the cooperative solution. Recall that the net global return is equal to the present value of cooperative solution less the sum of the threat points of each Charter member (Duarte et al. 1999).
Focusing on the two-player coalitions, there are situations, namely when EU_DWFN and EU_OCS bind together, where the total net present value is higher than in cooperation. The reason is the high net present values experienced by DWFN and OCS, respectively, in open access. These two countries have a clear incentive not to cooperate and are responsible for the instability of the cooperative agreement. In fact,
9 from Tables 1-6 in the appendix, what they receive with cooperation plus the side payment is not enough to create the incentive for cooperating as there are other strategies, namely non cooperation, that yield an higher outcome for both players. Thus the cooperative solution is not in the core of the game.
All the two-player coalitions deplete the stock before the 25 years are over, but later than non-cooperation, which depletes the stock within 11 years. Thus, the worse strategy concerning the conservation of the Bluefin tuna stock continues to be the latter.
The bargaining power of the coalitions decreases and, after 15 years of initial cooperation, it reaches zero for all but the grand coalition (table 5). This means that no individual nor two-player coalition is able to do better than in non-cooperation, so that each player’s contribution to the grand coalition is exactly the same. The result is a trend for an equality of the shares of the net gains from cooperation based on the Shapley value, that is, the latter coincides with the Nash bargaining solution. The EU is the only player interested in the cooperative solution, in the sense that it gains a lot from cooperation and thus is the net contributor and will have to transfer to the other members some of the profits generated by its own fleet. With a higher stock level, the OCS will also become net contributor.
From the analysis, it seems that, given our model, the increase in the Bluefin tuna stock leads to a cooperative solution that is more and more unstable, since the incentives to non-cooperate increase. The Shapley value and the side payments do not guarantee the stability of the agreement. Nevertheless, as it was discussed in Duarte et all, the legal restriction of the UN agreement concerning the non-members will deal with the DWFN prohibiting them to catch unless they become members of the RFMO and abide by its rules. It is, therefore, essential for increasing the effectiveness of the management solution. The OCS represent a free rider problem since they are allowed to catch in their own EEZ.
10
3.2 Case 2
In this section, the fishing gears that were in the initial solution forbidden to catch are assumed to integrate the fishery with an effort equal to 10% of that in 1995, in the non-cooperative solution.
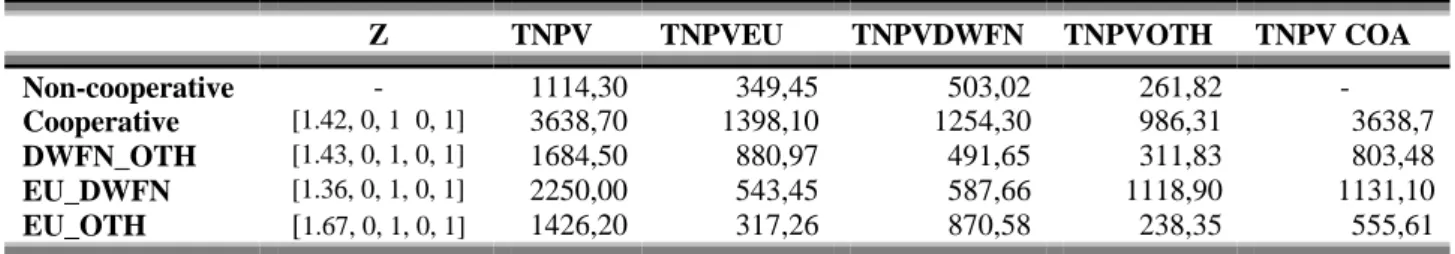
The results obtained in this case are quite different. In contrast with the previous results, the trend is to eliminate all the incentives of non-cooperation. Again, there is an increase in the net present values from both cooperation and non-cooperation, and a decrease in the net global gains from cooperation.
e(X2000) = 3 638 700 000 – 1 114 300 000 = 2 524 400 000 USD e(X2010) = 5 859 700 000 – 3 945 300 000 = 1 914 400 000 USD
Note that the optimal fishing effort increases considerably. Therefore, the fishing gears are not able to do better by non-cooperating. In that sense, the incentives to break the agreement are reduced. In the last resort, after 15 years of initial cooperation, there are no incentives to break the agreement and the cooperative solution is stable as it is in the core of the game.
Again, the bargaining power tends to zero and the shares tend to be equal. The net contributor is initially EU but, as the stock recovers, it turns out to be the DWFN, as it gains substantially from cooperation.
A similar analysis was undertaken assuming that purse seine and baitboat (the two gears initially outside the fishery) rejoin the fishery with an effort identical to that in 1995. The results obtained do not differ from the previous ones.
4. Results for the West Atlantic
This section follows a similar structure as the previous section but for the West Atlantic. The results are presented for case 1 and case 2.
11
4.1 Case 1
In this case, as expected, there is an increase in the optimal fishing effort as the stock recovers (table 13). This implies again an increase in the net present value of both cooperation and non-cooperation. The result is a decrease in the net gains from cooperation.
e(X2000) = 79 960 000 – 33 250 000 = 46 710 000 USD e(X2010) = 101 040 000 – 61 990 000 = 39 050 000 USD
After 5 years of initial cooperation both the DWFN and CAN have incentives not to follow cooperation. As the stock recovers more, CAN is still not willing to cooperate and thus the co-operative agreement is not in the core of the game. Focusing on the two-player coalitions, the coalition DWFN_CAN where USA is in open access depletes the Bluefin tuna stock before the end of the simulation period whereas the other coalitions do not deplete the stock. This means that USA is the only player capable of leading the stock to depletion once catching in open access.
The coalitions that include the USA have significant bargaining power. This means that this nation receives the highest share of the net gains from cooperation, followed by DWFN and finally CAN. As the stock recovers, there is a slight trend for the equality of the shares (at a slower rate than in the East Atlantic).
The net contributors to this agreement are the USA and CAN.
In the case of the West Atlantic, the free ride problem comes from the Canadian side. The net present value received from breaking the cooperative solution overcomes the net present value of cooperation plus the side payment. This is a serious problem, which can put at risk the UN agreement for the West Atlantic. One way to overcome this is to distribute the gains from cooperation in a different way as to compensate Canada by an amount at least equal to that received by breaking the agreement, as discussed in
12 Duarte et al. This means that the concept of Shapley value is no longer valid in order to ensure a stable agreement.
4.2 Case 2
Again, it is assumed that the gears that were initially and optimally left outside the fishery, are allowed to re-enter with an effort of 10% of that in 1995. The result is an increase in net present value of cooperation and non-cooperation. The DWFN that was not able to catch is allowed to do so in non-cooperation and has a positive outcome. Both DWFN and CAN experience higher net present values breaking the agreement than otherwise. However, as the stock recovers more (15 years of initial cooperation), they are both compensated through side payments from Shapley Value. Thus, the cooperative solution is in the core of the game.
It is important to refer that the coalitions including USA have a significant bargaining power, namely 96% for USA_CAN. As a consequence, this member receives the highest share of the net gains from cooperation, and DWFN the lowest as it is just compensated to agree to cooperate. In this case, there is no trend to reach the Nash bargaining solution. In fact, the shares of the Shapley value remain different for each player.
The same exercise was undertaken assuming that instead of re-entering the fishery with 10% of the 1995 effort, the gears are allowed to re-enter with the same level of effort. The basis for this assumption is that with the longline and the rod and reel it seems realistic that they redirected its effort to target another species in the meantime. In that way, it is feasible to have all this effort redirected again to Bluefin tuna, once there is permission to catch.
In this case, the results are quite different. The cooperative solution is no longer stable. Additionally, and expected is the fact that, as the net present value of DWFN
13 when it breaks the agreement is higher (higher initial level of effort), the share of the benefits given to this player has to increase and, as a consequence, the share of the USA decreases.
This leads us to conclude that the higher the effort in open access, the higher the instability of the agreement. In fact, an agreement that starts by being stable may turn out to be unstable.
5. Conclusions
The present work examined how the cooperative management solution defined for Bluefin tuna evolved over time. In particular, it examined how the cooperative game evolve after five and fifteen years of initial cooperation respectively.
The outcomes of the strategies of all possible coalitions were simulated and the concept of the Shapley value was used to distribute the net gains from cooperation.
The general conclusions point to an increase of the net present value of both cooperation and non-cooperation owing to the stock recovery. However, the latter increase overcomes the former leading to a decrease in the total net returns from cooperation.
For the East Atlantic, the bargaining power of the coalition is reduced and reaches zero as the stock recovers. The shares of the net gains from cooperation tend to the Nash bargaining solution. Specifically for case 2, the cooperative solution is in the core of the game as it becomes stable with the recovery of the stock and DWFN become the net contributor to this game.
Concerning the West Atlantic, the result point out to a cooperative solution, which is unstable in the restricted case. In the unrestricted case, the same solution is stable if the fishing gears initially outside the fishery are allowed to re-enter with an effort equal to 10% of that in 1995 and is unstable if the effort is equal to that in 1995. In both
14 unrestricted cases, the bargaining power of the coalitions increase and there is not a clear evidence that the shares of the net gains from cooperation based of the Shapley value tend to equality.
Again, there are still some weaknesses of the co-operative agreement as both the Coastal States and Canada have clear incentives not to participate in it, namely when we consider case 1. Thus, there remains a threat to the sustainable management of the resource, as the stock will be depleted in the long run.
6. References
[1] Asheim, Geri B., (1997), Individual and Collective Time-Consistency, Review of Economic Studies,
64 (3), July 1997, 427-43.
[2] Barro, R., and Gordon, G. (1983), Rules, Discretion and Reputation in a Model of Monetary Policy,
Journal of Monetary Economics, 12, 101-121.
[3] Blanchard, Olivier, Fischer, Stanley (1993), Lectures on Macroeconomics, The MIT Press.
[4] Duarte, C., Brasão, A., and Pintassilgo, P. (1999) Management of Northern Atlantic Bluefin Tuna: An
Application to the Shapley Value. Working Paper nº 354, FEUNL.
[5] Fisher, Stanley (1980), Dynamic Inconsistency, Cooperation and the Benevolent Dissembling
Government, Journal of Economic Dynamic and Control, 2, 93-107.
[6] Kaitala, V., Lindroos, M., (1998) Sharing the Benefits of Cooperation in High Seas Fisheries: A
Characteristic Function Game Approach. Natural Resource Modeling, Vol. 11, 87-108.
[7] Kydland, F.E., Prescott (1977), Rules rather than discretion: The inconsistencyof optimal plans,
Journal of Political Economy, 85, June, 473-491.
[8] Lindroos, M., (1998), Management of Regional Fisheries Organizations: An Application of the
Shapley value. Helsinki University of Tecnology, Systems Analysis Laboratory Research Reports, A76.
[9] Munro, G.,(1999), An Economic Review of the United Nations Agreement for the Implementation of
the United Nations Convention on the Law of the Sea of 10 December 1982 Relating to the Conservation and Management of Straddling Fish and Highly Migratory Fish Stocks. Paper presented at the Conference
on Management of Straddling and Highly Migratory Fish Stocks and the UN Agreement, Bergen, 1999.
[10] Pintassilgo , P., Brasão, A. Costa Duarte, C., (1998). Bio-economic Modeling of Northern Atlantic
Bluefin Tuna. Working Paper nº 331, FEUNL.
[11] Pintassilgo, P., (1999). Optimal Use of Northern Atlantic Bluefin Tuna.Working Paper nº 355,
15
7. Appendix
7.1. East Atlantic
Table 1: Coalition simulation outcomes – Case1 after 5 years of cooperation
Z TNPV TNPVEU TNPVDWFN TNPVOCS TNPV COA Non_cooperation 920.85 406.94 302.76 211.14
-Cooperation 1.2196 1670.40 930.57 302.08 437.74 1670.40
DWFN_OTH 2.4228 772.51 366.12 199.28 207.12 406.39
EU_DWFN 1.1819 1859.90 579.73 191.86 1098.40 771.59
EU_OTH 1.0566 1703.20 448.18 1053.20 201.82 650.00
Table 2: v*(K) – Case 1 after 5 years of cooperation
V*(.) V*(.)/e(.) EU 0,00 0,00 DWFN 0,00 0,00 OTH 0,00 0,00 EU, DWFN 61,89 0,08 EU, OTH 31,92 0,04 DWFN, OTH 0,00 0,00 EU, DWFN, OTH 749,56 1,00
Table 3: Shapley Value – Case 1 after 5 years of cooperation
EU DWFN OCS
Shapley Value Normalized 0,36 0,33 0,31
Dist. of Gains 265,49 249,53 234,54
NPV. Cooperation 930,57 302,08 437,74
Side payments -258,14 250,21 7,94
Table 4: Coalition simulation outcomes – Case1 after 15 years of cooperation
Z TNPV TNPVEU TNPVDWFN TNPVOTH TNPV COA Non-Cooperation 2187.30 1031.30 605.55 550.37
-Cooperation 1.6140 2332.30 1242.40 464.82 625.06 2332.30
DWFN_OTH 5.4279 1754.10 632.85 621.70 499.52 1121.20
EU_DWFN 1.4709 2679.70 946.77 325.14 1407.80 1271.90
16
Table 5: v*(K) – Case 1 after 15 years of cooperation
V*(.) V*(.)/e(.) EU 0,00 0,00 DWFN 0,00 0,00 OTH 0,00 0,00 EU, DWFN 0,00 0,00 EU, OTH 0,00 0,00 DWFN, OTH 0,00 0,00 EU, DWFN, OTH 145,08 1,00
Table 6: Shapley Value – Case 1 after 15 years of cooperation
EU DWFN OCS
Shapley Value Normalized 0,333 0,333 0,333
Dist. of Gains 48,36 48,36 48,36
NPV. Cooperation 1242.40 464.82 625.06
Side payments -162,74 189,09 -26,33
Table 7: Coalition simulation outcomes – Case2 after 5 years of cooperation
Z TNPV TNPVEU TNPVDWFN TNPVOTH TNPV COA Non-cooperative - 1114,30 349,45 503,02 261,82
-Cooperative [1.42, 0, 1 0, 1] 3638,70 1398,10 1254,30 986,31 3638,7
DWFN_OTH [1.43, 0, 1, 0, 1] 1684,50 880,97 491,65 311,83 803,48
EU_DWFN [1.36, 0, 1, 0, 1] 2250,00 543,45 587,66 1118,90 1131,10
EU_OTH [1.67, 0, 1, 0, 1] 1426,20 317,26 870,58 238,35 555,61
Table 8: v*(K) – Case 2 after 5 years of cooperation
V*(.) V*(.)/e(.) EU 0,00 0,00 DWFN 0,00 0,00 OTH 0,00 0,00 EU, DWFN 278,63 0,11 EU, OTH 0,00 0,00 DWFN, OTH 38,64 0,02 EU, DWFN, OTH 2524,41 1,00
17
Table 9: Shapley Value – Case 2 after 5 years of cooperation
EU DWFN OCS
Shapley Value Normalized 0,3466 0,3543 0,2991
Dist. of Gains 875,03 894,35 755,03
NPV. Cooperation 1398,10 1254,30 986,31
Side payments -173,62 143,07 30,54
Table 10: Coalition simulation outcomes – Case2 after 15 years of cooperation
Z TNPV TNPVEU TNPVDWFN TNPVOTH TNPV COA Non_cooperation - 3945,30 1451,00 1435,00 1059,30
-Cooperation [2.43, 0, 1, 0, 1] 5859,70 2003,30 2390,70 1465,70 5859,70
DWFN_OTH [3.37, 0, 1, 0, 1] 3624,90 1132,10 1582,20 910,55 2492,80
EU_DWFN [3.59, 0, 1, 0, 1] 3787,30 1179,10 1680,50 927,76 2859,50
EU_OTH [12.46, 0, 1, 0, 1] 2642,00 1230,20 398,53 1013,30 2243,50
Table 11: v*(K) – Case 2 after 15 years of cooperation
V*(.) V*(.)/e(.) EU 0,00 0,00 DWFN 0,00 0,00 OTH 0,00 0,00 EU, DWFN 0,00 0,00 EU, OTH 0,00 0,00 DWFN, OTH 0,00 0,00 EU, DWFN, OTH 1914,40 1,00
Table 12: Shapley Value – Case 2 after 15 years of cooperation
EU DWFN OCS
Shapley Value Normalized 0,3333 0,3333 0,3333
Dist. of Gains 638,13 638,13 638,13
NPV. Cooperation 2003,30 2390,70 1465,70
18
7.2. West Atlantic
Table 13: Coalition simulation outcomes – Case1 after 5 years of cooperation
Z TNPV TNPVUSA TNPVDWFN TNPVCAN TNPV COA Non-cooperative - 33,25 17,55 7,44 8,25
-Cooperative 1.11 79,96 40,26 15,73 23,97 79,96
USA_CAN 0.86 66,83 24,03 29,53 13,27 37,30
USA-DWFN 1.14 78,10 35,56 14,14 28,40 49,70
DWFN_CAN 1.45 38,67 21,75 8,20 8,72 16,92
Table 14: v*(K) – Case 1 after 5 years of cooperation
V*(,) V*(,)/e(,) USA 0,00 0,00 DWFN 0,00 0,00 CAN 0,00 0,00 USA-CAN 11,50 0,25 USA-DWFN 24,71 0,53 DWFN, CAN 1,23 0,03 USA, DWFN, CAN 46,72 1,00
Table 15: Shapley Value – Case 1 after 5 years of cooperation
USA DWFN CAN
Shapley Value Normalized 0,4538 0,3438 0,2025
Dist. of Gains 21,20 16,06 9,46
NPV. Cooperation 40,26 15,73 23,37
Side payments -1,51 7,78 -5,67
Table 16: Coalition simulation outcomes – Case1 after 15 years of cooperation
Z TNPV TNPVUSA TNPVDWFN TNPVCAN TNPV COA Non-cooperation - 61,99 32,86 14,00 15,13
-Cooperation 1.27 101,04 50,49 19,54 31,01 101,04
USA_CAN 1.26 78,00 34,71 23,43 19,86 54,57
USA-DWFN 1.32 95,12 46,12 18,07 30,92 64,19
19
Table 17: v*(K) – Case 1 after 15 years of cooperation
V*(,) V*(,)/e(,) USA 0,00 0,00 DWFN 0,00 0,00 CAN 0,00 0,00 USA-CAN 6,58 0,17 USA-DWFN 17,33 0,44 DWFN, CAN 0,81 0,02 USA, DWFN, CAN 39,04 1,00
Table 18: Shapley Value – Case 1 after 15 years of cooperation
USA DWFN CAN
Shapley Value Normalized 0,4285 0,3546 0,2169
Dist. of Gains 16,73 13,85 8,47
NPV. Cooperation 50.49 19.54 31.01
Side payments -0,90 8,31 -7,41
Table 19: Coalition simulation outcomes – Case2 after 5 years of cooperation
Z TNPV TNPVUSA TNPVDWFN TNPVCAN TNPV COA Non-cooperation - 52,06 44,66 0,76 6,63 -Cooperation [0,1.19, 0, 1] 114,40 88,73 0 25,66 114,40 USA_CAN [0, 1.16, 0, 1] 113,43 86,09 2,05 25,29 111,38 USA_DWFN [0, 1.38, 0, 1] 111,69 88,65 0 23,04 88,65 DWFN_CAN [0, 0, 0, 1] 55,83 49,12 0 6,71 6,71
Table 20: v*(K) – Case 2 after 5 years of cooperation
V*(.) V*(.)/e(.) USA 0,00 0,00 DWFN 0,00 0,00 CAN 0,00 0,00 USA-CAN 60,09 0,96 USA-DWFN 43,23 0,69 DWFN, CAN 0,00 0,00 USA, DWFN, CAN 62,35 1,00
20
Table 21: Shapley Value – Case 2 after 5 years of cooperation
USA DWFN CAN
Shapley Value Normalized 0,6095 0,1276 0,2628
Dist. of Gains 38,00 7,96 16,39
NPV. Cooperation 88,73 0 25,66
Side payments -6,07 8,72 -2,64
Table 22: Coalition simulation outcomes – Case 2 after 15 years of cooperation
Z TNPV TNPVUSA TNPVDWFN TNPVCAN TNPV COA Non_ cooperative - 95,15 78,11 1,26 15,79 -Cooperative [0, 1.46, 0, 1] 147,16 117,46 0 29,69 147,16 USA_CAN [0, 1.43, 0, 1] 146,09 114,48 2,26 29,35 143,84 USA_DWFN [0, 1.63, 0, 1] 144,29 116,87 0 27,42 116,87 DWFN_CAN [0, 0, 0, 0.98] 97,55 78,05 0 19,05 19,05
Table 23: v*(K) – Case 2 after 15 years of cooperation
V*(.) V*(.)/e(.) USA 0,00 0,00 DWFN 0,00 0,00 CAN 0,00 0,00 USA-CAN 49,94 0,96 USA-DWFN 37,50 0,72 DWFN, CAN 2,00 0,04 USA, DWFN, CAN 52,00 1,00
Table 24: Shapley Value – Case 2 after 15 years of cooperation
USA DWFN CAN
Shapley Value Normalized 0,6008 0,1398 0, 2594
Dist. of Gains 31,24 7,27 13,49
NPV. Cooperation 117,46 0 29,69
21
7.3 West Atlantic – Case 2– ELL and ER&R equal to E95
Table 25: Coalition simulation outcomes – Case 2 after 5 years of cooperation
Z TNPV TNPVUSA TNPVDWFN TNPVCAN TNPV COA Non_ Cooperative - 18,82 14,42 2,70 1,70 -Cooperative [0,1.19, 0, 1] 114,40 88,73 0 25,66 114,40 USA_CAN [0, 0,42, 0, 1] 70,08 27,34 31,57 14,77 38,50 USA_DWFN [0, 1.11, 0, 1] 86,27 55,62 0 30,65 55,62 DWFN_CAN [0, 0, 0, 1] 16,78 15,70 0 1,08 1,08
Table 26: v*(K) – Case 2 after 5 years of cooperation
V*(,) V*(,)/e(,) USA 0,00 0,00 DWFN 0,00 0,00 CAN 0,00 0,00 USA-CAN 22,38 0,23 USA-DWFN 38,50 0,40 DWFN, CAN 0,00 0,00 USA, DWFN, CAN 95,58 1,00
Table 27: Shapley Value – Case 2 after 5 years of cooperation
USA DWFN CAN
Shapley Value Normalized 0,4395 0,3224 0,2381
Dist. of Gains 42,01 30,82 22,76
NPV. Cooperation 88,73 0 25,66
Side payments -32,30 33,52 -1,20
Table 28: Coalition simulation outcomes – Case2 after 15 years of cooperation
Z TNPV TNPVUSA TNPVDWFN TNPVCAN TNPV COA Non_ Cooperative 57,81 41,19 7,39 9,23 -Cooperative [0, 1.46, 0, 1] 147,16 117,46 0 29,69 147,16 USA_CAN [0,0.72,0,1] 111,03 50,52 38,07 22,44 72,96 USA_DWFN [0, 1.33, 0, 1] 134,84 92,73 0 42,11 92,73 DWFN_CAN [0, 0, 0, 1] 71,89 62,49 0 9,40 9,40
22
Table 29: v*(K) – Case 2 after 15 years of cooperation
V*(,) V*(,)/e(,) USA 0,00 0,00 DWFN 0,00 0,00 CAN 0,00 0,00 USA-CAN 22,54 0,25 USA-DWFN 44,15 0,49 DWFN, CAN 0,00 0,00 USA, DWFN, CAN 89,35 1,00
Table 30: Shapley Value – Case 2 after 15 years of cooperation
USA DWFN CAN
Shapley Value Normalized 0,4577 0,3316 0,2107
Dist. of Gains 40,90 29,63 18,82
NPV. Cooperation 117,46 0 29,69