Giovanni Cunico
Bacharelato em Ciências Políticas
Playing the Devil’s Advocate in Facilitated System
Dynamics Modelling Processes: The Case of the UK
Retrofit System
Dissertação para obtenção do Grau de Mestre em Dinâmica de Sistemas (Mestrado Europeu)
Orientador: Prof. Nuno Videira, Professor Auxiliar, Faculdade
de Ciências e Tecnologia, Universidade Nova de Lisboa
Co-Orientador: Dr. Nicole Zimmermann, Lecturer, Faculty of
the Built Environment, University College London
Júri:
Presidente: Prof. Doutora Paula Antunes Arguente: Prof. Doutor Vincent de Gooyert Vogal: Prof. Doutor Nuno Videira
i
Acknowledgements
This dissertation was elaborated in the context of a joint project between University College London (UCL) and the Department of Business, Energy and Industrial Strategy (BEIS) in United Kingdom where I spent more than 3 months trying to apply what I have been learning for two years in the attempt of making the world a slightly better place. Therefore, I am very grateful to all the people I met there for their willingness to share their knowledge with a young inexperienced student who had just arrived. However, two special thanks are due. First, to Valerio for being the best ‘partner in crime’ anybody could ever hope to have. Second, but definitely no less important, thanks to ‘our boss’ Nici Zimmermann for all the afternoons we spent in her office sharing ideas, stories and knowledge (even if, concerning this last point, the exchange was more unidirectional).I am sure that all the minutes spent with both of you made me better.
I am in debt also with Prof. Nuno Videira for supervising me, especially for his ability to push me to raise my academic standards. If during my semester in Lisbon I discovered how participative approaches can be combined with moral values and attitudes is because of him and Prof. Paula Antunes. In line with that, I am deeply grateful also to the Erasmus Master in System Dynamics (EMSD) professors from Bergen University for having shown me that System Dynamics (SD) is not as difficult as it looks at first sight and to the ones from Radboud University for having taught me how to use SD in practice in the ‘real world’. I absolutely can not forget to acknowledge all my EMSD colleagues/friends/weirdos/familiars. I feel blessed to have shared these two intense (aka stressful) years with you and I am incredibly sorry because I definitely learn more from you than you did from me.
I must also take some space to show appreciation to my family for all its support (especially my brother for his suggestions on the graphics), to Nicole B. for being my personal and special ‘editor’ (without her I would probably not even be here writing this), to all my friend that still do not understand what I am doing and do not believe me when I say that I am very busy, to my high school classmates and professor (without the knowledge gained there I would not have been able to finish even my first semester), etc. In other words thanks to all the people I met: I ‘stole’ something from all of you.
iii
Abstract
One of the most important emitters of CO2 is the building stock, in particular the residential one. Although
technical potential to increase buildings’ energy efficiency is available, a gap between actual and potential implementation persists and policymakers worldwide continuously try to explore new tools to support the retrofit uptake. Within this context, the UK committed itself to ambitious carbon emission reductions by 2050 and there the housing stock is believed responsible for about 29% of total emissions. The main instruments used by British policymakers were energy obligations schemes and despite these policies performed relatively well, they were not able to substantially support the deep retrofit uptake necessary to reach 2050 targets. In late 2012, a new market-based policy, called the Green Deal, was launched with the goal to substitute all the previous mechanisms and support the uptake of millions of retrofit measures, but it was a huge failure. The causes were partially identified in the lack of knowledge available on the dynamics involved. Moreover, British policymakers began to explore two new financial policies, stamp duty rebate and green mortgages, which systemic impact was never assessed. Hence, the objectives of the present dissertation were to uncover these dynamics related to British homeowners retrofit uptake, to evaluate the impacts of the two new policies, and, since the study was conducted a participatory system dynamics approach, to test if an adaptation of the traditional Devil’s Advocate script, in which the facilitators left their neutral role and act as the missing stakeholders, would be a successful way to tackle homogeneity in participatory workshops. This last was formulated since the research context posed this methodological challenge. The study was conducted in a joint project between University College London and the Department for Business, Energy and Industrial Strategy in which only policymakers could attend the workshops because of the confidentiality and time constraints, creating a situation of homogeneity that could had undermined outcomes’ quality. In the literature there were not techniques available to overtake the problem, therefore the new setting was developed and used. Although playing the Devil’s Advocate appeared to be challenging to facilitators, it proved to be successful and increased the heterogeneity in the room. The research resulted in a quantified model that depicted the dynamics related to British homeowner retrofit uptake. The study highlighted affordability as a necessary condition but not enough to raise retrofit: popularity and non-financial attractiveness are two factors that deeply drive measures uptake. The two tested policies showed low direct impacts on the system since they target a small segment of population. Nonetheless, indirect effects related to additional financial benefits may increase policies’ impact, although these effects are strongly dependent on the time markets need to perceived policy changes. No silver bullets are available in policymakers’ toolbox and a combination of policy instruments is necessary. Specifically, financial policies need to be integrated with interventions aimed to increase popularity and non-financial attractiveness of retrofit measures.
Key words: housing stock, energy efficiency, retrofit, United Kingdom policymaking, system dynamics, participatory system dynamics, group model building, facilitation, homogeneity, Devil’s Advocate
v
Table of contents
1. Introduction ... 1
1.1. Background and relevance ... 1
1.2. Research context and setup ... 3
1.3. Research objectives and contribution ... 4
1.4. Dissertation structure ... 5
2. Buildings’ stock and sustainability ... 6
2.1. Buildings stock: a source of sustainability concerns ... 6
2.2. Energy efficiency gap: a complex system ... 8
2.3. Energy efficiency co-benefits: multiple interests ... 9
2.4. Closing the energy efficiency gap: retrofit ... 13
2.5. Policies to support retrofit uptake rate ... 16
3. Retrofit policy: the United Kingdom housing efficiency ... 21
3.1. UK emissions and targets ... 21
3.2. The UK housing stock: a source of concerns and potential solutions ... 21
3.3. The state of the stock ... 24
3.4. Barriers to homeowners uptake and unintended consequences ... 27
3.5. Past policies: successes, failures and resistances ... 32
3.6. Policy under exploration ... 37
3.7. Challenges and open questions ... 38
3.8. Previous studies ... 38
3.9. System Dynamics and Participatory System Dynamics Modelling applications to retrofit system 39 4. Method and Research Process ... 44
4.1. Research steps ... 45
4.1.1. Research set up and gatekeepers’ preliminary interviews ... 45
4.1.2. Workshop and workshop preparation ... 45
4.1.3. Model building ... 45
4.1.4. Experts interviews and model refinement ... 46
4.1.5. Follow up ... 46
4.2. Research context ... 46
4.3. Participatory system dynamics in a ‘pressure-cooker’ ... 47
4.4. The ‘new’ Devil’s Advocate setting: a possible way to overcome the homogeneity barrier ... 50
4.5. SWOT analysis ... 54
4.5.1. Strengths ... 55
4.5.2. Weaknesses ... 55
4.5.3. Opportunities ... 56
vi
4.5.5. Potential risks and mitigation ... 58
4.5.6. New Devil’s Advocate setting post-execution analysis ... 59
5. Results and discussion ... 61
5.1. Process and outcomes ... 61
5.1.1. Preliminary interviews ... 61
5.1.2. First workshop ... 62
5.1.3. First workshop outputs ... 63
5.1.4. Second workshop ... 66
5.1.5. Second workshop outputs ... 67
5.1.6. Interviews ... 67
5.1.7. Follow-up ... 69
5.2. New Devil’s Advocate setting analysis ... 71
5.2.1. Coding analysis: how did the ‘new’ Devil’s Advocate influence the model? ... 71
5.2.2. Participants’ feedbacks ... 75
5.2.3. Facilitators’ feedbacks ... 75
5.2.4. Assessment with respect of the predicted risks ... 77
5.2.5. A comparison with Gerrits & Vaandrager (2017) ... 79
5.2.6. New Devil’s Advocate setting limitations ... 80
5.2.7. Bringing together the results on the New Devil’s Advocate setting ... 81
5.3. Model based policies’ analysis ... 83
5.3.1. Model validation ... 83
5.3.2. Main dynamics ... 84
5.3.3. Base run and future trends ... 88
5.3.4. Impact of subsidies ... 90
5.3.5. Mortgage policy and stamp duty policy impacts ... 91
5.3.6. The importance of the amenity renovations mechanism ... 93
5.3.7. Insights on financial policies: the importance of market assimilation time... 95
5.3.8. Financial affordability: only one of the barriers ... 96
5.3.9. Importance of ‘popularity’ and ‘non-financial attractiveness’’ ... 96
5.3.10. Model assumptions and limitations ... 98
5.3.11. Policy Implications ... 99
6. Conclusions and Further Research ... 102
6.1. Main lessons ... 102
6.2. Further research and developments ... 105
References ... 107
Annex A: First workshop map software translation ... 116
Annex B: First workshop refined map loops identification ... 117
vii
Annex D: The New Devil’s Advocate Script ... 120
Annex E: Second workshop transcripts ... 137
Annex F: Correspondence between Devil’s Advocate inputs and structure ... 174
Annex G: Facilitator’s second workshop memo ... 175
viii
List of figures
Figure 1-1: Thesis structure ... 5
Figure 2-1: Global anthropogenic CO2 emissions sources (2006). ... 6
Figure 2-2: Impact of energy policy on world energy consumption (2000–2030) ... 8
Figure 2-3: The multiple benefits of energy efficiency ... 10
Figure 3-1: Final energy consumption by sector 2012 ... 21
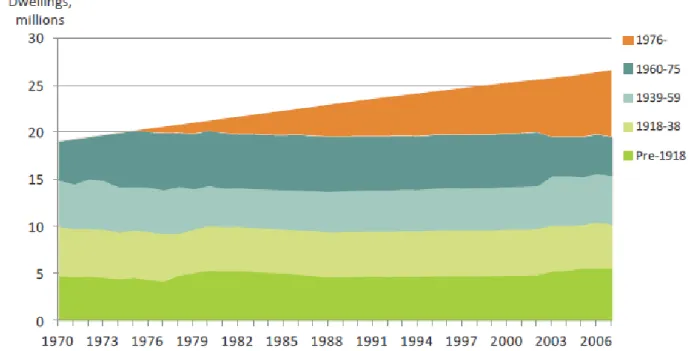
Figure 3-2: Housing stock distribution by age 1970-2006 ... 22
Figure 3-3: Fuel poverty in England (%) and average fuel poverty gap ... 23
Figure 3-4: Total number of electrical appliances owned by UK households and total domestic electricity consumption ... 24
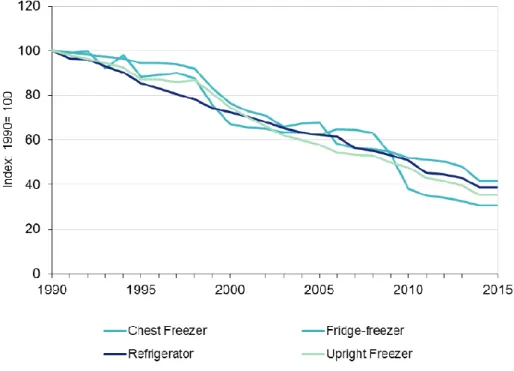
Figure 3-5: Average energy consumption of new cold appliances 1990 to 2015 (index 1990) ... 25
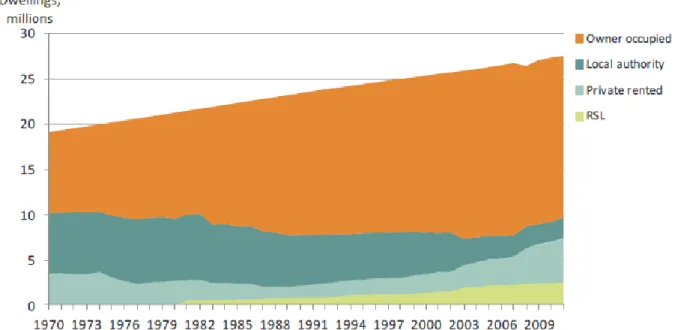
Figure 3-6: Housing stock distribution by tenure (millions) up to 2011 ... 27
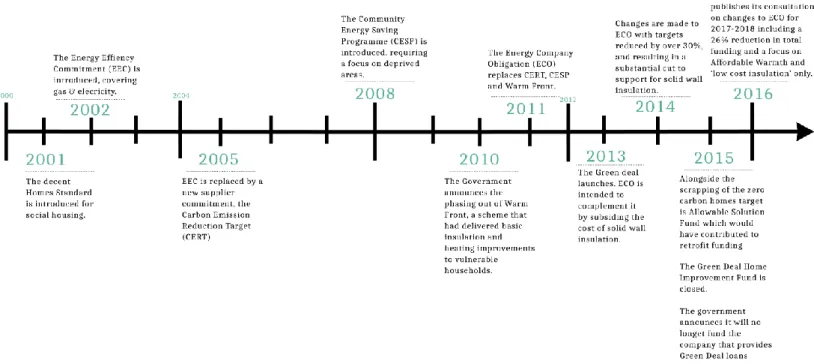
Figure 3-7: UK financial policies from 2000 up to now ... 33
Figure 3-8: UK subsidies schemes energy saving targets ... 34
Figure 4-1: The Participatory System Dynamic Modelling process... 44
Figure 4-2: Prototype new Devil’s Advocate introduction to workshop participants ... 53
Figure 4-3: New Devil’s Advocate SWOT analysis... 57
Figure 5-1: Participatory System Dynamic Modelling process employed ... 61
Figure 5-2: Problematic behaviours brainstormed during the first workshop ... 63
Figure 5-3: First workshop map ... 64
Figure 5-4: First workshop refined map ... 65
Figure 5-5: New Devil’s Advocate introductory slide ... 66
Figure 5-6: Second workshop map. ... 68
Figure 5-7: UK homeowner retrofit uptake SFD model ... 70
Figure 5-8: Devil’s Advocate impact. ... 74
Figure 5-9: UK homeowners’ retrofit uptake simplified Causal Loop Diagram ... 87
Figure 5-10: Stock and Flow model baseline run. ... 88
Figure 5-11: Baseline run average households energy consumption. ... 89
Figure 5-12: Solid wall cumulative uptake in the baseline scenario. ... 90
Figure 5-13: Solid wall cumulative uptake for different subsidies scenarios ... 91
Figure 5-14: Solid wall cumulative uptake for different policy scenario ... 91
Figure 5-15: Solid wall cumulative uptake for different policy combination scenarios:. ... 92
Figure 5-16: Number of households installing retrofit measures every month ... 92
Figure 5-17: Renovators and buyer cutting phases... 93
Figure 5-18: Double-glazing cumulative uptake ... 94
Figure 5-19: Summary of the causal connections influencing the variable ‘added value to property of measures’. ... 95
Figure 5-20: Solid wall uptake with mortgage policy for delay durations for changing the added value to a property... 95
Figure 5-21: Solid wall uptake for different values of budget for retrofit. ... 96
Figure 5-22: Solid wall uptake for different values of non-financial attractiveness of solid wall ... 97
Figure 5-23: Popularity effect on cumulative solid wall uptake. ... 98
Figure 5-24: German Federal funding of the financial scheme supporting retrofit and loans and grants issued ... 101
ix
List of tables
Table 2-1: Energy-efficiency related co-benefits level and domain of impact ... 12
Table 2-2: Summary of the overviewed retrofit measures ... 14
Table 2-3: Retrofit policy portfolio ... 19
Table 3-1: Barriers to homeowners’ retrofit uptake ... 31
Table 4-1: Prototype table with the information to provide to the Devil’s Advocate ... 52
Table 4-2: New Devil’s Advocate risks and mitigations ... 58
Table 4-3: Second workshop coding scheme ... 60
Table 5-1: Second workshop Devil’s Advocates and participants cumulative interventions, variables and connections ... 71
Table 5-2: Second workshop coding results for both Devil’s Advocates... 72
x “… We need to really shake this up, to get it moving and we get this feedback! […] what you
need to do is give the system a serious shock, not just play around with a few incentives; you need to change this really quickly …”
1
1. Introduction
1.1. Background and relevance
Having a roof over the head is a primordial human need. For this reason, human beings have always built edifices, shelters and especially dwellings. This necessity is so widely recognized that providing all the citizens a decent place to live became in the last century one of the principal objectives of national governments (e.g. social housing) (Malpass, 2014). Until the pre-industrial era the whole building stock was not a source of any major threat to the environment, but, unfortunately, this has changed with the advent of the industrial revolution (IPCC, 2014). Modern factories took place and started to massively consume energy and pollute. Then, this condition extended to all the type of edifices. Among all the types of pollutants emitted by the building stock over time, greenhouse gasses (GHG), such as carbon dioxide (CO2), became one of the most
menacing. Anthropogenic GHG emissions are the main responsible for one of the major threats to human society today: Climate Change (IPCC, 2014). While at the beginning the housing stock wasn’t playing a big role, as time went on its share of GHG emissions increased. Wealth diffusion, development of technologies (appliances), decrease in the household average size combined with an increasing population are all factors that made the housing stock consuming energy and become an crucial GHG emitter (Ürge-Vorsatz et al., 2012). At the moment, there are plenty of functional and cost-effective technologies available, and new options are likely to come from the developments of research (Ürge-Vorsatz, Harvey, Mirasgedis, & Levine, 2007). Nevertheless, achieving future with lower carbon emission from the housing stock will require very significant efforts to build up programs and policies aiming to do so, far beyond what it is happening today. Therefore, nowadays, policymakers all around the world are faced with this difficult contraposition in which a basic human need, such as having a dwelling, is causing a major threat to whole humanity. One of the main strategies they identified in order to tackle the issue is to decrease the energy efficiency of the housing stock (Kelly, 2009). On top of that, increasing the dwellings retrofit extent, the improving of existing buildings structure with energy efficiency equipment, has become a desirable goal also because achieving this objective could lead to additional co-benefits (e.g. green growth, poverty alleviation, energy security, etc.) that are really appreciated by citizens and politicians (Ryan & Campbell, 2012).
United Kingdom (UK) is no exception to this situation. The country committed itself to the very ambitious pledges of carbon emission reduction of the 80% below 1990 levels by 2050 (Parliament of the United Kingdom, 2008) in order to do its part to ‘fight’ climate change. However, although the UK has done fairly well so far, with current trends the CO2 abatement targets will be missed (Committee for Climate Change,
2015; Kelly, 2009). Within this context, the housing sector represents a big share of UK energy consumption (Waters, 2016) and therefore it is getting British policymakers’ special attention. Owing the low replacement rate, the majority of the UK dwellings will be still in existence in 2050; therefore, retrofit has been identified
2 as one of the principal ways to tackle dwelling emissions. In the country, many technical measures for energy efficiency are potentially available. Nevertheless, the upgrading rate for energy efficiency installments is still limited and insufficient to meet national objectives (BEIS, 2017b; DECC, 2016b). Moreover, pursuing these goals has become important not only from an environmental perspective but also for other reasons. First, these improvements will help the government to tackle the widespread social problem of fuel poverty (households that can not afford to maintain properly warm their home at a fair cost; DECC, 2015). But also it has been observed that retrofitting housing stock would lead to greater energy security (Kelly, 2009), avoid energy grid structural enhancements (Erbach, 2015; Poudineh & Jamasb, 2014), foster green growth (Ryan & Campbell, 2012). Considering the importance of achieving efficiency in UK dwellings, policymakers started almost 20 years ago to implement policies aiming to support retrofit uptake rate among households (Rosenow, 2012). Since the first governmental interventions, almost all the policies had been based on a logic of subsidy (e.g. CERT, ECC1 and 2, ECO) for the households on the retrofit measure (Rosenow, 2012). Over time the schemes targets have progressively raised and these interventions delivered the promised carbon reduction in a relatively satisfactory way. However, the subsidies’ mechanism worked well for the UK short term pledges (Committee for Climate Change, 2015) until these types of policy structures became ‘unsustainable’ for two reasons. First, these schemes were not able to support a retrofit uptake high enough to meet the long-term national targets. Second, in a difficult economic situation in which the country is going through, it was becoming more and more challenging to defend this system of subsidies to the retrofit market. Energy efficiency was not necessarily perceived as a priority and therefore maintaining these financial aids was getting expensive in terms of political capital. Therefore, in 2013, the Green Deal scheme was launched in grand style and it became the Government’s flagship green policy. It was based on innovative economic incentives on bills and it was intended to deliver energy efficiency retrofits at scale. It was expected to support millions of retrofit installations, but instead the scheme was undertake only by few thousands of households (Morse, 2016; Rosenow & Eyre, 2016) resulting in a resounding policy failure (Bishoff, 2013; Gosden, 2016; Syal, 2016; Vaughan, 2015). There are multiple reasons for this failure (Bonfield, 2016; Morse, 2016; Rosenow & Eyre, 2016). However, one of the main causes was the poor design of the policy (complicated and not economically attractive) that forgot to take into account the complex dynamics involved in the homeowners retrofit uptake (Eker & Zimmermann, 2016; Macmillan et al., 2016) and ended up misjudging households behaviour and overlooking to many policy resistances and unintended consequences (Collins & Dempsey, 2017; Shrubsole, Macmillan, Davies, & May, 2014). Now, new policies are under examination by policymakers in order to fill the gap left by the Green Deal fiasco. The main direction is towards the creation of financial and fiscal instruments and two policies are being considered. First, a green
mortgage policy, in which it is assumed that lenders starting to offer preferential mortgages for improving
fabric energy efficiency or providing better conditions to home buyers that purchase houses with high efficiency standards, will stimulate the retrofit uptake. Second, it is a direct stamp duty rebate, namely a
3 discount on the fees to pay when a house is acquired if the dwelling under transaction is energetic efficient or if the buyer is committed to retrofit the property.
Unfortunately, scientific sounded knowledge on this issue is lacking. There have been multiple studies on the homeowner decision-making process for the retrofit uptake (Wilson, Crane, & Chryssochoidis, 2015) but they are very specific and narrow focused on small sectors or portions of the retrofit system. Conversely, there are no studies that capture and explain the dynamics involved in the homeowners retrofit uptake rate in UK. In other words, there is not a robust knowledge from a more holistic perspective understanding loops, barriers, drivers and interaction between different actors and their decision-making processes related to the homeowner retrofit demand are still unknown. Moreover, the possible impacts of the two policies under investigation by policymakers have not been assessed and their effects on the retrofit market explored in scientific literature.
1.2. Research context and setup
To conduct this study System Dynamics (SD) methodology (Forrester, 1961; Sterman, 2000) was considered an optimal tool to improve our understanding over the issue through the use of causal maps and quantified models. Moreover, it was decided to use this method in its participatory form (Stave, 2010; Vennix, 1996). This approach is usually called Participatory System Dynamics Modelling (PSDM) and it directly involves stakeholders and experts in the process of map or model construction. This choice was made for two main reasons. First because including stakeholders and experts in the conceptualization and modelling phase may dramatically improve the quality of the outcomes and support possible implementation (Scott, Cavana, & Cameron, 2016). Second with respect of the relation between housing stock and energy efficiency, there have been many calls by scientist to use more PSDM to understand what are the dynamics involved (Eker & Zimmermann, 2016; Shrubsole et al., 2014) and to use this approach to concretely support policymakers in the decision process (Macmillan et al., 2016; Xing, Lannon, & Malcolm, 2014) with quantified SD models. A joint project between the Department of Business, Energy and Industrial Strategy (BEIS), the former Department for Energy and Climate Change (DECC), and the University College London (UCL) Institute for Environmental Design and Engineering (IEDE) offered the right context to conduct this investigation. Between March and April 2017, in London, a PSDM project was performed with policymakers from BEIS with the support of UCL researchers and in collaboration with Valerio Cappuccio, a fellow Erasmus Master in System Dynamics (EMSD) student. The project aimed to improve the departmental understanding of the dynamics involved in the homeowners retrofit uptake and to preliminary assess the likely outcomes of the green mortgage policy and of the stamp duty rebate. Unfortunately, the project took place in ‘pressure-cooker’ situation (Gerrits & Vaandrager, 2017). The time span for the research on the field was very short compared to usual PSDM approaches because the Department needed to have some preliminary insights very quickly.
4 In addition, due to the short time to arrange the participatory sessions and to the confidentiality of the issues discussed (the two policies were not publicly disclosed yet), only policymakers attended the sessions while all the other stakeholders were excluded. As a result, this condition of homogeneity in the participants’ group, not so uncommon in PSDM projects, could have decreased the quality of the outcomes (Gerrits & Vaandrager, 2017). Therefore, the study posed interesting methodological challenges. In response to this situation a new facilitation approach was prepared upfront, in line with the objectives of the dissertation, and developed as a possible way to overcome the problem. It consisted an adaptation of the traditional Devil’s Advocate in a new setting, in which facilitators leave their neutral roles and try to act like the missing stakeholder would do in the attempt to bring their mental models into the room.
1.3. Research objectives and contribution
Consequently to the gaps in literature identified above, the questions this dissertation tries to answer are the following:
1) What are the dynamics involved in the homeowners retrofit uptake rate in UK? Specifically, what are the loops, barriers, drivers and interactions between different actors and their decision-making processes related to the homeowner retrofit demand?
2) What will the impact on the uptake rate of financial policies, such as a green mortgage policy or a
stamp duty rebate, be? Would they be effective from a dynamic perspective, namely would they be
able to trigger virtuous feedback loops?
In addition to these objectives, this thesis aims also to explore the effectiveness of the adapted and new Devil’s Advocate script as a tool to overcome homogeneity in a PSDM group of participant. Therefore, it tries to give a response to the following demand:
3) In a PSDM case in which relevant stakeholders cannot be involved in the participatory process and homogeneity is present in the group of participants, how can missing stakeholders’ point of view be brought inside the PSDM sessions? What is the effectiveness of the adaptation of the Devil’s Advocate script presented in this thesis?
The pursuit of these research objectives and the resulting insights are expected to improve our understanding of the retrofit system in the UK and to preliminary evaluate the impacts of financial policies under consideration in BEIS. Providing an answer to the last question could contribute to enrich the set of instruments in the toolbox of SD practitioners, since homogeneity issues are not uncommon in PSDM and robust solutions to overcome this issue are lacking.
5
1.4. Dissertation structure
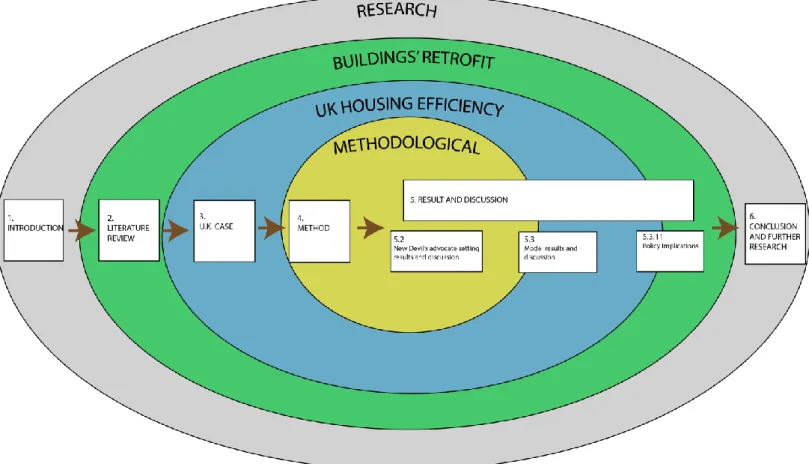
This dissertation is structured as follows. In the second chapter, a review is conducted on the literature discussing the environmental issues posed by the buildings’ stock (with an eye to the housing one) and the different methods and policies for their mitigation. In the third chapter, the specifics and peculiarities of the UK case are presented, such as: the challenges to policymakers, the knowledge gaps undermining previous policy efforts, an overview on the methods used before on this topic and on the related SD researches. Then in the fourth chapter, it is outlined the PSDMmethod developed and used to perform the study. Here it is also explained why a new approach to tackle homogeneity in groups in PSDM project is needed and how the new Devil’s advocate (DA) setting is structured. Subsequently, the fifth chapter describes and discusses the results of the research: first, the process and outcome products are shown, then the results of the new DA are analyzed, and later the simulations runs and policy tests performed through the model are shown and policy implications are discussed. Here there will not be a very detailed description of the model since this will be deeply disclosed in the dissertation of Valerio Cappuccio, the EMSD colleague the model has been built with. The last chapter, the sixth one, reports the main insights gained regarding the three research questions introduced before and indicates possible future pathways for additional studies on the subjects. Fig 1-1 illustrates the thesis chapters unfolding and the different level of analysis.
Figure 1-1: Dissertation structure Source: conceived by the author
Figure 2-1: Global anthropogenic CO2 emissions sources
(2006).Figure 1-1: Dissertation structure Source: conceived by the author
6
2. Buildings’ stock and sustainability
2.1. Buildings stock: a source of sustainability concerns
Starting from the ground-breaking message of the book Limits to Growth (Meadows, Meadows, & Randers, 1972), mankind has began to consider environmental sustainability as a potential obstruction to human prosperity. Sustainably is a complex and wide concept that offers an umbrella for a wide array of issues (ocean acidification, natural resources management, land use, etc.) and due to this variety and complexity it has been discussed for long time (Hopwood, Mellor, & O’Brien, 2005). Nevertheless, nowadays, despite some few skeptical niche-groups that remain, anthropogenic climate change has been almost definitely acknowledged as one of the major future sustainability threats to humanity. Greenhouse gasses (GHG) emissions, mostly in form of carbon-dioxide (CO2), can be pointed as the most important cause of this threat
(IPCC, 2014). That has pushed human community (scientists, policy makers, etc.) to look at the sources of GHG in order to try to decrease their emission. What emerged is that the existing building stock is one of the most important responsible CO2 releaser worldwide (Allwood, Cullen, & Milford, 2010; Ürge-Vorsatz et al.,
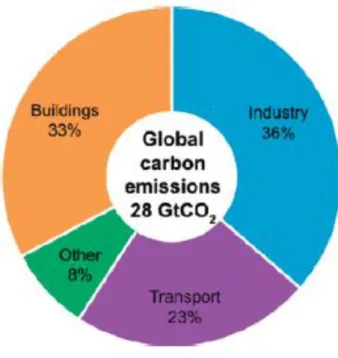
2012; Ürge-Vorsatz, Harvey, Mirasgedis, & Levine, 2007) as it is possible to see in Figure 2-1.
Ürge-Vorsatz et al. (2007) estimated that, in 2002, the building sector was ‘blameworthy’ of 7.85 Gt of carbon emission, accounting for 33% of the total. Since then, the situation hasn’t changed much at a global level as a later appraisal made by Ürge-Vorsatz et al. (2012) reports that the building stock is still responsible of a third of energy related carbon emissions. In addition to that, it contributes with roughly 1.5 Gt CO2
(Ürge-Figure 2-1: Global anthropogenic CO2 emissions sources (2006)
Source: Source: Allwood et al., 2010 p.1
Figure 2-2: Impact of energy policy on world energy
consumption (2000–2030)Figure 2-1: Global anthropogenic CO2
emissions sources (2006). Source: Source: Allwood et al., 2010 p.1
Figure 2-2: Impact of energy policy on world energy consumption (2000–2030)
7 Vorsatz et al., 2007) equivalent emissions of halocarbons (type of gasses responsible not only of increasing global greenhouse effect but also of decreasing the thickness of the ozone layer), approximately two thirds of the total emission (Ürge-Vorsatz et al., 2012),as well as around 25-33% of black carbon emissions (Ürge-Vorsatz et al., 2012). It has also projected that by 2030 there will be a growth in building absolute emissions reaching a range between 11 and 15.6 Gt/year, with the share of the sector remaining around one third of the total (Ürge-Vorsatz et al., 2007). However, other studies state that the building energy use and related CO2 emissions may even double or possibly triple by 2050 because of many tendencies (Lucon et al., 2014).
These trends are connected to the fact that an increasingly number of people in developing countries will access to adequate housing, electricity, and improved cooking facilities from today to mid-century (Lucon et al., 2014). Moreover, households size changes (decreasing number of people per households) and variations in wealth level and lifestyle habits (e.g., rise in the average number of appliances per household) all around the world will contribute to increase building energy use (Lucon et al., 2014). In this context, residential buildings play a key role since they are responsible for the nearly 18% of direct CO2 emissions (World Health
Organization, 2011). This generates a very challenging contrast, where on one side housing is a basic human necessity and right (United Nations, 1948) and on the other one housing is a major contributor to Climate Change, one of the most important threats to humanity. However, the residential stock can become also part of the solution to the problem. Housing have been described by the IPPC (2014) to have one of the greatest potential compared to other sectors (i.e., industry, transport, , waste generation, energy supply, forestry) for reducing GHG emissions in a cost-effectively way, in short time and using mature available technologies (World Health Organization, 2011) compared to other sectors. Providing some numbers can help to understand the magnitude of the phenomena: for example, reductions in heating energy requirements of 50 to 75 % in single-family housing that can even increase up reaching peaks close to 90 % in multi-family housing for average costs of approximately 100-400 US$(2010)/m2 (Harvey, 2013).
Kelly (2009), in line with Lucon et al. (2014) and Ürge-Vorsatz et al. (2007), has identified mainly four ways by which carbon emission can be cut down from the existing buildings and housing stock:
- re-engineering the fabric of the buildings
- improving the energy efficiency of appliances used in houses and offices
- decarbonizing the sources of energy to the home
- and changes in personal behaviour
The last point involves social and psychological aspects and regards population educational processes more than edifices themselves. Also the decarbonisation of the energy sources (through the decarbonized grid and use of local or distant renewable sources of energy) is more related to the way energy consumed by edifices
8 than directly to how the building consumes energy. Whilst the first two ways, re-engineering the fabric of the edifices and improving the performance of appliances at parity of energy consumption, directly regard the action to close the buildings and housing energy efficiency gap and this will be the focus from now on.
2.2. Energy efficiency gap: a complex system
The energy efficiency gap has been defined as the “discrepancy between optimal and actual implementation
of energy efficient technologies” (Backlund, Thollander, Palm, & Ottosson, 2012). At the moment, there is a
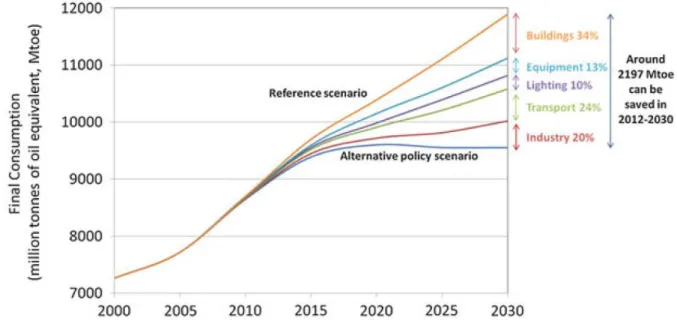
wide set of relatively accessible and cost-effective technologies that could decrease buildings energy consumption by a notable extent that have not been broadly adopted (Ürge-Vorsatz et al., 2007). In this respect, Yang (2012) reports that the International Energy Agency (IEA) calculated the potential for energy efficiency improvements to range approximately between 20% and 50% of the total energy consumption. Other estimations show that closing the general energy efficiency gap would help to save around the 20% of the total final energy consumption from 2010 to 2030 in OECD countries and of that increased energy efficiency in buildings will account for around 34% (Jollands et al., 2010) (Fig 2-2). This seems to be in line with the IEA estimations (Yang, 2012). Moreover, in developing countries the potential can be considered even larger since there are more low-cost energy efficiency opportunities in these nations that have not been tackled yet and because of the diffused use of inefficient technologies (Yang, 2012).
Another useful way to look at the energy efficiency gap is as the “difference between the actual level of energy
efficiency and the higher level that would be cost-effective from an individual’s or firm’s point of view” (Yang,
Figure 2-2: Impact of energy policy on world energy consumption (2000–2030) Source: Yang, 2012 p.11
Figure 2-3: The multiple benefits of energy efficiencyFigure 2-2: Impact of energy policy on world energy consumption (2000–2030) Source: Yang, 2012 p.11
9 2012). From the economical point of view this implies it is possible to produce greater economic output using less energy and from a societal one that people do a highly inefficient use of energy (Lovins, 1976 cited in Yang, 2012, p. 11). Despite the clear benefits energy efficiency leads to, as it was shown, this gap is far to be close even though it seems potentially to be cost-effective. The causes of this situation have been identified in the presence of multiple barriers (financial, informational, behavioural, geographical, technological etc.) that inhibit the uptake rate of energy efficiency measures (Blok et al., 2007; Dowson, Poole, Harrison, & Susman, 2012; Lucon et al., 2014; Santangelo & Tondelli, 2017; Tuominen, Klobut, Tolman, Adjei, & De Best-Waldhober, 2012; Ürge-Vorsatz, Koeppel, & Mirasgedis, 2007; Wilson et al., 2015; Yang, 2012). These obstacles, act also as market barriers since hinder the growth of the energy efficiency businesses, act on several levels of society, such as on households, on firms, on regional governments, on nations (Lucon et al., 2014; Yang, 2012), pushing government and international bodies (e.g. United Nations Framework for Climate Change, IEA, etc.) for policy interventions (Yang, 2012). Due to this multiplicity, the understanding of these obstacles comes from several disciplines, including economics, engineering, sociology, anthropology, and psychology. Nonetheless the many forces employed, there is still no consensus about the nature, origin and interrelations of these barriers and there are different opinions about which policy interventions are indispensable and effective (Yang, 2012). The effort needed to close the gap is massive, if we consider that IEA has projected that the world will require around 96 billion US$/year to address the energy efficiency gap between 2012 and 2030, in all sectors of society (Yang, 2012). To make things even more complex, increasing energy efficiency is not always a straightforward process because it can generate unintended consequences. This is especially true with respect of increasing the efficiency level of dwellings (Collins & Dempsey, 2017; Shrubsole et al., 2014) that can impact negatively households living there.
Therefore, energy efficiency appears to be a very complex system, affecting several domains (economic, social, and environmental), with high stakes involved (e.g. high investments required, increasing need to mitigate climate change), in which multiple actors are present (people, firms, policymakers, etc.) at a different levels (local, national, regional, global), with barriers and unintended consequence.
2.3. Energy efficiency co-benefits: multiple interests
In addition to mitigate climate change, improving buildings and housing retrofit extent can lead to important direct and indirect co-benefits other than energy savings. Co-benefits are defined as “the positive effects that
a policy or measure aimed at one objective might have on other objectives, without yet evaluating the net effect on overall social welfare. Co-benefits are often subject to uncertainty and depend on, among others, local circumstances and implementation practices” (Clifford & Prasad, 2016). In the case of energy efficiency,
it is possible to consider as co-benefits all the socioeconomic outcomes that may arise aside to climate change mitigation (Ryan & Campbell, 2012). These co-benefits seem to be many (Fig 1-2) and they have been listed
10 by a multitude of researchers (Blok et al., 2007; Kelly, 2009; Lucon et al., 2014; Ryan & Campbell, 2012; Ürge-Vorsatz, Danny Harvey, et al., 2007).
Understanding the co-benefits related to energy efficiency is crucial in order to comprehend the relevance that closing the energy efficiency gap is gaining among policymakers around the world. In this respect, Ryan & Campbell (2012) provide an interesting framework to understand these co-benefits. They assume that society is a multilayer entity and state that energy efficiency related benefits impact on many of them. The authors identify four main levels that can potentially be affected: individual, sectoral, national and
international.
At individual level (people, households, enterprises, etc.) several co-benefits have been highlighted. First, health and wellbeing improvements were observed in public health as result of improved heating, cooling and air quality. Then, augmenting energy efficiency can lead to increased energy affordability and access, alleviating poverty. If energy efficiency raises energy demand is reduced at parity of consumption (namely there is not rebound effect). This translates in reduced bills and it might make the difference especially for the low-income classes, making them able to acquire all the energy services they need without renouncing to other primary needs as well as free up income to spend to satisfy other needs. However, the last concept is valid not just for the poor but for all income level classes.
Figure 2-3: The multiple benefits of energy efficiency Source: Ryan & Campbell, 2012 p.8
Table 2-1: Energy-efficiency related co-benefits level and domain of impactFigure 2-3: The multiple benefits of energy efficiency Source: Ryan & Campbell, 2012 p.8
Table 2-1: Energy-efficiency related co-benefits level and domain of impact
Table 2-1: Energy-efficiency related co-benefits level and domain of impactFigure 2-3: The multiple benefits of energy efficiency Source: Ryan & Campbell, 2012 p.8
Table 2-1: Energy-efficiency related co-benefits level and domain of impactFigure 2-3: The multiple benefits of energy efficiency Source: Ryan & Campbell, 2012 p.8
Table 2-1: Energy-efficiency related co-benefits level and domain of impact
11 At a sectoral level, namely on the economic sectors of the society (industrial, transport, residential and commercial) improved energy efficiency can increase industrial productivity and competitiveness. This because it reduces the consumption of resources and pollution (lowering the costs of buying resources, depleting waste or compensating for externalities), and it improves firms capacity utilization leading to smaller operational and maintenance costs. Moreover, increased energy efficiency may help energy providers to supply better energy services to their customers, to decrease operating costs and to increase their profit margins. In addition, it alleviates the pressure on the energy grid, reducing the peak demand and providing an alternative solution to grid capacity enhancements (Erbach, 2015; Poudineh & Jamasb, 2014) that are at the moment very costly and technically difficult to make. Lastly, evidences start to show an increase in the number of investors willing to pay a premium for properties with higher energy performance (Fuerst, McAllister, Nanda, & Wyatt, 2013). Therefore, energy efficiency may also increase asset values. At a national level there might be multiple co-benefits related to energy efficiency. First, investments in energy efficiency can lead to new jobs in energetic and other sectors. This could be in line with governments’ green growth strategies and macroeconomics objectives of GDP increase. Then, it reduces the energy-related public expenditures, for example, it lowers energy consumption in government agencies and public utilities due to the decreased fuel purchase costs. For countries with energy consumption subsidies (usually in attempt to fightfuel poverty), improving energy efficiency means decreasing the public disbursements to ‘feed’ these subsidies (Ryan & Campbell, 2012). In countries where fuels are imported, energy efficiency can lower the pressure on currency reserves (better trade balance) and in energy-exporting ones it can free up even more fuel to export (Ryan & Campbell, 2012). Another very important co-benefit for policymakers in governments is that a reduced energy demand can improve the security of national energy systems crosswise the four dimensions of risks (Kruyt, van Vuuren, de Vries, & Groenenberg, 2009): “fuel availability
(geological), accessibility (geopolitical), affordability (economic) and acceptability (environmental and social)”.
Lastly, at international level there may be several positive additional impacts too. If energy demand decreases in multiple markets it may lead to a reduced energy price on a regional scale (Ryan & Campbell, 2012) and consequently this can increase energy affordability help to raise the disposable income of individuals and enterprises. In addition, lower demand can reduce pressure on natural resources (e.g. oil, coal, gas) with potential benefits for the environment and ecosystems. Improved energy efficiency can be significant in achieving economic and social goals in developing countriessuch as better access to energy services, poverty eradications, improved environmental sustainability and economic progress (Ryan & Campbell, 2012). However, as mentioned above, this is only one of the framework that can be used to understand the multiplicity of the energy efficiency related benefits. Usually, other authors tend to categorize these co-benefits based on the domain they impact or challenge they tackle, for an example look at what Kelly (2009)
12 propose. Integrating these two different ways of interpreting energy efficiency co-benefits may help to understand better how wide the range of these co-benefits is. This is done in in Table 1-1. Here, in vertical the co-benefits levels of impact proposed by Ryan & Campbell (2012) are combine horizontally with an adaptation of the three domain of impact used by Kelly (2009).
Domain
Level Energy security Long-term sustainability Welfare
Individual improving energy affordability
and access None
ameliorating health and wellbeing; increasing disposable income
Sectoral None reducing costs for energy
providers and energy peak
higher industrial productivity and competiveness;
bigger assets values; increasing GDP
National improving national energy
security; None
creating jobs
International moderating energy prices
regionally;
reducing the extraction of natural resources; meeting development goals;
moderating energy prices regionally; meeting development goals
The world is facing challenges on multiple levels and domains. Improving energy efficiency for attacking one of these challenges means to attack all the others. It follows that someone may be skeptical on some of the challenges but not on all of them. This is why energy efficiency is widely recognized as a desired and appealing goal. Although these co-benefits are often not all quantified or identified by policymakers, the impacts listed above can still have a key role in making energy efficiency a priority for policymakers and then prompt them to implement policies that also mitigate GHG emissions (Blok et al., 2007). This is particularly true in countries where environmentalism does not have a strong tradition or a priority role in political agenda or occupies daily concerns of citizens. (Blok et al., 2007). In conclusion, in the light of what has been discussed so far, the buildings’ stock seems to be a major player in “both causes and solutions of these challenges” (Kelly 2009).
Table 2-1: Energy-efficiency related co-benefits level and domain of impact
Table 2-1: Energy-efficiency related co-benefits level and domain of impact
Table 2-1: Energy-efficiency related co-benefits level and domain of impact
Table 2-1: Energy-efficiency related co-benefits level and domain of impact
Table 2-1: Energy-efficiency related co-benefits level and domain of impact
Table 2-1: Energy-efficiency related co-benefits level and domain of impact
Table 2-1: Energy-efficiency related co-benefits level and domain of impact
Table 2-1: Energy-efficiency related co-benefits level and domain of impact
Table 2-1: Energy-efficiency related co-benefits level and domain of impact
Table 2-1: Energy-efficiency related co-benefits level and domain of impact
Table 2-1: Energy-efficiency related co-benefits level and domain of impact
Table 2-1: Energy-efficiency related co-benefits level and domain of impact
Table 2-1: Energy-efficiency related co-benefits level and domain of impact
Table 2-1: Energy-efficiency related co-benefits level and domain of impact
Table 2-1: Energy-efficiency related co-benefits level and domain of impact
Table 2-1: Energy-efficiency related co-benefits level and domain of impact Compiled and conceived by the author
Table 2-2: Summary of the overviewed retrofit measuresCompiled and conceived by the author
Table 2-2: Summary of the overviewed retrofit measures
Table 2-2: Summary of the overviewed retrofit measuresCompiled and conceived by the author
Table 2-2: Summary of the overviewed retrofit measuresCompiled and conceived by the author
Table 2-2: Summary of the overviewed retrofit measures
13
2.4. Closing the energy efficiency gap: retrofit
As it was shown, there are mainly two ways to reduce the energy efficiency in buildings: re-engineering the fabric of the buildings and improving the energy efficiency of appliances used in offices and, in particularly, houses.
For what concerns buildings’ appliances, evidence suggests that in a wide number of countries devices and machines energy efficiency has increased in the last years (IPCC, 2014), even three times more than underlying rate of technological improvement (Lane, 2015). This substantial improvement has translated into energy saving and therefore in carbon emissions reduction. For example, in the countries in which robust actions have been taken to improve appliances performance at a lower energy cost, it has been estimated it saved between 10% and 15% of national or sectoral energy utilization (Lane, 2015). Moreover, the issues related to the expensiveness of efficient appliances acting as barrier for the low income households uptake, i.e. Faberi, Mebane, & Presutto (2001), it has been resolved by a ‘natural’ decrease in purchase prices (see economy of scale and learning curves effects). This means that policies that have been undertaken (e.g. labelling1) worked relatively well. Even if there still room for improvements in the appliances’ efficiency,
where it seems that much needs to be done regards the building fabric (Ürge-Vorsatz et al., 2007). To increase the energy efficiency of the building stock means to diminish the quantity of energy consumed during their life-long (in particularly the energy required for indoor heating). There are principally two ways. The first one is to construct new buildings in a more efficient way and support the depletion rate of high inefficient buildings. The second is to retrofit the existing stock (the operation of improving the energetic performance of a building). Acting on the new constructions is easier for policymakers than increasing the retrofit uptake rate, since setting efficient standards for new edifices is relatively straightforward process (although, implementation may raise several issues), while operating on existing building, especially on the houses people live in, is considered a very sensitive subject due to the high sentiment people project in their home (Soo, 2015).
Unfortunately, due to the low replacing rate, most of the existing building stock will still be present in 2050 in most countries (IPCC, 2014), especially in the developed ones, e.g. in Europe it has been predicted that 80% of the actual stock will still be there (Serghides, Dimitriou, & Katafygiotou, 2016). The replacement time is a key concept that needs to be understood in order to comprehend the necessity of retrofit. The replacement time of appliances is relatively much shorter than the buildings’ one. This means that it is not necessary to act on the appliances in use in order to meet the reduction goals in that sector, but producing and commercializing efficient ones and wait for the natural replacement of old and broken devices can be
1 A practical example of labelling policy is the one put in place by European Union and can be found at the following link.
14 enough in order to meet the targets on time (Blok et al., 2007). Conversely, this is not true for the building stock. That is why retrofit is necessary at this stage.
At the moment there is a plethora of ways thorough which is possible to retrofit an existing building (Blok et al., 2007; IPCC, 2014). Table 2-2 offers a summary of the measures that will discussed below.
Direction of action Examples of retrofit measures
Thermal envelop Walls insulation, ceiling insulation, basement insulation,
doors and windows frames, ventilation system
Building heating system
Solar passive technologies (airflow windows, preheating or pre-cooling buried pipes, solar air collectors, sun-facing glazing)
Space heating system Condensing boiler, heat pump, passive ventilation
mechanisms, customize ventilation
Heating, ventilation and air-conditioning systems (HVAC) Demand-controlled airflows systems, displaced ventilation
Building energy management Smart buildings, smart meters, centralized electronic
energy management systems
Lighting Daylight sensors, efficient lightning devices
Solar energy Devices for capturing solar-thermal energy to heat up water
and indoor air
One of the principal retrofit interventions is to act on the thermal envelop of the building. Thermal envelop refers to the building shell as a barrier to unwanted heat transfer between inside and outside the edifice. The effectiveness of this envelop depends on (Blok et al., 2007): the insulation levels in the walls, ceiling, loft, basement;the thermic features of doors and windows; and the stream of inside/outside air exchange which depends on the edifice air-tightness, on ventilation (mechanical and non-mechanical) and on external driving forces (e.g. wind, inside-outside temperature or air pressure differences). Improvements in inefficient thermal envelops can have big impacts in reducing energy consumption for heating by a factor from two up to four compare to standard practices at a relatively low cost-effectiveness for both residential and commercial buildings (Hamada, Nakamura, Ochifuji, Yokoyama, & Nagano, 2003; Hastings, 2004 cited in Blok
Table 2-2: Summary of the overviewed retrofit measures
Table 2-2: Summary of the overviewed retrofit measures
Table 2-2: Summary of the overviewed retrofit measures
Table 2-2: Summary of the overviewed retrofit measures
Table 2-2: Summary of the overviewed retrofit measures
Table 2-2: Summary of the overviewed retrofit measures
Table 2-2: Summary of the overviewed retrofit measures
Table 2-2: Summary of the overviewed retrofit measures
Table 2-2: Summary of the overviewed retrofit measures
Table 2-2: Summary of the overviewed retrofit measures
Table 2-2: Summary of the overviewed retrofit measures
Table 2-2: Summary of the overviewed retrofit measures
Table 2-2: Summary of the overviewed retrofit measures
Table 2-2: Summary of the overviewed retrofit measures
Table 2-2: Summary of the overviewed retrofit measures
Table 2-2: Summary of the overviewed retrofit measures Compiled and conceived by the author
Table 2-3: Retrofit policy portfolioCompile and conceived by the author
Table 2-3: Retrofit policy portfolio
Table 2-3: Retrofit policy portfolioCompile and conceived by the author
Table 2-3: Retrofit policy portfolioCompile and conceived by the author
Table 2-3: Retrofit policy portfolio
15 et al., 2007, p. 395). Moreover, it does not just help to keep the edifice warm in winter, but it also considerably reduce indoor summer temperature thus it lowers the energy used to cool down the fabric. Another option for retrofit is to act on the building heating system. It can consist, for example, in implanting solar passive heating technologies (Blok et al., 2007) such as: airflow windows, preheating or pre-cooling air ventilation through buried pipes, solar air collectors (mounted on walls or roofs), extensive sun-facing glazing, etc. Or alternatively, the effort may be towards increasing the efficiency of the space heating system: new condensing boilers (in which additional heat is recovered as part of the water vapour in the outlet valve is condensed and reused, see Palmer & Cooper, 2013), heat pumps (a device that uses energy inputs to transfer heat from the outside air or ground in the winter to mediumused to distribute heat in a building), etc. Also the cooling effort can be reduced, thorough the use of passive techniques (e.g. fans or pumps that do not require mechanical energy) to meet part of the cooling load, via the increase of cooling equipment performance at parity of energy consumption,and combination of efficient auxiliary systems (e.g. customized and proper ventilation). These have proven to generate significant energy consumption reduction (Blok et al., 2007). This has become a more salient issue considering the recent trends in which the penetration of air conditioning in developing countries is quickly rising and reaching even higher peaks in developed ones (Blok et al., 2007). In line to what has been said, the heating, ventilation and air-conditioning systems (HVAC) (namely filtration, humidification, dehumidification, heating and cooling) need to be adjusted and tailored to the fabric of the building and to the situation. This provides massive savings according to Blok et al. (2007). For example installing demand-controlled airflows in which ventilation systems adaptsto the change building occupancy can alone save 20-30% of total HVAC energy consumption (Brandemuehl & Braun, 1999 cited in Ürge-Vorsatz et al., 2012, p. 683). Or new systems like displacement ventilation have been reported to reduce HVAC energy use by 30 to 75% (Blok et al., 2007). Another type of retrofit listed by Block et al. (2007) is the improvement of building energy management (BEM). BEMSs are control systems for buildings that use computers for monitoring and managing the use of energy. Nowadays, the edifices that implement this type of technology are also known as smart buildings. These systems to help avoid energy waste because they support building occupiers to efficiently manage the consumption and also make faults easy to be detected (through smart meters). Estimates of the potential savings vary much in literature ranging from 5 to 40% (Blok et al., 2007). Moreover, smart buildings can be easily combined with daylight sensors to dim or switch off lighting,diminishing energy waste. This if integrated with the most efficient lightning devices can reduce by 75% up to 90% lightning energy consumption (Blok et al., 2007). Other retrofit opportunities come from the use of solar energy. For example, solar-thermal energy can be utilized for heating water and indoor air offering savings on the energy used for warming water and air that range from 10 to 60%, depending on the fabric (Blok et al., 2007).
16 The measures listed above are not all the measures available. There is a vast literature on that. The idea of this last paragraph was to show the high number of potential measures that are available. Moreover, many of these can be combined when it is time to retrofit a property, offering even a wider range of options and increasing the CO2 savings. Nevertheless, as it was shown, the uptake rate of energy efficiency gap for buildings and housing is far to be at an optimal level.
2.5. Policies to support retrofit uptake rate
Although improvements in energy efficiency evidently reduce buildings and housing energy consumption, as well as providing a broad range of co-benefits, its uptake rate is lower than desired ad the energy efficiency gap discussed above still persists all around the world. The causes of this unfavourable situation have been identified in the presence of decision-making, informational and economical barriers (Wilson et al., 2015) that interfere and hinder people to install retrofit measures in their property (all these obstacles vary from case to case, therefore the ones related to UK will be presented and discussed in detail in chapter 3.4). Therefore, market forces alonewill not lead to the indispensableconversion towards low carbon buildings without external policy intercession (Lucon et al., 2014). However, there is no consensus among policymakers about which strategies are necessary and most effective to overcome the barriers (Yang, 2012). Hence, from this perspective, the greatest challenge is the development of effective intervention for improving the energy efficiency of existing buildings and houses (Ürge-Vorsatz, Koeppel, et al., 2007). The International Panel on Climate Change (IPCC) through the 3rd Working Group (Lucon et al., 2014) to the Fifth Assessment Report
(IPCC, 2014) grouped the broad portfolio of policy instruments in six categories. The detailed policies are reported and described in Table 2-3 at the end of this chapter. First, regulatory measures seem to be some of the most effective and cost-effective tools. Examples are building codes and appliance standards. However, standards need to be carefully set at proper level and periodically raised in order to avoid to be locked in suboptimal performances. Moreover, enforcement has not always been easy. Second, information
instruments (e.g. equipment energy labels, building labels and certificates, and mandatory energy audits) are
usually implemented as support of other policy interventions, in particular standards. However, they proved to be relatively effective also on their own. Third, direct market intervention instruments include public procurement or the development of energy service companies (ESCOs). These interventions in some cases had a real impact in transforming the market. Fourth, economic instruments comprehend several options, including tradable permits (tradable white certificates and broader carbon markets), energy carbon taxes, tax rebates (e.g. tax deductions building retrofits, value-added tax exemption, various tax reliefs), and more focussed incentives (low interest loans and incentives). The fifth category are the voluntary agreements, for example with industries. However, the effectiveness of these policies is extremely context-dependent and in many cases they need to be accompanied with other policy measures. The sixth and last type includes advice
17
and leadership programmes, such as information campaigns, advice services, and public leadership
programmes. The objective of these interventions is to build public awareness and capacity. Although virtually any of these tools can perform very effectively (environmentally and costwise) if adjusted to the context and if implemented and enforced properly, there is a remarkable spread in the policies’ performances and results when it comes to reality (Blok et al., 2007; Lucon et al., 2014). What can be safely stated is that one policy alone in most cases appears not to be enough to achieve significant results but combinations of them (policy packages) seem to be the most sounded approach (Lucon et al., 2014). For example, appliances market transformation has been realized through a combination of energy labels, minimum standards, incentives for efficient equipment and communication campaigns (Lucon et al., 2014). Integration with other policy domains (see co-benefits) is particularly effective and energy-efficiency can be pursued more forcefully through other policy goalsthat occupy higher positions in the political agendas. Thus retrofit may benefit of more resources and of stronger political support than just climate change mitigation (Ryan & Campbell, 2012). Moreover, IPCC state that to obtain the broadest impact possible policymakers should adopt and holistic approach considering the whole life span of the building and to not neglect the fact that a skilled workforce is needed to fulfill the instalments (Lucon et al., 2014). Lastly, policies should be dynamic, namely with periodic revisions to adapt to technical and market changes (especially regulations may need to be strengthened over time).
Up to know, policymakers have mainly focused on technological improvements in energy efficiency (Geller, Harrington, Rosenfeld, Tanishima, & Unander, 2006). However, especially in developed countries, they began to direct their action towards the existing building stock. This because it is extremely large and renewed very slowly, therefore it has been targeted through policies aiming at accelerating rates of energy refurbishment and regulatory building codes (Lucon et al., 2014). Concerning these lasts, in the last years a large number of executives have set or are considering important strengthening of the requirements in these regulations. Moreover, several emerging policy instruments are starting to gain the attention of policymakers. Some of them, started to act on consumer behaviour in order to reduce energy demand. For instance, they recently started to direct their action on the need to change society behaviours towards more sustainable ones (Lucon et al, 2014). Policy tools for capping or discouraging increasing energy use include: personal carbon trading with personal carbon allocations (but this action still have not been introduced yet), property taxation related to CO2 emission and energy saving feed-in tariff (incentive to reduce energy consumption. In addition, energy
efficiency obligation schemes are being diffused in several countries (e.g. some UE states, Brazil, India and Australia). These certificates are also known as suppliers’ obligations and their main application has been in regulated markets directed by obligations upon energy companies to save energy (Lucon et al, 2014). This policy instrument was first applied in Europe and it proved to be very effective (Bertoldi, 2012 cited in Lucon et al, 2014, p. 720). However, these certificates have a downside: they are incline to incentivize cheap and
18 mass market measures rather thanmassive, expensive and more effective in terms of savings retrofit. This fact has instilled some concerns on the ability of these policies not to be the best suited for high saving targets (Eyre et al., 2009 cited in Lucon et al, 2014, p. 720). Policymakers are also looking at financial tools that could stimulate and support energy efficiency uptake. Several retrofit technologies have shown to be economically convenient and if properly financed the costs are paid back in a relative short time frame by the energy savings. Unfortunately still many potentially attractive investments in energy efficiency are not undertaken because there are not financial products available, because they do not meet short-term financial return criteria or because customers are very initial-cost sensitive. The major causes of this gap have been identified in the lack of relevant finance and of bankable energy efficiency offers. Germany made an innovative attempt to overcome these issues. Through the KfW (Kreditanstalt für Wiederaufbau) development bank, loans for energy efficiency with very low interest rate (compare to the market) making them very attractive for households. Up to now, the scheme has been successful in supporting many building refurbishments (Rosenow, Eyre, Bürger, & Rohde, 2013).Also, UK tried a market-based approach with another innovative policy called ‘Green Deal’ that unfortunately did not delivered the expected results (it will be discussed in detail in the next chapter). Another financial solution to overcome economic constraints is to involve external investors (e.g. commercial banks, venture capital firms, equity funds, etc.) in contributing to the retrofit and repay their investments through the energy savings. It works best for huge projects (e.g. social housing), since the profits for individual cases are not high enough for the investors (Lucon et al, 2014). Moreover, there is need to guarantee that energy savings are able to repay the investments in order to tempt investors. Lastly, opportunities in financing for green buildings are slowly gathering interests. Japanese financial institutions started to offer products that provide a discount greater than 1% on mortgages and loans for constructing or buying a house, depending on the grade of efficiency received by a public assessment done by the municipality (Murakami et al., 2004 cited in Lucon et al, 2014, p.720). From first evaluations it appears to have contributed to the diffusion of green buildings.