Physicochemical quality, macronutrients, and dietary fiber in
apples from the Protected Geographical Indication ‘Maçã de
Alcobaça’, Portugal
D.P.F. Almeida
1and M.H. Gomes
21 Universidade de Lisboa, Instituto Superior de Agronomia, Lisboa, Portugal
2 CBQF, Escola Superior de Biotecnologia, Universidade Católica Portuguesa, Porto, Portugal
Original article – Thematic Issue
Introduction
Apple is the largest fruit category in the European mar-ket. This fruit is part of the regular purchasing habits of Eu-ropean consumers who have a gross annual per capita apple consumption of ca. 19 kg (Martinez-Palou and Rohner-Tie-len, 2008). Dozens of cultivar groups with distinct sensory attributes are available. Market categories are currently defined according to skin color (yellow, green, red, bicolor, and russet), perception of sweetness or acidity (sweet and sour), and texture. In Europe, consumers expect small stores to display 3 to 5 apple types whereas a large supermarket provides up to 8 or 12 apple categories. The visual and taste diversity of apple fruit corresponds to differences in chemi-cal composition with nutritional relevance. However, the lev-el of important bioactive compounds, such as total phenolics
Summary
Apple is a major fruit in the European diet. The range of cultivar types and origins diversify the nutritional composition of apples. Eight apple cultivars (Malus ×domestica Borkh. ‘Casa Nova’, ‘Fuji’, ‘Galaxy’, ‘Golden Delicious’, ‘Granny Smith’, ‘Jonagored’, ‘Reinette’, and ‘Starking’) with the “Maçã de Alcobaça” Protected Geographical Indication (PGI), Portugal, were harvested at commercial maturity, stored for 3 to 3.5 months at 0°C, and characterized at the edible stage for their nutritional composition. Fruit quality was assessed by color, soluble solids content, titratable acidity, pH, Thiault index and firmness. The concentration moisture, dry matter, carbohydrates, protein, fat, ash, and fiber defined the nutritional profile. ‘Reinette’ had highest soluble solids content, titratable acidity, carbohydrates, protein, ash, energy, dry matter. ‘Granny Smith’ had the lowest soluble solids and carbohydrates contents, dry matter and energy. ‘Casa Nova’, a traditional cultivar, had high fiber content. Energy content varied by more than 30%, lowest in ‘Granny Smith’ and highest in ‘Reinette’, and is strongly correlated with dry matter and soluble solids content. The cultivar-specific range of nutritional value provides a basis for market segmentation based on nutritional content. Keywords
denomination of origin, fruit quality, market
segmentation, Malus ×domestica, nutritional composition
Significance of this study
What is already known on this subject?
• The nutritional composition of apples is characterized and available in the nutritional databases but the aggregate nutritional data do not allow the market positioning of apple types based on cultivar or origin.
What are the new findings?
• Nutritional composition of eight apple cultivars from one of the European PGI showed a 30 to 67% difference in carbohydrate, protein, fat, and ash content, a variation of 80% in fiber, and a 2.4-fold difference in protein. At the edible stage, there was 40% difference in soluble solids but a 3.7-fold difference in titratable acidity. Soluble solids to acidity ratio is more variable (387%) among cultivar types than the Thiault index (51%).
What is the expected impact on horticulture?
• The cultivar-specific nutritional composition
associated to a terroir supports the European policy of produce differentiation linked to geographical origin, provides cultivar-specific information to consumers, and supports supply-chain operators to develop a strategy of market segmentation of apple cultivars based on nutritional quality.
and flavonoids, is highly variable among apple cultivars and is not directly related to the color of apples (Almeida et al., 2017). As nutritional quality of fresh fruit becomes more im-portant, supply-chain operators can use specific information of nutritional composition to communicate to consumers and support novel market segmentations. The segmentation of apple cultivars based on their phytochemical composition was recently proposed (Almeida et al., 2017).
The European quality policy for agricultural products promotes and protects products with specific characteristics linked to a geographical area. Regulation (EU) No. 1151/2012 recognizes that fruit can be marketed under a protected des-ignation of origin if the product “quality, reputation or other characteristic is essentially attributable to its geographical origin”. A geographical indication is therefore an important marketing tool, protected by intellectual property rights, to support product differentiation and regional development (Bowen, 2010). Denominations of origin have, therefore, be-come an important instrument to differentiate and add value to fresh fruit.
German Society for Horticultural Science
The majority of European food products with protected geographical origins are from the Mediterranean countries Portugal, Spain, France, Italy, and Greece. Among the Europe-an fruit with protected denominations there are 23 fresh ap-ples (EU, 2017). “Maçã de Alcobaça” is a Protected Geograph-ical Indication (PGI) for apple cultivars grown in the Oeste Region of Portugal, a region with a polyculture agricultural system and a fruit growing tradition rooted in the Cistercian monastical delimitation of “Coutos de Alcobaça” during the 12th century. The natural conditions are characterized by an
average annual temperature of circa 15°C, total rainfall rang-ing from 600 to 900 mm, high insolation (2,400 to 2,500 h) and high relative humidity from Atlantic influence. Market awareness of the PDI “Maçã de Alcobaça” is high in Portu-gal. With an annual production of circa 50,000 t, the region accounts for 17% of the 295,340 t (average 2013–2015) of apples produced in the country (INE, 2016).
Apple fruit can provide satiety with a lower caloric input than many other foods, namely processed snacks, thus con-tributing to a healthy diet. Although the overall nutritional composition of apple fruit is characterized and readily avail-able in the main national and international food composi-tion databases and tables (Souci et al., 2000; USDA, 2015), the aggregate data do not allow an adequate segmentation of apple types or a detailed study of country-specific dietary intakes. Country-specific food composition databases remain an important tool to develop food policies and nutritional recommendations, since cultivars and production conditions affect nutritional composition (Black et al., 2011; Korošec et al., 2013; Machackova et al., 2013). Data on fruit composition have a wide range of uses in clinical practice, epidemiological research, public health and education, and by the food indus-try (Williamson, 2006). In addition, these data also support the food quality policy, which require an examination of com-positional information on fruit with protected geographic origins.
The objective of this study was to characterize the qual-ity variables and nutritional composition of the main apple cultivars from the PDI “Maçã de Alcobaça” at the edible stage. This detailed information complements the characterization of the bioactive phytochemicals of “Maçã de Alcobaça” apple cultivars (Almeida et al., 2017) to support the improvement of nutritional databases, provide cultivar-specific informa-tion to consumers, establish baseline composiinforma-tional infor-mation to support the quality policy for agricultural prod-ucts linked to geographical origins, and allow supply-chain operators to develop market segments based on nutritional quality.
Materials and methods
FruitApple (Malus ×domestica Borkh.) cultivars ‘Casa Nova’, ‘Fuji’, ‘Galaxy’, ‘Golden Delicious’, ‘Granny Smith’, ‘Jonagored’, ‘Reinette’, and ‘Starking’ grown in PGI of “Maçã de Alcobaça” were harvested at commercial maturity. Fruits of average market size were stored at 0°C, 90–95% relative humidity for 3.0 to 3.5 months and prepared for analyses in the beginning of December.
Quality evaluation
Fruit were assessed for color, firmness, soluble solids concentration (SSC), titratable acidity, and the Thiault index. Surface color was measured in the CIE L*a*b* color space, with a CR-300 colorimeter (Konica Minolta, Japan), using the
D65 illuminant. Hue angle [h° = arctan (b*/a*)] and chroma
[C* = (a2+b2)1/2] were calculated from the primary a* and b*
readings. Two color measurements were performed on op-posite sides of each fruit.
Flesh firmness was measured in the equatorial region of fruit, after peel removal, using a penetrometer (McCor-mick, FT327, Alphonsine, Italy) mounted on a stand drill and equipped with probe with 11 mm in diameter. Duplicate measurements were performed on opposite sides of each fruit.
Three fruit samples per cultivar were homogenized, fil-tered through a cellulose filter before measurements of SSC, juice pH, and titratable acidity (TA). SSC was measured with a Palette PR-32 digital refractometer (Atago, Tokyo, Japan), pH measured by potentiometry with and a Ion 510 pH meter (Oakton, Vernon Hills, IL, USA). TA was determined by titra-tion of the juice with 0.1 M NaOH to pH 8.1 and expressed as malic acid equivalents. The Thiault index (TI) was calculated from the measurements of SSC, expressed in gram of sucrose per liter, and TA expressed as malic acid equivalents, using the equation: TI = SSC + 10 ⨯ TA.
Proximate analyses
Dry matter and moisture contents were determined by the static gravimetric method drying the samples at 105°C in a convection oven (Memmert 500, Schwabach, Germany) un-til constant weight. Total nitrogen content was determined by the micro-Kjeldahl method (FIL-IDF; 1993) using a Kjeltec system 1002 distilling unit (Tecator, Höganäs, Sweden) and the value converted to crude protein using the factor 6.25.
To determine ash content, previous weighed samples were incinerated at 525°C ± 25°C until constant weight, ac-cording to the AOAC 940.26 method.
Total fat was determined by the method described in MSDA 22/5.1. Samples were digested with HCl at 4 M and the remaining fat filtrated, dried and extracted with petroleum ether in a Soxhlet apparatus for 4 h; the solvent was eliminat-ed by evaporation and the extract was drieliminat-ed and weighteliminat-ed.
Total carbohydrates were determined by difference, sub-tracting the water, protein, fat, and ash contents from the ini-tial weight (FAO, 2003).
The energy of the apple edible part was calculated using the following conversion factors: 9 kcal g-1 for fat, 4 kcal g-1
for protein, 3.75 kcal g-1 for carbohydrate (soluble solids),
3 kcal g-1 for organic acids, and 2 kcal g-1 for fiber.
Dietary fiber
Total dietary fiber was determined by the enzymat-ic-gravimetric method (AOAC 985.29; AOAC 991.43).
Statistical analysis
Data were subjected to one-way analysis of variance (ANOVA) with cultivar as a fixed factor. When the cultivar effect was significant at the P ≤ 0.05, means were separated by the Duncan’s multiple range test. Statistical analyses were performed with SPSS (v. 17, Chicago IL, USA).
Results and discussion
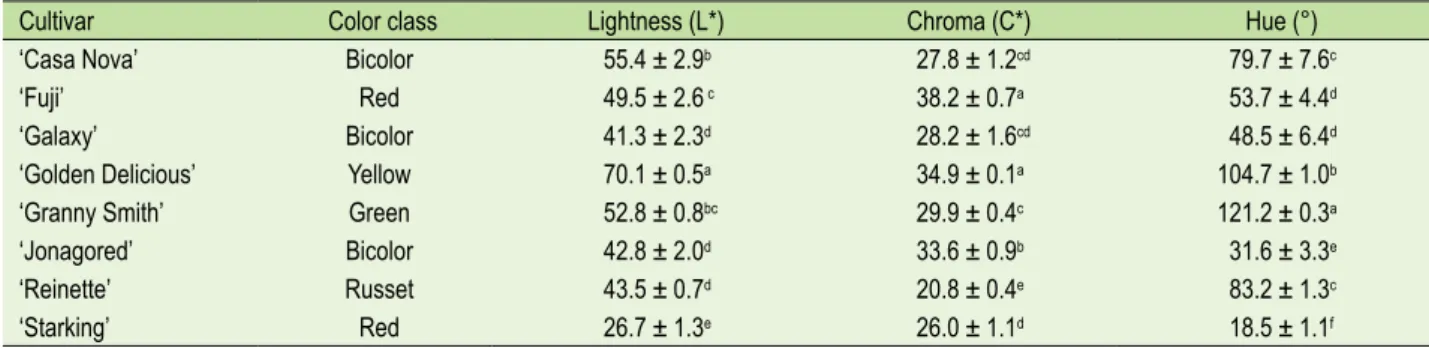
Skin colorColor is a major criterion for market segmentation of ap-ple cultivars: green, yellow, red, bicolor, and russet are the major market categories based on skin color. The eight apple cultivars characterized belong to five color classes (Table 1). Skin color, dependent on the dominant pigments and their
combinations, is genetically determined with a strong in-fluence of developmental stage and environmental factors, namely temperature (Lancaster and Dougall, 1992). The hue angles reported are consistent with the characteristic fruit color of each cultivar, namely 18.5 ± 1.1° for the red ‘Starking’, 104.7 ± 1.0° for the yellow ‘Golden Delicious’, 121.2 ± 0.3° for the green ‘Granny Smith’, 83.2 ± 1.3° for the russet ‘Reinette’ and ranging from 31.6 ± 3.3° to 79.7 ± 7.6° for the bicolor cultivars ‘Jonagored’, ‘Fuji’, ‘Galaxy’ and ‘Casa Nova’ (Table 1).
The environmental effects on skin color has geographic and seasonal implications. For instance, the color of ‘Gal-axy’ in this study (L* = 41.3; C* = 28.2; h° = 48.5; Table 1) is significantly different from that of the same cultivar grown in southern Brazil (L* = 33.5; C* = 40.4; h° = 23.5; Vieira et al., 2009), but lightness and hue angles of ‘Golden Delicious’, ‘Granny Smith’, and ‘Jonagored’ were similar to those report-ed for fruit grown in Spain (Iglesias et al., 2008).
Skin color within a given market class strongly influenc-es apple commercial value (Iglinfluenc-esias and Alegre, 2006) since deficient color development is associated with a poor visual appraisal (Crassweller and Hollender, 1989; Baugher et al., 1990).
The relationship between color and the type of pigments present in the peel and their concentration has nutritional implications. Apple skin color is determined by the relative concentration of three chemical classes of pigments: chloro-phyll, carotenoids, and anthocyanins. Apple skin darkness increases with anthocyanin concentration, vacuole size and the number of layers of red cells. A change in the hue of ap-ple skin from orange-red to purap-ple-red is likely to result from the visual blending of chlorophyll, carotenoids, and
anins (Lancaster et al., 1994). However, except for anthocy-anin, there is no relationship between apple antioxidant ac-tivity, total phenolic, and total flavonoid concentration and skin color (Almeida et al., 2017).
Firmness
Firmness is one of the attributes of texture. The flesh firmness of apple cultivars ranged from 41 N in ‘Golden De-licious’ and 43 N in ‘Jonagored’ to 68 N in ‘Galaxy’ and ‘Fuji’ (Table 2). At the time of analysis ‘Galaxy’, ‘Granny Smith’, ‘Fuji’, ‘Reinette’, and ‘Starking’ had firmness values higher than 60 N while ‘Golden Delicious’ and ‘Jonagored’ had sig-nificantly lower firmness values (41–43 N). Firmness is a major determinant of consumer acceptance; for example, apple acceptance by American consumers is higher in fruits with firmness above 62 N (Harker et al., 2008).
Taste components
Apple taste is partially determined by the relative pro-portion of sugars and organic acids. SSC ranged from 10.8% in ‘Granny Smith’ to 15% in ‘Reinette’ (Table 2). Titratable acidity ranged from 0.20% in ‘Fuji’ and ‘Starking’ to 0.73% in ‘Reinette’ (Table 2). The pH values of the apple cultivars ranged from 3.3 in ‘Reinette’ to 4.1 in ‘Fuji’ and ‘Starking’ (Ta-ble 2). Overall, SSC, acidity and pH are consistent with those reported for the same apple cultivars elsewhere (Wu et al., 2007; Vieira et al., 2009) but a SSC of 13% was measured in ‘Granny Smith’ (Nour et al., 2010).
Table 1. Surface color of eight apples cultivars belonging to different classes. Values are mean ± standard deviation (n = 3).
Means within the same column followed by the same letter are not statistically different at α = 0.05.
Cultivar Color class Lightness (L*) Chroma (C*) Hue (°)
‘Casa Nova’ Bicolor 55.4 ± 2.9b 27.8 ± 1.2cd 79.7 ± 7.6c
‘Fuji’ Red 49.5 ± 2.6 c 38.2 ± 0.7a 53.7 ± 4.4d
‘Galaxy’ Bicolor 41.3 ± 2.3d 28.2 ± 1.6cd 48.5 ± 6.4d
‘Golden Delicious’ Yellow 70.1 ± 0.5a 34.9 ± 0.1a 104.7 ± 1.0b
‘Granny Smith’ Green 52.8 ± 0.8bc 29.9 ± 0.4c 121.2 ± 0.3a
‘Jonagored’ Bicolor 42.8 ± 2.0d 33.6 ± 0.9b 31.6 ± 3.3e
‘Reinette’ Russet 43.5 ± 0.7d 20.8 ± 0.4e 83.2 ± 1.3c
‘Starking’ Red 26.7 ± 1.3e 26.0 ± 1.1d 18.5 ± 1.1f
Table 2. Firmness, soluble solids, and acidity of eight apple cultivars. Values are means ± standard deviation (n = 3). Means
within the same column followed by the same letter are not statistically different at α = 0.05. Cultivar Firmness (N) Soluble solids(%, w/w) Titratable acidity
(%, w/w) pH
SSC/TA
ratio Thiault index Class ‘Casa Nova’ 57 ± 0.2c 13.2 ± 0.4b 0.53 ± 0.03c 3.4 ± 0.0d 25 ± 1.0e 185 ± 7b Acid
‘Fuji’ 68 ± 1.7a 13.9 ± 0.3b 0.20 ± 0.00e 4.1 ± 0.0a 70 ± 1.0a 159 ± 2d Sweet
‘Galaxy’ 68 ± 0.2a 13.3 ± 0.3b 0.30 ± 0.01d 3.9 ± 0.0c 44 ± 1.0d 163 ± 3cde Sweet
‘Golden Delicious’ 41 ± 0.1d 12.4 ± 0.3b 0.23 ± 0.03de 4.0 ± 0.0b 55 ± 2.0c 148 ± 5e Sweet
‘Granny Smith’ 62 ± 0.2b 10.8 ± 0.6c 0.60 ± 0.01b 3.7 ± 0.0d 18 ± 1.0e 168 ± 6c Acid
‘Jonagored’ 43 ± 0.1d 13.7 ± 0.4b 0.30 ± 0.00d 3.8 ± 0.0c 46 ± 1.0d 167 ± 4cd Sweet
‘Reinette’ 62 ± 0.2b 15.0 ± 0.3a 0.73 ± 0.03a 3.3 ± 0.0d 21 ± 1.0e 223 ± 3a Acid
‘Starking’ 66 ± 0.2b 13.2 ± 0.5b 0.20 ± 0.01e 4.1 ± 0.0a 66 ± 2.0b 152 ± 5de Sweet
Consumer perception of sweetness or sourness is de-termined not only by the concentration and type of sugars and acids, but also by the relative proportion of each. Two indices have been used in apple to describe the relationship between sugars and acids and express taste equilibrium: the simple ratio between SSC and TA and the Thiault index. In this study (Table 2), ‘Starking’ (66) and ‘Fuji’ (70) had the highest ratios, while the lowest were found in ‘Granny Smith’ and ‘Reinette’ (18 and 21, respectively). Apple cultivars with a SSC/TA ratio above 20 are considered sweet while fruits with low ratios are perceived as sour (Lea, 1995). Significant differences in perceived taste of the same cultivar are likely to occur. For instance, the SSC/TA ratio of ‘Golden Delicious’ (55) was almost twice the value reported by Petkovsek et al. (2007) for the same cultivar in Slovenia.
The Thiault index, obtained by the addition of SSC and 10-fold the malic acid concentration, is frequently used to characterize apple fruit quality at harvest and fruit stor-ability (Thiault, 1970). Values for the Thiault index higher than 170 are considered acceptable for some apple cultivars (Porro et al., 2002). The higher Thiault indices were found in ‘Reinette’ and ‘Casa Nova’, and the lowest in ‘Golden De-licious’, ‘Fuji’ and ‘Starking’ (Table 2), but consumer prefer-ence is highly segmented in apple.
Dry matter content
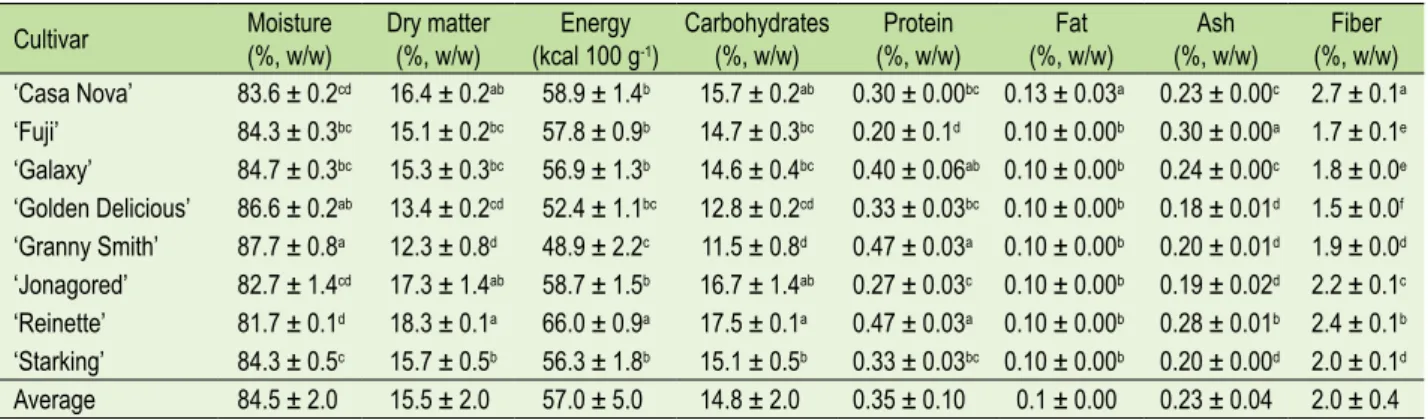
Moisture and dry matter content are relevant variables in fresh apples, determining the sensory perception of fruit juiciness, freshness, and sweetness. In addition, nutrients, functional phytochemicals, and flavor-important com-pounds are part of the dry matter fraction. Dry matter con-tent (Table 3) was significantly higher in ‘Reinette’ (18.3%) and lower in ‘Granny Smith’ (12.3%) and ‘Golden Delicious’ (13.4%). The dry matter content of ‘Golden Delicious’ and ‘Granny Smith’ was lower than that reported in Romania for the same cultivars, 14.7% and 14.9%, respectively (Nour et al., 2010). Dry matter content (DM) was linearly related to the SSC (DM = 4.523 + 0.559 × SSC; R2 = 0.816; n = 8.) The
ad-dition of SSC and titratable acidity (TA) slightly improves the relationship [DM = 4.564 + 0.581 × (SSC+TA)]; R² = 0.849;
n = 8). The water content of fresh apples reported herein
varied from 81.7 to 87.7% (w/w), which is consistent with the values reported elsewhere (Feliciano et al., 2010; Aprifel, 2015; USDA, 2015).
Macronutrient composition and energy content
Protein levels ranged from 0.20% in ‘Fuji’ to 0.47% in ‘Reinette’ and ‘Granny Smith’ (Table 3), a 2.3-fold range. The protein concentrations found in this study were higher than those reported for similar cultivars (Escarpa and González, 2001; Feliciano et al., 2010), but within the range indicat-ed for apple in nutritional composition databases (Aprifel, 2015; USDA, 2015).
Total carbohydrate concentration ranged from 11.5% in ‘Granny Smith’ to 17.5% in ‘Reinette’ (Table 3). Three major categories of nutritionally distinct compounds are included in the total carbohydrate fraction: sugars, insoluble carbohy-drates, and dietary fiber (Biliaderis and Izydorczyk, 2007).
Fat content was 0.10% in all cultivars except ‘Casa Nova’ with 0.13% (Table 3). Total mineral content (ashes) ranged from 0.18% in ‘Golden Delicious’ to 0.28 % in ‘Reinette’ (Ta-ble 3). The addition of ashes did not improve the linear rela-tionship between dry matter content and the combined SSC and titratable acidity (data not shown) suggesting that the contribution of minerals for the apple refractometric index is negligible.
Dietary fiber of the apple cultivars ranged from 1.5% in ‘Golden Delicious’ to 2.7% in ‘Casa Nova’ (Table 3). These values are lower when compared with those reported for un-peeled apples (Marlett and Vollendorf, 1994; USDA, 2015).
The mean energy levels of apple cultivars was 57 kcal per 100 g of edible portion but ranged between 48.9 and 66.0 kcal per 100 g, lowest in ‘Granny Smith’ and highest in ‘Reinette’ (Table 3). Since energy was calculated from proxi-mal composition, there was a significant linear relationship between energy and dry matter content (Energy = 19.04 + 2.45 × DM; R² = 0.909, n = 8) and between energy and SSC (Energy = 5.21 + 3.93 × SSC; R² = 0.9113; n = 8).
Conclusion
The physicochemical properties and nutritional compo-sition of the eight apple cultivars from “Maçã de Alcobaça” PGI reveal a cultivar-dependent range of nutritional value. ‘Reinette’ is the cultivar with higher SSC, titratable acidity, carbohydrates, protein, ash, energy, dry matter. On the oppo-site side of the spectrum, ‘Granny Smith’ had the lowest SSC, carbohydrate content, dry matter, and energy. ‘Casa Nova’, a local cultivar, had the highest fiber content. Overall nutri-tional composition was not related to the apple color classes.
Table 3. Proximal composition of the edible part of eight apple cultivars. Values are means ± standard deviation (n = 3).
Means within the same column followed by the same letter are not statistically different at α = 0.05.
Cultivar Moisture (%, w/w) Dry matter(%, w/w) (kcal 100 gEnergy-1) Carbohydrates(%, w/w) (%, w/w)Protein (%, w/w)Fat (%, w/w)Ash (%, w/w)Fiber ‘Casa Nova’ 83.6 ± 0.2cd 16.4 ± 0.2ab 58.9 ± 1.4b 15.7 ± 0.2ab 0.30 ± 0.00bc 0.13 ± 0.03a 0.23 ± 0.00c 2.7 ± 0.1a ‘Fuji’ 84.3 ± 0.3bc 15.1 ± 0.2bc 57.8 ± 0.9b 14.7 ± 0.3bc 0.20 ± 0.1d 0.10 ± 0.00b 0.30 ± 0.00a 1.7 ± 0.1e ‘Galaxy’ 84.7 ± 0.3bc 15.3 ± 0.3bc 56.9 ± 1.3b 14.6 ± 0.4bc 0.40 ± 0.06ab 0.10 ± 0.00b 0.24 ± 0.00c 1.8 ± 0.0e ‘Golden Delicious’ 86.6 ± 0.2ab 13.4 ± 0.2cd 52.4 ± 1.1bc 12.8 ± 0.2cd 0.33 ± 0.03bc 0.10 ± 0.00b 0.18 ± 0.01d 1.5 ± 0.0f ‘Granny Smith’ 87.7 ± 0.8a 12.3 ± 0.8d 48.9 ± 2.2c 11.5 ± 0.8d 0.47 ± 0.03a 0.10 ± 0.00b 0.20 ± 0.01d 1.9 ± 0.0d ‘Jonagored’ 82.7 ± 1.4cd 17.3 ± 1.4ab 58.7 ± 1.5b 16.7 ± 1.4ab 0.27 ± 0.03c 0.10 ± 0.00b 0.19 ± 0.02d 2.2 ± 0.1c ‘Reinette’ 81.7 ± 0.1d 18.3 ± 0.1a 66.0 ± 0.9a 17.5 ± 0.1a 0.47 ± 0.03a 0.10 ± 0.00b 0.28 ± 0.01b 2.4 ± 0.1b ‘Starking’ 84.3 ± 0.5c 15.7 ± 0.5b 56.3 ± 1.8b 15.1 ± 0.5b 0.33 ± 0.03bc 0.10 ± 0.00b 0.20 ± 0.00d 2.0 ± 0.1d Average 84.5 ± 2.0 15.5 ± 2.0 57.0 ± 5.0 14.8 ± 2.0 0.35 ± 0.10 0.1 ± 0.00 0.23 ± 0.04 2.0 ± 0.4
References
Almeida, D.P.F, Gião, M.S., Pintado, P., and Gomes, M.H. (2017). Bioactive phytochemicals in apple cultivars from the Portuguese Protected Geographical Indication “Maçã de Alcobaça”: Basis for market segmentation. Int. J. Food Prop. 1–9. https://doi.org/10.108 0/10942912.2016.1233431.
AOAC (2000). Official Methods of Analysis, 17th Edn. (Rockville, MD, USA: AOAC International).
Aprifel (2015). Agence pour la Recherche et l’Information en Fruits et Légumes. Retrieved December 15, 2015 from http://www.aprifel. com.
Baugher, T.A., Singha, S., Townsend, E.C., and Ingle, M. (1990). Growth, yield and fruit quality of ‘Delicious’ apple strains. Bulletin 702 (Morgantown, WV, USA: West Virginia University).
Biliaderis, C.G., and Izydorczyk, M.S. (2007). Functional Food Carbohydrates (Boca Raton, FL, USA: CRC Press).
Black, L.J., Ireland, J., Møller, A., Roe, M., Walton, J., Flynn, A., Finglas, P.M., and Kiely, M. (2011). Development of an on-line Irish food composition database for nutrients. J. Food Comp. Anal. 24, 1017– 1023. https://doi.org/10.1016/j.jfca.2011.01.015.
Bowen, S. (2010). Embedding local places in global spaces: Geographical Indications as a territorial development strategy. Rural Sociol. 75, 209–243. https://doi.org/10.1111/j.1549-0831.2009.00007.x.
Crassweller, R.M., and Hollender, R.A. (1989). Consumer evaluations of ‘Delicious’ apple strains. Fruit Var. J. 43, 139–142.
Escarpa, A., and González, M.C. (2001). Approach to the content of total extractable phenolic compounds from different food samples by comparison of chromatographic and spectrophotometric methods. Anal. Chem. Acta 427, 119–127. https://doi.org/10.1016/ S0003-2670(00)01188-0.
EU (2017). DOOR database. Quality policy. Agriculture and rural development. European Commission. Retrieved January 26, 2017 from http://ec.europa.eu/agriculture/quality/door/list.html. FAO (2003). Food energy – methods of analysis and conversion factors (Rome: Food and Agriculture Organization).
Feliciano, R.P., Antunes, C., Ramos, A., Serra, A.T., Figueira, M.E., Duarte, C.M.M., de Carvalho, A., and Bronze, M.R. (2010). Characterization of traditional and exotic apple varieties from Portugal. Part 1 – Nutritional, phytochemical and sensory analysis. J. Funct. Foods 2, 35–45. https://doi.org/10.1016/j.jff.2009.12.004.
Harker, F.R., Kupferman, E.M., Marin, A.B., Gunson, F.A., and Triggs, C.M. (2008). Eating quality standards for apples based on consumer preferences. Postharv. Biol. Technol. 50, 70–78. https://doi. org/10.1016/j.postharvbio.2008.03.020.
Iglesias, I., and Alegre, S. (2006). The effect of anti-hail nets on fruit production, radiation, temperature, quality and profitability of ‘Mondial Gala’ apples. J. Appl. Hortic. 8, 91–100.
Iglesias, I., Echeverría, G., and Soria, Y. (2008). Differences in fruit colour development, anthocyanin content, fruit quality and consumer acceptability of eight ‘Gala’ apple strains. Sci. Hortic. 119, 32–40. https://doi.org/10.1016/j.scienta.2008.07.004.
INE (2016). Estatísticas Agrícolas (Lisbon, Portugal: Instituto Nacional de Estatística).
Korošec, M., Golob, T., Bertoncelj, J., Stibilj, V., and Seljak, B.K. (2013). The Slovenian food composition database. Food Chem. 140, 495– 499. https://doi.org/10.1016/j.foodchem.2013.01.005.
Lancaster, J.E., and Dougall, D.K. (1992). Regulation of skin color in apples. Cri. Rev. Plant Sci. 10, 487–502. https://doi. org/10.1080/07352689209382324.
Lancaster, J.E., Grant, J.E., Lister, C.E., and Taylor, M.C. (1994). Skin color in apples – Influence of copigmentation and plastid pigments on shade and darkness of red color in five genotypes. J. Am. Soc. Hortic. Sci. 119, 63–69.
Lea, A.G.H. (1995). Cidermaking. In Fermented Beverage Production, A.G.H. Lea, and J.R. Piggott, eds. (Glasgow: Blackie and Sons), p. 66– 96. https://doi.org/10.1007/978-1-4757-5214-4_4.
Machackova, M., Holasova, M., and Maskova, E. (2013). The new on-line Czech Food Composition Database. Food Chem. 140, 533–538. https://doi.org/10.1016/j.foodchem.2013.01.095.
Marlett, J.A., and Vollendorf, N.W. (1994). Dietary fibre content and composition of different forms of fruits. Food Chem. 51, 39–44. https://doi.org/10.1016/0308-8146(94)90045-0.
Martinez-Palou, A., and Rohner-Tielen, E. (2008). Fruit and vegetables. Fresh and healthy on European tables. Eurostat, Statistics in Focus 60, 8 p.
Nour, V., Trandafir, I., and Ionica, M.E. (2010). Compositional characteristics of fruits of several apple (Malus domestica Borkh.) cultivars. Not. Bot. Horti. Agrobo. 38, 228–233.
Petkovsek, M.M., Stampar, F., and Veberic, R. (2007). Parameters of inner quality of the apple scab resistant and susceptible apple cultivars (Malus domestica Borkh.). Sci. Hortic. 114, 37–44. https:// doi.org/10.1016/j.scienta.2007.05.004.
Porro, D., Datlaserra, M., Dorigatti C., and Zatelli, A. (2002). Fitoregolatori efitormoni: risposta produttiva ed economica di Golden Delicious. Terra Trentina 6, 28–33.
Souci, S.W., Fachmann, W., and Kraut, H. (2000). Food Composition and Nutrition Tables, 6th Edition (Stuttgart, Germany: Medpharm Scientific Publishers).
Thiault, J. (1970). Etude de criteres objectifs de la qualité gustative de pommes Golden Delicious. Bull. Tech. Inf. Min. Agric. Paris 248, 191–201.
USDA (2015). USDA National Nutrient Database for Standard Reference, Release 25. National Data Laboratory. Agricultural Research Service. United States Department of Agriculture. Retrieved December 10, 2015 from http://ndb.nal.usda.gov.
Vieira, F.G.K., Borges, G.S.C., Copetti, C., Amboni, R.D.M.C., Denardi, F., and Fett, R. (2009). Physico-chemical and antioxidant properties of six apple cultivars (Malus domestica Borkh.) grown in southern Brazil. Sci. Hortic. 122, 421–425. https://doi.org/10.1016/j. scienta.2009.06.012.
Williamson, C. (2006). Synthesis Report No. 2: The Different Uses of Food Composition Databases. (Norwich, United Kingdom: EuroFIR). Wu, J., Gao, H., Zhao, L., Liao, X., Chen, F., Wang, Z., and Hu, X. (2007). Chemical compositional characterization of some apple cultivars. Food Chem. 103, 88–93. https://doi.org/10.1016/j. foodchem.2006.07.030.
Received: Feb. 2, 2017 Accepted: Jul. 21, 2017 Addresses of authors:
Domingos P.F. Almeida1,* and M. Helena Gomes2
1 Universidade de Lisboa, Instituto Superior de Agronomia,
Tapada da Ajuda, 1349-017 Lisboa, Portugal
2 CBQF, Escola Superior de Biotecnologia, Universidade
Católica Portuguesa, Rua Dr. António Bernardino Almeida, 4200-072 Porto, Portugal
* Corresponding author; E-mail: [email protected] Tel.: +351 21 365 3100; Fax: +351 21 365 3195