CHANGES IN THE VOLATILE FRACTION COMPOSITION OF PORT WINES
DURING AGING: A MECHANISTIC APPROACH
by
Ana Rita Monforte
1
2
3
4
5
6
7
8
CHANGES IN THE VOLATILE FRACTION COMPOSITION OF PORT WINES
9
DURING AGING: A MECHANISTIC APPROACH
10
11
12
Thesis presented to Escola Superior de Biotecnologia of the Universidade Católica
13
Portuguesa to fulfill the requirements of Master of Science degree in
14
Food Engineering
15
16
17
by
18
19
Ana Rita Monforte
20
21
22
23
24
Place: Escola Superior de Biotecnologia – Universidade Católica Portuguesa
25
Supervision: Doutor António César Silva Ferreira
26
27
June, 2013
28
29
30
31
32
33
34
35
36
37
38
39
40
41
42
43
44
45
46
47
48
49
50
51
52
53
54
55
56
57
58
59
60
61
Mãe espero que isto te faça sorrir
62
Espero que estejas feliz com a minha vida
63
Com todas as escolhas que fiz
64
Como mudei ao longo deste caminho
65
Porque sei que sempre acreditaste em todos os meus sonhos
66
E devo-te tudo a ti
67
68
69
70
71
!
72
"#$%&'!
73
Os produtos alimentares durante o seu tempo de vida útil sofrem modificações químicas provocadas
74
por conjuntos de reações reguladas por princípios termodinâmicos, sendo estas tradicionalmente
75
agrupadas em diversos mecanismos. No processamento alimentar destaca-se a reação de Maillard
76
que é dos mais descritos nos alimentos. O conhecimento da “mecânica” das reações e da sua
77
possível interligação é fulcral para a compreensão e consequentemente para a monitorização da
78
qualidade alimentar.
79
Neste contexto, surge a motivação deste trabalho: elucidar sobre a possível interligação entre a
80
reação de Maillard e a oxidação durante o envelhecimento do Vinho do Porto. De que forma estes
81
mecanismos são afectados por parâmetros tecnológicos, como o oxigénio e a temperatura. E por fim
82
saber de que forma podem ser controlados e assim providenciar formas de gerir o processo de
83
envelhecimento e consequentemente a qualidade do produto.
84
Foram usados vinhos envelhecidos durante 63 dias sob diferentes condições de oxigénio e
85
temperatura e vinhos de diferentes idades que foram analisados por cromatografia gasosa acoplada a
86
um detetor de ionização por chama e por espectrometria de massa. Compostos marcadores da
87
reação de Maillard, oxidação e de um possível mecanismo que resulta da junção dos 2 que dá origem
88
ao sotolon foram quantificados e calculados os respetivos parâmetros cinéticos, posteriormente
89
usados para através de simulações de Monte Carlo prever a composição de vinhos armazenados em
90
diferentes condições. Os perfis cromatográficos i.e. vetores de intensidade vs. tempos de retenção
91
foram usados como impressões digitais químicos para encontrar mais marcadores relacionados com
92
o processo. Foi criada uma nova técnica de visualização de cromatogramas que consiste na
93
construção de uma rede com conexões (correlações de Pearson) entre tempos de retenção
94
(compostos).
95
Os parâmetros cinéticos demonstraram que a formação de sotolon é dependente do oxigénio e da
96
temperatura, observando-se um efeito sinérgico entre ambos o que sustenta a hipótese da sua
97
formação estar relacionada com o mecanismos de Maillard e a oxidação. As simulações demonstram
98
que o efeito da temperatura tem maior impacto em vinhos armazenados em recipientes com elevada
99
permeabilidade ao oxigénio (barris) do que naqueles com baixa permeabilidade (garrafas com rolha
100
de cortiça).
101
O uso dos perfis cromatográficos permite classificar as amostras de diferentes idades e encontrar
102
mais marcadores relacionados com o processo. A reconstrução de redes é útil na priorização da
103
identificação dos biomarcadores assim como permite uma visualização das cinéticas destes,
104
compostos próximos têm a mesma expressão temporal e consequentemente obedecem á mesma
105
ordem cinética e verificou-se que compostos agrupados são sensíveis aos mesmos parâmetros
106
tecnológicos (oxigénio e temperatura).
107
O controlo de parâmetros tecnológicos permite modular o perfil sensorial do vinho do Porto e
108
consequentemente a sua qualidade. Este conhecimento tem elevado valor para a indústria porque
109
()$*+,-*!
111
A food product during shelf life suffers chemical changes, caused by sets of reactions regulated by
112
thermodynamics principles forming several mechanisms. In food processing, Maillard reaction is
113
probably the most described. The knowledge of the different mechanism and their possible
114
interconnections is central to understand and consequently monitor food quality.
115
It is within this context, that the motivation of this thesis arose: to provide insights about the inter-
116
connections between the Maillard reaction and oxidation during Port wine aging and how these
117
mechanisms will be affected by technological parameters such as temperature and oxygen.
118
Conclusively know how they can be controlled and thus provide ways to manage the aging process
119
and consequently the quality of the product.
120
In this context wines used were aged for 63 days under different conditions of temperature and oxygen
121
and wines of different ages were analyzed by gas chromatography coupled to a flame ionization
122
detector and to mass spectrometry. Marker compounds of Maillard reaction, oxidation and from a
123
possible mechanism that outcomes from the previous ones which leads to sotolon were quantified and
124
was calculated the respective kinetic parameters, these were used for through Monte Carlo
125
simulations predict the composition of wine stored in different conditions of oxygen and temperature.
126
The chromatographic profiles (vectors of intensity vs. retention times) were used as chemical
127
fingerprints to find out more markers related with the process. A new approach for chromatographic
128
data visualization was created consisting in a network of connections (Pearson correlations) between
129
retention times (compounds).
130
The kinetic parameters have shown that the formation of sotolon is highly dependent upon oxygen and
131
temperature. Kinetics models with Monte Carlo simulations where applied and on the basis of the
132
modeling predictions, it would seem that the temperature of a cellar would have a more significant
133
impact on the Port wines stored in containers where the oxygen intake is higher (barrels) when
134
compared to containers with low oxygen permeability (bottles with cork stoppers).
135
The use of chromatographic profiles as samples fingerprints allows classifying samples of different
136
ages and finding more markers related to the process. The network reconstruction provides
137
considerably more information in an effort to understand the probable kinetic contexts of the molecules
138
represented by peaks in each chromatogram.
139
The technology developed in the study allows the modulation of the Port sensory profiles and
140
consequently contributes to quality improvement. This knowledge has high value for the industry
141
because it allows the management of the quality and therefore the increment of the product value.
142
143
144
(-./'01#23#&#/*$!
145
146
It is difficult to overstate my gratitude to my MSc. Supervisor, Dr. António César Ferreira. With his
147
enthusiasm, his inspiration, and his great efforts to explain things clearly and simply, he helped to
148
make this work fun for me. Throughout this time, he provided encouragement, sound advice, good
149
teaching, good company, and lots of good ideas. I would have been lost without him. He was the
150
driver for my development in research.
151
152
To Symington Family Estates for the availability of supply all the Port wine samples used in the work
153
and to Corksupply, SA, Portugal for oxygen measurement support.
154
155
Life as a post graduate student is not always easy. Nevertheless, I was lucky enough to meet some
156
colleagues who inspired and helped me to overcome these difficulties. These friends are Joana Tomé,
157
Carla Oliveira, Carla Teixeira and Rosa Martins.
158
159
Last but not the least, I owe a debt of gratitude to my family members for all their encouragement.
160
161
To Pedro for sharing my dreams and for always being there.
162
163
To my father for the support in the last years.
164
165
To my grandfather, who had a great influence in the person I am today.
166
167
To a very special person, Rosa. Without her this work never have been possible. Thank you for the
168
patience and love expressed during this time and for being around when I needed it most.
169
170
And finally to the most important person in the entire world, the centre of my life, without whom nothing
171
would have been possible, my mother. Always present in my heart and with me all the time.
172
173
174
175
Contents
177
RESUMO ... III
178
ABSTRACT ... IV
179
ACKNOWLEDGEMENTS ... V
180
TABLE OF FIGURES ... VII
181
TABLE OF TABLES ... IX
182
LIST OF ABREVIATIONS ... X
183
1.INTRODUCTION ... 11
184
1.1.Wine Flavour ... 11
185
1.2. Port Wine ... 11
186
1.3. Wine Flavour Generation Mechanism ... 13
187
1.4. Chemical Kinetic ... 20
188
1.5. Metabolomics ... 21
189
2. MATERIALS AND METHODS ... 29
190
2.1. Samples ... 29
191
2.2. Analytical procedure. ... 30
192
2.3. Kinetic Modelling ... 32
193
2.4. Data pre-processing. ... 35
194
2.5. Statistical Analysis – Multivariate Analysis ... 35
195
2.6. Kinetic Network Reconstruction. ... 36
196
3. RESULTS AND DISCUSSION ... 38
197
3.1. Oxygen consumption ... 38
198
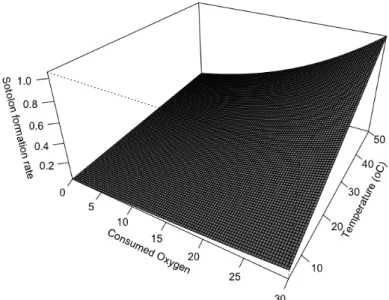
3.2. Sotolon Formation ... 39
199
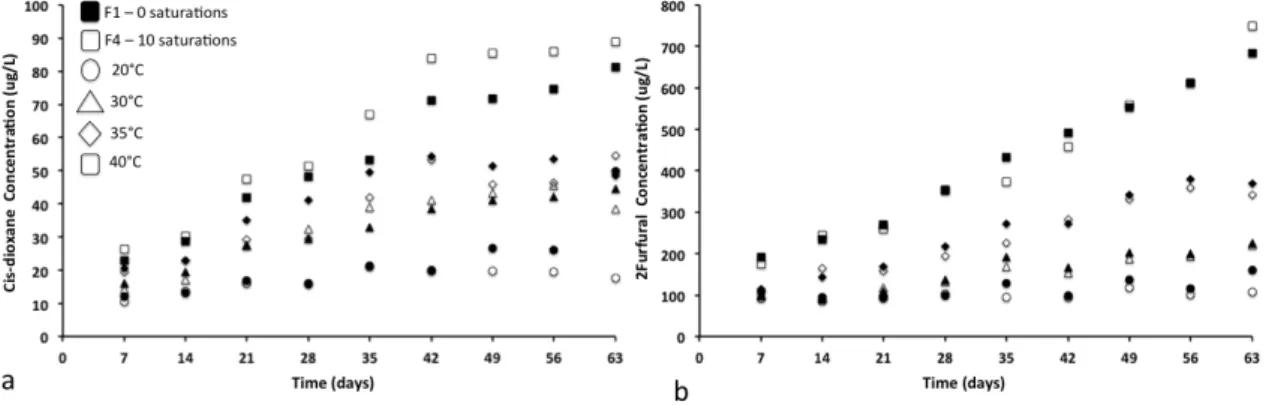
3.3. Maillard and oxidation related compounds formation ... 41
200
3.4. Monte Carlo storage simulations ... 42
201
3.6. Multivariate approach ... 48
202
3.6.1. Unsupervised Approach - Principal Component Analysis. ... 48
203
3.6.2. Supervised Approach - Partial Least Squares Analysis. ... 51
204
3.6.3. Network Reconstruction. ... 53
205
CONCLUSIONS ... 60206
FUTURE WORK ... 61207
ANNEXES ... 62208
BIBLIOGRAPHY ... 63209
210
4,)1#!'5!673%+#$!!
211
Page
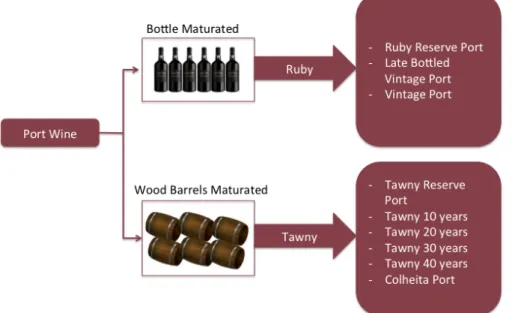
Figure 1.2.1. Port wine categories. 13
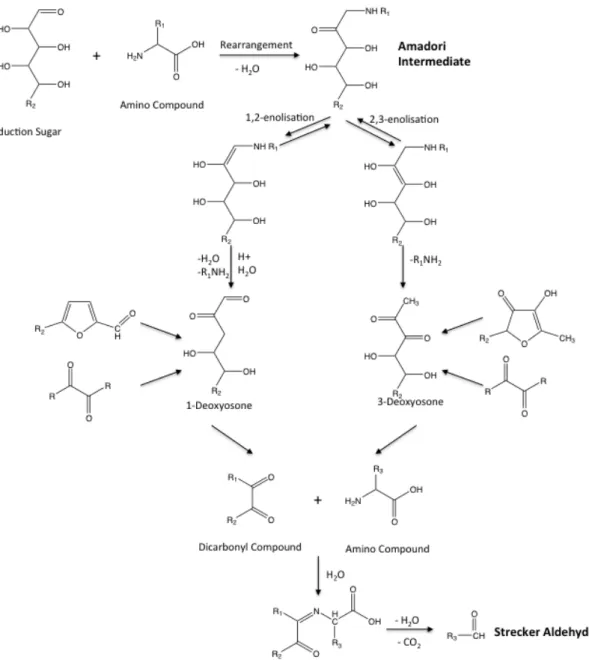
Figure 1.3.1. Maillard reaction scheme, adapted from Hodge (Hodge, 1953). 16
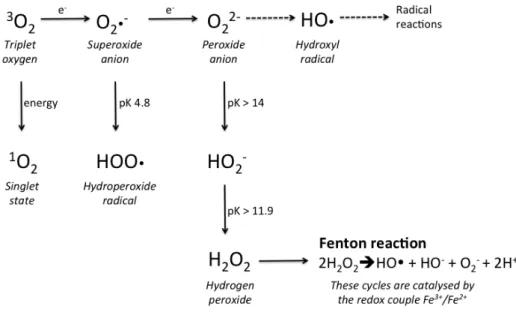
Figure 1.2.2. Oxygen reactive species. 18
Figure 2.1.1. Experimental Design. 30
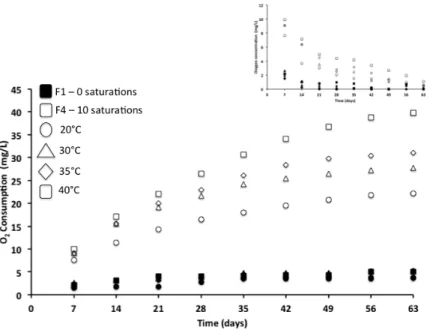
Figure 3.1.1. Oxygen consumption as a function of time at different temperatures and O2
saturations and oxygen uptake in each week.
38
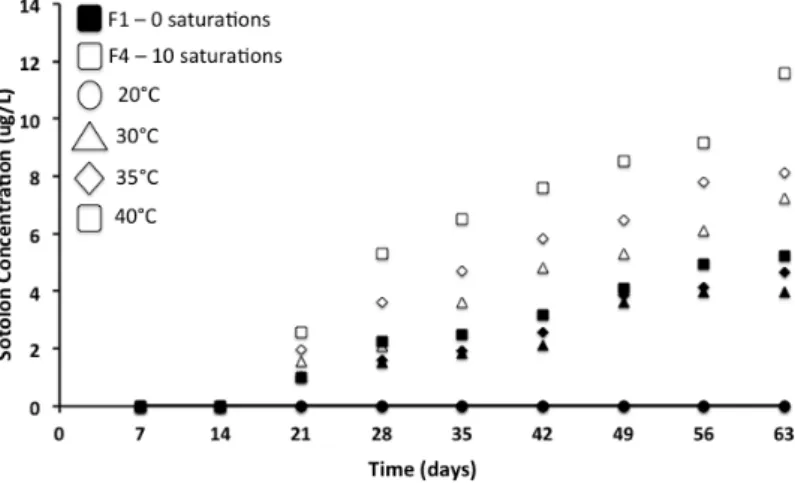
Figure 3.2.1. Port wine kinetics; Sotolon concentration as a function of time at different
temperatures and O2 saturations.
39
Figure 3.2.2. Sotolon formation rate as function of the consumed O2 and storage temperature. 40
Figure 3.3.1. Cis dioxane and furfural concentration as a function of time and different
temperatures and O2 saturations.
41
Figure 3.4.1. Port wine kinetic rate chart and expected scenario for T=15ºC, t=10 years and O2
permeability=10±2 mg/L year (barrel).
43
Figure 3.4.2. Dendogram of Monte Carlo predictions for 10 years old wines storage in bottles and
barrels at 10 and 20ºC with the normal aged wines.
44
Figure 3.6.1.1. Proposed workflow for univariate (chromatographic) signal processing. 48
Figure 3.6.1.2. Raw chromatogram overlay of all samples (n=31) and Loading plot (PC1)
representing the average chromatogram GC-FID chromatogram. (1) ethyl lactate, (2) acetic acid, (3) 2,3-butanediol, (4) diethyl succinate, (5) 2-phenylethanol, (6) diethyl malate and (7) succinic monoethyl ester.
49
Figure 3.6.1.3. PCA score plots of cleaned and COW-aligned chromatograms: (A) un-normalized
(B) normalized. Colours denote wines of age 2 to 7 years (yellow), 10 to 42 years (blue) and 48 to 60 years (pink). (C) Loading plot of PC1 with 9 of the peaks identified as (1) furfural, (2) cis dioxane, (3) benzaldehyde, (4) 5MF, (5) cis dioxolane, (6) trans dioxolane, (7) octanoic acid, (8) unknown and (9) HMF.
50
Figure 3.6.3.1. Putative Kinetic Network. Nodes are coloured in shades of red based on the fold
change from 2 to 60 years. Node sizes are scaled by the number of other nodes (peaks) that are correlated to them above a Pearson threshold of 0.8. Edge thickness is scale by the degree of correlation between its two nodes. (Dioxanes in the network are labelled as follows: cis dioxane: Diox 1; cis dioxolane: Diox 2; trans dioxolane: Diox 3 and, trans dioxane: Diox 4).
53
Figure 3.6.3.2. Subnetworks correlating to A) Age, B) Sotolon, C) HMF and D) Acetaldehyde.
Nodes (compounds) with strong Pearson correlations to these target vectors are colour with aqua.
55
Figure 3.6.3.3. GC-MS Putative Kinetic Network 56
Figure 3.6.3.4. Putative Kinetic Network. Branch A. 56
Figure 3.6.3.5. Putative Kinetic Network. Branch B. 57
Figure 3.6.3.6. Putative Kinetic Network. Branched C. 59
212
4,)1#!'5!4,)1#$!
214
Page
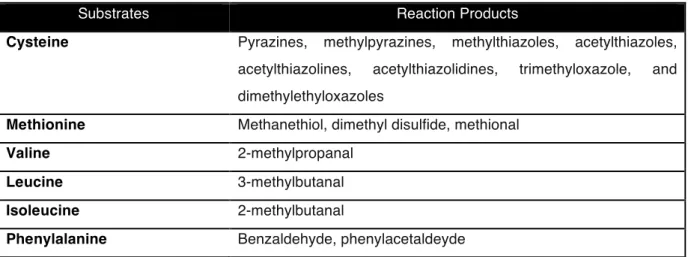
Table 1.3.1. Identified reaction products and principal odours detected in synthetic amino
acid solutions in the presence of α-dicarbonyls compounds, (Pipris-Nicolau et al., 2000).
17
Table 1.5.1. Recent methods for the characterization of wines. 24
Table 3.3.1. Isothermal kinetic rates for sotolon, furfural, 5MF, HMF, Cis dioxane and Trans
dioxane.
42
Table 3.3.2. Global optimization models for isothermal for: furfural, 5MF, HMF, Cis dioxane
and Trans dioxane.
42
Table 3.4.1. Monte Carlo simulation results for isothermal storage of Port wine inside barrels. 46
Table 3.4.2. Monte Carlo simulation results for isothermal storage of Port wine inside bottles. 47
215
216
87$*!'5!()+#97,*7'/$!
217
218
MVA Multivariate Analysis
PCA Principal Component Analysis
PLS Partial Least Squares
PLS-R Partial Least Squares Regression
PC1 First Principal Component
PC2 Second Principal Component
HCA Hierarquical Cluster Analysis
GC Gas Chromatography
FID Flame ionization detection
MS Mass spectrometry
SPME Solid Phase Microextraction
LLE Liquid-Liquid Extraction
t Time
T Temperature
k Rate constant
Ea Activation energy
C0 Compound initial concentration
MC Monte Carlo
COW Correlation Optimized Warping
HMF 5-hydroxymethylfurfural
:;</*+'2%-*7'/!
219
:;:;=7/#!61,9'%+!
220
The olfactory area in humans is about 2,5 cm2 wide and contains a number of about 50 million
221
receptor cells with 8-20 cilia down in a layer of mucus of about 60 microns thick. Only volatile
222
substances, soluble in mucus, can reach the receptors and interact with them and finally produce
223
sensation (Sarafoleanu et al., 2009).
224
Humans have only 350 functional genes for olfactory receptors comparing with other mammals, which
225
have 1100 active genes. These genes are structured in clusters of 10 and are located in different
226
chromosomes. Nevertheless, this reduced number of genes for olfactory receptors is balanced by the
227
amazing capacity of human brain processing. The olfactory nerve transmits olfactory impulses from
228
the olfactory epithelium of the nose to the brain (Monkhouse, 2006). Language and speech plays an
229
important role in the perception and discrimination of the odours. The human being able to learn to like
230
certain things because of how they smell. In food industry, flavours have a great importance. “The
231
nose smells what the eyes see” because sometimes a simple chemical ingredient added can make a
232
type of food to look like another.
233
A huge example is the wine tasters, they analyse orthonasal and retronasal perception, associates
234
them with other flavours from his memory, and are capable to identify constituents separately. The
235
flavour of wine is a sensory perception that diverges with the individual, the context of the consumer
236
experience and the chemical composition of the product. The final reaction is the consequence of
237
complex chemosensory relations that are difficult to predict because of the influences of many
238
variables (Fleet, 2003).
239
Aroma is an important factor in quality control of all foods but in wines this factor is probably the most
240
important. The chemical compounds responsible for the aroma are more than 800 and are present in
241
different ranges of concentrations, and with different volatilities and polarities (Arrehnius et al., 1996).
242
This large number of compounds contributes to sensorial wine complexity. During wine production,
243
from grape to ageing, complex reactions occur; this allows differentiating proper characteristics of
244
wine.
245
246
:;>;!?'+*!=7/#!
247
Port wine is a fortified wine, produced in a specific area in North Portugal called Douro Region.
248
According to Decreto-Lei nº 104/85 de 10 de Abril there are 48 grape varieties permitted in the
249
production of Port wine divided into two categories: recommended and authorized. This simple fact
250
goes a long away to explaining the great variation in quality and character of Ports within the same
251
Viticultura Duriense”), five types of varieties were selected (“top five”), which are now recommended
253
for future plantings: Touriga Nacional, Tinto Cão, Tinta Roriz, Tinta Barroca and Touriga Francesa.
254
The harvest of the grapes in Douro starts at the end of September and for the most part is still
255
carried out manually. Grapes usually arrive at the winery in baskets holding or in special steel
256
containers. After the vinification process the grapes are weighted, tested for potential alcohol
257
(according to sugar content) and visually inspected. Once accepted grapes start to be process. The
258
production of a good quality port depends on the complete and fast extraction of both the color and the
259
flavor from the tannins of the berry skins. These must be extracted before adding fortifying spirit after
260
two or three days stopping must fermentation.
261
The most traditional way to produce must is the use of the lagar, a low granite trough, in which grapes
262
are trodden and fermented. Lagares are progressively filled during the day and in the evening pickers
263
arrive to tread them. About 24-36 hours later, yeasts activate the fermentation of the sugars contained
264
in the grapes. Alcohol and gas have the effect of pumping the skins and the solid material to the
265
surface, encouraging the extraction of phenolics and creating a cap on the must.
266
Port wines derive its sweetness from unfermented sugars, when the respective concentration of the
267
fermenting juice has dropped to about 90 grams per litter of sugar, the alcoholic strength will normally
268
be between 6 and 8%, depending on the richness of the juice, which in turn is related upon the grape
269
variety and vintage. The vinification is stopped by adding grape-distilled spirit of 77% alcohol adding
270
alcoholic strength ending with a final alcohol content of about 19-21% (v/v).
271
According to sugar content Port wines can be classified in extra dry (<40 g/L), dry (40-65 g/L), semi
272
dry (65-90 g/L), sweet (90-130 g/L) and very sweet (>130 g/L). After the vinification process wines are
273
blended and maturated in oak casks.
274
The diversity of different styles offered by Port wines makes up for is uniqueness among other fortified
275
wines, contributing for is brand recognition around the world. Its different styles derive essentially from
276
the various ways in which it can be aged. Its remarkable ageing potential and the fact that it is fortified
277
mean that Port will continue to improve in cask or bottle for much longer than most wines. The choice
278
of ageing period and ageing vessel will determine what the Port tastes like. A Port wine aged in wood
279
in contact with air will evolve more quickly than which ages in bottle. Ports can be broken down into
280
two groups: wood aged which aged in cask, normally made of oak, and bottle aged Ports which, as the
281
name indicates, spend most of their lives maturating in bottle. Within the wood aged Port family there
282
are Tawny Reserve Port, Tawny 10, 20, 30 or 40 years old Port and Colheita Port. The bottle-aged
283
family of Ports is made up mainly of Ruby Reserve Port, Late Bottled Vintage Port (LBV), Vintage Port
284
286
Figure 1.2.1. Port wine categories
287
288
Aging potential is the ability of a wine to improve with age. People have the perception that older wines
289
are better (Verdú Jover et al., 2004) leading to a common portuguese popular expression “the older
290
the better”. Age is therefore a quality signal for consumers, although most wines are not made to age
291
nowadays.
292
The aging of fortified wines is based on the development of color, the extraction of small amounts of
293
oak components, and the evaporative loss of volatile spirit components.
294
295
:;@;!=7/#!61,9'%+!A#/#+,*7'/!B#-C,/7$&!
296
Wine aroma complexity, is due to the diversity of the mechanisms involved in their development
297
i.e., grape metabolism, fermentation process, and wine ageing. The grape metabolism depends not
298
only of the grape variety but also on the soil type, on the climate conditions and on the vineyard
299
management techniques. A part of the varietal aroma impression is related to the amino acid profile of
300
the variety (Hernández-Orte et al., 2002) and the most significant part is related to specific odourless
301
precursors (Williams Patrick et al., 1989). These precursors can be glycosides, polyhydroxylated
302
molecules (Williams et al., 1980) or cysteine-derivatives (Tominaga et al., 1998).
303
Biochemical or enzymatic phenomena occurs mainly prior to fermentation during the extraction of
304
the juice and maceration while, chemical reactions occur mainly after fermentation, and during ageing
305
of the wine (barrel and bottle).
306
Wines are consumed after a period of aging that may take place in wooden casks, in the bottle, or in
307
both successively. For many wines, this period of aging is a necessary stage in the production
308
process. The effect of aging is to modify the various organoleptic properties of the wine, making some
309
more and others less intense (Singleton Vernon and Cilliers Johannes, 1995). This process implies a
310
commercial interest to characterize the chemical reactions that take place during the processes of
312
aging.
313
Wine aging is easily seen to be not an entity but a set of changes, several reactions act as a whole
314
complex and connected system implicating several mechanisms. The systems thermodynamics of
315
these reactions will regulate the shelf life of the product traditionally slow and for flavour to be modified
316
relatively few molecules of key compounds need to be changed. Formation/degradation of varietal
317
compounds, oxidation, reduction, esterification/hydrolysis are mechanism that occur during wine
318
maturation.
319
Rather extensive oxidative and associated changes, including browning, are desirable in Ports,
320
moreover in white wines any evidence of these characteristics made the wines unattractive (Silva
321
Ferreira et al., 2003).
322
Some of the reactions/events are largely acknowledged like Maillard reaction and oxidation. Some of
323
these mechanisms are more significant during age, and some molecules are more related with aging
324
then others, in this study we focused on them. Some furanic compounds and Strecker aldehydes from
325
Maillard reaction, from oxidation some aldehydes and acetals, and an important molecule responsible
326
for the aged character of Ports the sotolon. However we will also refer other compounds that undergo
327
an evolution with age but not with so much detail, like esters, alcohols and lactones.
328
Generally, aging of wines leads to a loss of the characteristic aromas linked to the grape varietal
329
and fermentation, and to the formation of new aromas characteristic of older wines or atypical aromas
330
associated with wine deterioration (Lambropoulos and Roussis, 2007). During aging most
331
monoterpenes decrease in concentrations over time due to acid-catalyzed reactions, however, some
332
increase in concentration may contribute to the aging bouquet of wine. The concentration of
333
norisoprenoides have also been show to increase in aged wines, including β-damascenone and 1,1,6-
334
trimethyl-1,2-dihydronaphtalene (TDN). TDN is formed during wine aging and causes distinctive
335
“kerosene” and “petrol-like” aromas in aged wines (Humpf et al., 1991).
336
The major fermentation aroma constituents are ethanol, higher alcohols, and esters. Alcohols are
337
produced by yeast and bacteria during fermentation. Ethanol is the main product of grape sugar
338
conversion by yeasts and is capable of suppressing “fruitiness” in wines, by masking the perceptions
339
of esters (Escudero et al., 2007) and probably not through a change in volatility (Guth and Sies, 2001).
340
Glycerol is also produced by yeasts and, although odourless, also has a slightly “sweet” taste (Noble
341
and Bursick, 1984). Higher alcohols or fusel alcohols are produced by yeast, and probably contribute
342
with “fruit” characteristics at optimal levels. Excessive concentrations of higher alcohols results in a
343
strong “pungent smell and taste (Nyjânen, 1986). During aging higher alcohols are relatively stable in
344
wine (Marais, 1978) (Blake et al., 2009).
345
Free or saturated volatile fatty acids generally contribute with negative characteristics to wine, but
346
are rarely above their aroma thresholds. Acetic acid makes up about 90% of the volatile fatty acids
347
produced by yeasts and bacteria. During aging volatile fatty acid stability is not uniform, with some
348
al., 2009). This may be in part due to the chemical hydrolysis of some fatty acid ethyl esters, which
350
can result in the formation of acid compounds.
351
Esters represent the largest and most important compounds produced during fermentation. They are
352
present in all wines and are considered to significantly influence wine aroma and quality by
353
contributing with “fruity” characteristics of wine (Étievant, 1991). The two types of esters produced are
354
acetate esters and fatty acid ethyl esters. There are also a number of organic acid ethyl esters in wine
355
that increase during aging. Ester formation can occur either by chemical reactions, which are slow and
356
contribute little to wines, or, much more importantly, via microbial intracellular enzymatic reactions
357
during fermentation (Mason and Dufour, 2000).
358
Acetate esters decrease in concentrations during wine aging through chemical hydrolysis. This leads
359
to a loss of “fruity” flavours in aged wines (Marais, 1978). The stability of fatty acid ethyl esters differs
360
depending on the structure of the fatty acid carbon chain. Straight-chain fatty acid ethyl esters
361
decrease in concentration over time, whereas, branched-chain fatty acid ethyl esters are stable and
362
their concentration can increase during wine aging (Díaz-Maroto et al., 2005).
363
Storage of wine in oak barrels also results in modified aroma profiles, mostly due to the extraction
364
of aroma compounds from the wood into the wine. Cis- and trans-oak lactones are the most important
365
oak-derived aroma compounds. They impart aromas of “vanilla” and “coconut-like” aromas to wine
366
(Jarauta et al., 2005). Other aldehydes extracted from oak include furfural and 4-methylfurfural, which
367
have aromas of “sweet”, “butterscotch” and “woody” (Campo et al., 2008). 2-Furanmethanethiol has an
368
aroma reminiscent of “roasted coffe” (Blanchard et al., 2001). Guaiacol and 4-methylguaiacol impart
369
“smoky” aromas to wine, and are indicative of the level of toasting or charring of oak barrels (Jarauta,
370
et al., 2005).
371
Aroma changes at room temperature caused by non-enzymatic reactions are observed only after
372
prolonged storage. The Maillard reaction and the related Strecker degradation of aminoacids all play a
373
part. The large number of volatile compounds formed by the degradation of only one or two
374
constituents is characteristic of a non-enzymatic reaction. This reaction provides volatile carbonyl
375
compounds.
376
The Maillard reaction is a reaction between a reducing sugar and an amino acid, has been named
377
after the French chemist Louis Maillard (1912) who first described it, but only in 1953 Hodge does the
378
first scheme (Hodge, 1953) (Figure 1.3.1.).
379
All reaction can be divided into the Amadori / Heyns and Strecker degradation. Nucleophilic
380
compounds like aminoacids or amines easily add to the carbonyl function of reducing carbohydrates
381
with the formation of imines (Schiff bases), this can rearrange via the 1,2-eneaminols corresponding to
382
the 1,2-enediol. This rearrangement leads to an aminoketose called an Amadori compound. Amadori
383
385
Figure 1.3.1. Maillard reaction squeme, adapted from Hodge (1953).
386
387
Unlike the acidic and alkaline sugar degradation reactions, the Amadori compounds are degraded via
388
1,2enolisation via 3-deoxy-1,2-deulose or 2,2enolisation via 1-deoxy-2,3-dicarbonyls. The best-known
389
compounds of 3-deoxyosone degradation are HMF and furfural. Besides the Maillard reaction they can
390
be originated from the dehydration of sugars in acidic medium and caramelization (Antonelli et al.,
391
2004) and can be present in higher concentration in wines aged in oak barrels, because they are
392
formed during toasting of oak and can be released during wine aging. These compounds are also
393
reported in different types of wines namely in fortified wines (Cutzach et al., 1999) (Ho et al., 1999).
394
The HMF can react with acetic acid and originate 5-(acetoxymethyl) furfural and with ethanol to form
395
5-(ethoxymethyl) furfural.
396
The second step of reaction, Strecker degradation is the most important in relation to flavour
397
formation; in this step the α-dicarbonyls compounds, like the deoxyosones react with the aminoacids.
398
oxidative decarboxylation of the α-aminoacids. The aldehydes, which have one C-atom less than the
400
amino acids, possess a considerable aroma potential, depending on the amino acid degraded.
401
Most of the odour products from the Maillard reaction are sulphur-, oxygen-, and nitrogen-containing
402
heterocycles. In wine are many studies related to maillard aroma, Pipris-Nicolau, et al. (2000) studied
403
the reaction between four α-dicarbonyls compounds (diacetyl, pentan-2,3-dione, glyoxal and
404
methylglyoxal) and aminoacids present in wines the principal odours detected dependent of the
405
aminoacid are present in Table 1.3.1..
406
407
Table 1.3.1. Identified reaction products and principal odours detected in synthetic amino acid solutions in the presence of α-
408
dicarbonyl compounds, (Pipris-Nicolau, et al., 2000).
409
Substrates Reaction Products
Cysteine Pyrazines, methylpyrazines, methylthiazoles, acetylthiazoles, acetylthiazolines, acetylthiazolidines, trimethyloxazole, and dimethylethyloxazoles
Methionine Methanethiol, dimethyl disulfide, methional
Valine 2-methylpropanal
Leucine 3-methylbutanal
Isoleucine 2-methylbutanal
Phenylalanine Benzaldehyde, phenylacetaldeyde
410
Methional and phenylacetaldeyde are related to the typical aroma of oxidative, spoiled white wine
411
(Silva Ferreira et al., 2002). Besides the Maillard reaction these two compounds can be formed from
412
the direct oxidation of the respective alcohol (Marchand et al., 2000) or by the reaction of an o-quinone
413
with the aminoacid (Rizzi, 2006).
414
This leads to another mechanism the chemical oxidation. Oxygen contained in the air can be
415
dissolved into the wine during different manipulations; in general, any rapid oxygenation (during wine-
416
making) will generate a deviation, while slow oxygenation (aging) will allow the wine to develop in
417
complexity (Kilmartin, 2009).
418
The principal compounds responsible for oxygen consumption are polyphenols, therefore explaining
419
the different oxidation capacities between white and red wine. These compounds are usually divided
420
into flavonoids and non-flavonoid compounds. The flavonoids have a more-or-less intense yellow
421
pigments and it structure are characterized by two benzene cycles bonded by an oxygenated
422
heterocycle derived either from the 2-phenyl chromone nucleous (flavones and flavonols) or the 2-
423
phenyl chromanone nucleus (flavanones and flavanols). The most common wine flavonoid compounds
424
are flavonols, flavan-3-ols and anthocyanins. The non-flavonoid compounds are mainly derivatives of
425
benzoic acid and of cinnamic acid. Polyphenols containing a 1,2-diphenol (an o-catechol moiety) or a
426
Chemical oxidation is similar to enzymatic, except that a metal ion is required in place of the enzyme
428
(Danilewicz, 2003). The direct interaction between molecular oxygen and organic molecules is “spin
429
forbidden” due to the arrangement of electrons in the oxygen molecule. Conversion of molecular
430
oxygen from its lowest energy state to a higher energy state is required before a reaction can occur.
431
As an o-dihydroxyphenol reacts with O2 to produce its quinone, only one atom of oxygen is needed
432
and the second appears as hydrogen peroxide (Singleton Vernon and Cilliers Johannes, 1995). Under
433
acidic conditions, this hydrogen peroxide oxidizes additional substances, including ethanol, which
434
would otherwise not readily autooxidise.
435
436
Figure 1.3.2. Oxygen reactive species.
437
438
Due to the poor direct reactivity of oxygen with organic molecules, the oxidising potential of molecular
439
oxygen is harnessed by the generation of reactive oxygen species (ROS) that constitute a reductive
440
ladder of oxidation (Figure 1.3.2.). The initial transfer of an electron leads to the formation of
441
superoxide ion, O2!-, which at wine pH exists as the hydroperoxide radical (OOH!). This step requires
442
a catalyst, presumably a transition state metal such as iron (Waterhouse and Laurie, 2006). The
443
transfer of a second electron would then produce a peroxide (H2O2) being the specific form generated
444
in wine. The next reduction creates an oxidative agent even more reactive than the previous one,
445
namely the hydroxyl radical (OH!), via the Fenton reaction between hydrogen peroxide and ferrous
446
iron salts. The last reaction produces water, the final product of oxygen reduction (Danilewicz, 2003).
447
The aldehydes produced by coupled polyphenol oxidation are very important in wine aging. They
448
provide links between various flavonoid polyphenols to produce polymeric pigments that explain the
449
change in red wine hue with age (Alcalde-Eon et al., 2006).
450
Many compounds are formed during this process (du Toit et al., 2006) (Escudero et al., 2002)
451
(Silva Ferreira, et al., 2003). Aldehydes and mostly acetaldehyde, resulting essentially from ethanol
452
oxidation, are important intermediates in the chemical transformations occurring in red wine, leading to
453
colour and flavour changes. When an aldehyde reacts with an alcohol an acetal is formed. Two groups
454
aldehyde and a polyol. This second reaction leads to the formation of cyclic acetals like 1,3-dioxane
456
and 1,3-dioxolane. The most important acetal found in wine is diethoxyethane, this compound results
457
from a reaction between ethanal and ethyl alcohol.
458
Acetaldehyde can also react with glycerol under acid conditions leads to the formation of four isomers:
459
cis- and trans-5-hydroxy-2-methyl-1,3-dioxane and cis- and trans-4-hydroxymethyl-2-methyl-1,3-
460
dioxolane (Silva Ferreira et al., 2002). These four compounds increase during aging.
461
Other molecules were found related to oxidation: 3-(methylthio) propionaldehyde and 1,1,6-trimethyl-
462
1,2-dihydronaphthalene (TDN). However the wine oxidation can lead to the removal of existing aroma
463
compounds, particularly those containing sulphur, they can react with quinones by a Michael-type
464
addition reaction, resulting in the loss of wine varietal character (Nikolantonaki et al., 2012).
465
Sotolon (3-hydroxy-4,5-dimethyl-2(5H)-furanone) is a volatile compound with an intense odour of
466
curry. It was identified for the first time in 1967 by Sulser et al. (1967) in vegetable protein hydrolisates
467
with an aroma reminiscent of walnuts.
468
Until today this compound were identified in many types of wines. Jura wines (Dubois et al., 1976),
469
Botrytized wines (Masuda et al., 1984), Port wines (Silva Ferreira et al., 2003), Madeira wines
470
(Câmara et al., 2004) and in dry white wines (Lavigne et al., 2008).
471
In Port wines sotolon was recognized as the key molecule in the “perceived age” of barrel storage Port
472
wine and consequently in the aroma quality of the product, it concentration can rise from a few dozen
473
μg/L in a young wine to 1 mg/L in wines older than 50 years. The odour threshold value was estimated
474
at 19 μg/L (Ferreira et al., 2005).
475
The formation mechanism of this compound is not totally fully understood. Maillard reaction was testes
476
to be a potential “via” of formation, were tested binary mixtures of cysteine, and three sugars, ribose
477
(Hofmann and Schieberle, 1995), glucose and rhamnose (Hofmann and Schieberle, 1997). According
478
to Hoffman and Schieberle (1995) heating an aqueous solution (145ºC, 20 min pH, 5.0) containing
479
hydroxyacetaldehyde and butane-2,3-dione (diacetyl) generated a significant amount of sotolon.
480
Dubois et al. (1976) detected sotolon after heating (100ºC, 24h) a dilute solution (HCL, 6N) containing
481
pyruvic acid and 2-ketobutyric acid. Silva Ferreira et al. (2003) observed too a higher correlation
482
between age and sotolon concentration with 5-methylfurfural. Câmara et al. (2004) related in Madeira
483
wine a higher correlation of other furanic derivatives, HMF and furfural with sotolon concentration. This
484
suggests a connection between sotolon and Maillard reaction.
485
On other hand vary authors connect the sotolon formation with oxidation (Silva Ferreira, et al., 2003),
486
(Escudero et al., 2011) (Cutzach, et al., 1999), (Silva Ferreira, et al., 2003), (Pham et al., 1995).
487
Cutzach suggest that sotolon can be produced by an aldol condensation between glutamic and
488
pyruvic acid in fortified wines (Cutzach, et al., 1999). Pisarnitzky, et al. (1987) relates that higher levels
489
of sotolon on sherry and Madeira wines are from a strict oxidative mechanism, based on the
490
peroxidation of acetaldehyde. Konig, et al. (1999) reported that sotolon are formed by the oxidative
491
degradation of ascorbic acid in an acidic medium containing ethanol.
492
Takahashi, et al. (1976) and Cutzach, et al. (1998) studied the role of the aldol condensation reaction
493
solution (high ethanol and reducing sugar levels) during oxidative ageing. However Silva Ferreira, et
495
al. (2003) observed that sotolon and ketobutyric acid donʼt have any correlation contrary to what is
496
observed to acetaldehyde in Port wine. In a forced ageing protocol in white wine when samples were
497
supplemented with oxygen and high temperature to simulate typical oxidation spoiled aroma, sotolon
498
is one of the compounds with highest rate (Silva Ferreira et al., 2003).
499
Both parameters, oxygen and temperature seems to influence the sotolon concentration, which
500
suggest that this molecule is an hybrid compound, this means that can have origin in a connection
501
between oxidation and maillard reaction.
502
An example of a similar compound is methional; it can be originate by oxidation of methionol or by
503
Strecker degradation of methionine. It was observed that the main pathway for the methional formation
504
was via Strecker degradation (Silva Ferreira, Guedes de Pinho, Rodrigues, & Hogg, 2002).
505
506
:;D;!EC#&7-,1!F7/#*7-!
507
Quality is a very elusive concept, which depends on many factors. The production management
508
view is to maintain quality during production. In a food technologist perspective, quality is the result of
509
the ability to control chemical, physical and microbiological changes during processing and storage.
510
For this kinetic modeling is gaining increasing interest in different fields of research (Martins et al.,
511
2000).
512
Multiple reactions taking place during food storage. Some of them are able to produce the compounds
513
for flavor, texture, and nutritional value, others result in spoilage or undesirable, harmful substances.
514
Chemical reactions occur when sufficient energy is brought to the molecules of one or several
515
compounds in proximity of each other, producing collisions that result in breakage or formation of
516
bonds among the atoms in those molecules.
517
Complex reaction networks are commonly encountered in the chemical process industry. These
518
complex reaction networks are efficiently analysed using kinetic modelling for better understanding of
519
the reaction mechanism.
520
Kinetic parameters estimation is integral to the analysis of complex reaction networks. It is thus not
521
surprising that kinetic parameter estimation is important in the design, optimization and control of
522
chemical processes. Chemical kinetic studies implies that changes occur in foods can be captured in
523
mathematical models containing characteristic kinetic parameters, such as activation energy and rate
524
constants.
525
Chemical reaction kinetics deals with the rates of chemical processes. The huge variety of chemical
526
species, types of reactions, and the accompanying potential energy involved means that the timescale
527
over which chemical reactions occur covers many orders of magnitude, from very slow reaction to
528
extremely fast reactions.
529
A large portion of the field of chemical kinetics can be described by the Arrhenius equation.
530
The Arrhenius equation relates the rate constant k, a measure of the extension of the reaction at
531
that temperature of an elementary reaction to the absolute temperature T; R is the gas constant. The
532
parameter Ea is the activation energy, which constitutes a measure of sensitivity towards temperature,
533
with dimensions of energy per mole, and A is the pre exponential factor, which has the units of k. If k is
534
a first-order rate constant, A has the unit second-1, so it is called the frequency factor.
535
The description implies that A and Ea are temperature independent, an implication that is difficult to
536
test because of small temperature range usually employed in such studies (Connors, 1990).
537
The process of estimating ambient stability involves estimating the reaction rate at different
538
temperatures, and then extrapolating to the desired temperature (Waterman and Adami, 2005).
539
However chemical mechanisms usually are cascades of consecutive and parallel reaction steps,
540
which involve many reaction products and intermediates. Multi-response has proved to be a powerful
541
tool in unravelling complex chemical reactions. The multi-response modelling techniques allow us to
542
study a entire mechanism as a whole which allow a more detailed and more informative about the
543
reaction mechanism analysis, since the reactants degradation is analysed simultaneously with the
544
intermediates and end products formation.
545
546
:;G;!B#*,)'1'&7-$!
547
Presently in science the world of “omics” are very important and refers to a discipline of science
548
and engineering for analysing the interactions of biological information in various fields. Thus the
549
different “omic” technologies are inter-related in that: transcriptomics (gene expression) assesses
550
changes in the transcriptome (the entire complement of RNA produced by DNA transcription of a cell,
551
tissue or organism at a particular time point), proteomics studies the total protein complement (the
552
proteome) and metabolomics studies the complement of small molecules.
553
Metabolomics is defined as the study of “as-many-small-metabolites-as-possible” in a system
554
(Cevallos-Cevallos et al., 2009). The main objective of this study field is collect as many information as
555
possible in objects, and find interactions between them, after this engineering the networks and the
556
objects to understand and manipulate the regulatory mechanism. Metabolomic studies can be divided
557
into two groups: target and no target analysis. Target analysis refers to analytical projects wherein the
558
goal is to quantify a relatively small number of specific analytes of interest, so the user can ignore the
559
remaining components of complex samples. Non-target techniques aim to comprehensively analyse
560
entire complex chromatograms to discover important analytes or chemical fingerprints while requiring
561
few user inputs and minimizing the need for prior information about the samples.
562
In agricultural and food products, typical quality parameters are sensory properties, shelf life, safety,
563
health, nutritional value, and crop yield per area and disease resistance. It is known that these
564
parameters are importantly determined by the metabolites in the crops and food products.
565
Metabolomics in a food quality/authenticity perspective allows an identification of several food
566
constituents to asses both food adulteration and food quality. Can be useful in the detection of
567
exploited to distinguish between food products with desirable characteristics that cannot otherwise be
569
detected by flavour, aroma or colour. Food quality also impacts food quality control. In fact,
570
metabolomic techniques may find their greatest use in the food industry in monitoring quality control.
571
In the case of wines, meticulous controls are required to assess factors (e.g. geographical origins,
572
grape varieties, vintages and oenological practices) as a way of evaluating quality and detecting
573
fraudulent adulterations (Arvanitoyannis et al., 1999). The parameters influencing quality cannot be
574
described in a simple manner from given individual compounds of the sample but they result from
575
complex combinations of hundreds of compounds. Metabolomics are used as an important tool to
576
study complex systems and a huge number of data. Table 1.5.1. shows some metabolomic studies in
577
wine published in the last three years.
578
Separation and detection of the metabolites have been considered the key steps in metabolite profiling
579
for characterization studies. Separation techniques such as liquid chromatography (LC), in its high
580
performance (HPLC) or ultra performance (UPLC) forms, gas chromatography (GC), capillary
581
electrophoresis (CE) are coupled to detection techniques such as mass spectrometry (MS), nuclear
582
magnetic resonance (NMR) and others (Table 1.5.1.) are used. An emerging trend in wine analysis
583
relies on MS for describing complex aroma properties associated with volatile components, which
584
comprise hundreds of substances.
585
However important analyte information and chemical variations in chromatographic data are often
586
obscured by irrelevant variations from, for example, noise and background interferences.
587
Preprocessing of the raw data reduces chemically irrelevant variations with the goal of improving
588
accuracy and precision of qualitative and quantitative analyses. Data should be aligned before
589
comparison to correct instrumental deviations on retention/migration times. Pre-processing tecniques
590
such as alignment has been show to drastically improve the performance of multivariate analysis
591
techniques (MVA) (Son et al., 2008).
592
Chemometrics provides a useful tool for the characterisation of wine, evaluating several
593
parameters. In contrast to the use of single-element concentrations, multivariate statistical methods
594
allow verifying the contribution of each variable to the model, and its capacity to discriminate one
595
category from another.
596
Data has a huge number of variables and PCA and PLS are MVA visualization techniques that allow
597
for the interpretation of multidimensional data sets. When multivariate analysis involves large datasets,
598
variable selection processes play an important role because they eliminate the less significant or non-
599
informative variables. The overall aim of any variable selection technique is to capture variables from
600
the original dataset that are most specifically related to the problem of interest and to exclude those
601
variables that are affected by other sources of variation.
602
PCA is a non-supervised technique that decomposes the original variables of a data set into two
603
matrices: the score and the loading matrices. The scores matrix contains information about the
604
samples, which are described in terms of their projection onto the principal components. The loading
605
onto the principal components. The loadings can also be interpreted as the contribution of the
607
variables for the observed scores distribution.
608
PLS is a supervised technique that allows sample discrimination by reduction of dimensionality
609
while maximizing correlation between variables (Wold et al., 2001).
610
Characterization of wines based on analytical methods combined with chemometric treatment of data
611
provides excellent robustness and efficiency. Physico-chemical parameters, concentrations of wine
612
components and instrumental signals can be used as multivariate data. Because of the multi
613
parametric nature of wines, chemometrics makes interpretation of data more feasible in samples
614
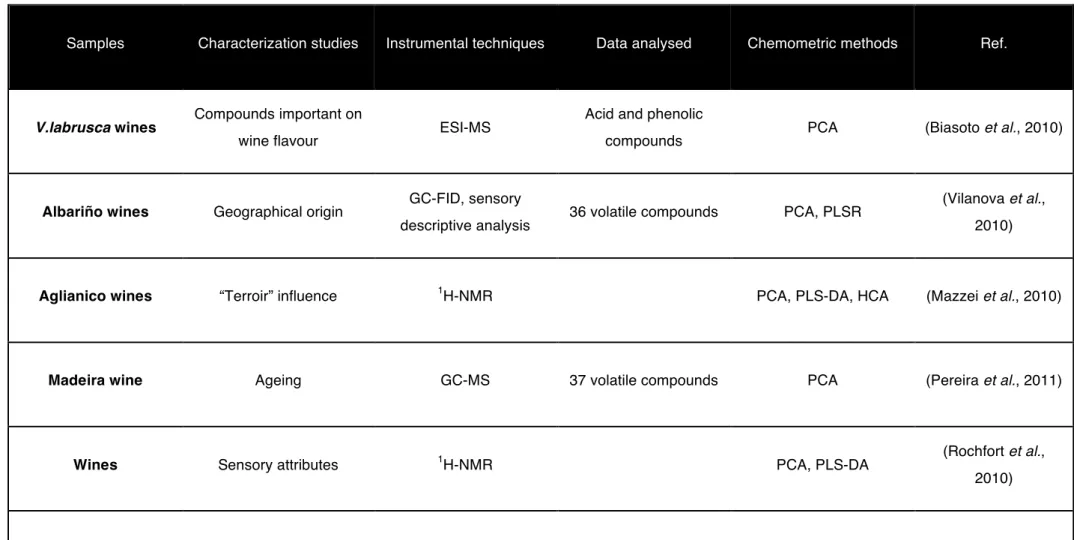
Table 1.5.1. Recent methods for the characterization of wines.
616
Samples Characterization studies Instrumental techniques Data analysed Chemometric methods Ref.
V.labrusca wines Compounds important on
wine flavour ESI-MS
Acid and phenolic
compounds PCA (Biasoto et al., 2010)
Albariño wines Geographical origin GC-FID, sensory
descriptive analysis 36 volatile compounds PCA, PLSR
(Vilanova et al., 2010)
Aglianico wines “Terroir” influence 1H-NMR PCA, PLS-DA, HCA (Mazzei et al., 2010)
Madeira wine Ageing GC-MS 37 volatile compounds PCA (Pereira et al., 2011)
Wines Sensory attributes 1H-NMR PCA, PLS-DA (Rochfort et al.,
2010)
Grenache red wines Oxygen impact HPLC-DAD-MS Phenolic compounds PCA (Wirth et al., 2010)
Samples Characterization studies Instrumental techniques Data analysed Chemometric methods Ref
Italian wines (Barbera dʼAlba and Dolcetto
dʼAlba)
Wine authentication
NIR, UV-vis spectrometry,
HS-MS-e-nose
PCA, LDA (Casale et al., 2010)
Italian wines (Barbera dʼAlba and Dolcetto
dʼAlba)
Wine authentication
NIR, UV-vis spectrometry,
HS-MS-e-nose
PCA, LDA (Casale, et al., 2010)
Amarone wine
Correlation between metabolic content and
ageing.
1H-NMR PCA, PLS-DA (Consonni et al.,
2011)
Wines Classification of smoke
tainted wines.
MIR spectroscopy,
GC-MS PCA, LDA (Fudge et al., 2012)
Valpolicella, Amarone and Recioto wines
Differentiate between
brands. HS-SPME-GC-MS 54 volatile compounds PCA, HCA, CTA
(Dall'Asta et al., 2011)
618
619
620
621
Samples Characterization studies Instrumental techniques Data analysed Chemometric methods Ref
Godello wines
Correlation between instrumental and sensorial analyses.
GC-MS 37 volatile compounds PCA, PLS (González Álvarez et
al., 2011)
Shiraz wines Geographic origin UV-vis, NIR and MIR
spectroscopy PCA, LDA, SIMCA
(Riovanto et al., 2011)
Chardonnay wines
Effects of temperature and packaging type on the chemical properties
Colour analysis, HS-SPME-GC-MS
Colour, 30 volatile
compounds PCA, PLS (Hopfer et al., 2012)
Lambrusco wines Authenticity 1H-NMR PCA, PLS-DA (Papotti et al., 2012)
Spanish region wines Wine characterization CZE (capillary zone
electrophorese) 20 polyphenols PCA
(Franquet-Griell et al., 2012)
622
623
624
625
626
Samples Characterization studies Instrumental techniques Data analysed Chemometric methods Ref
Spanish white wines Differentiate wines from
different brands.
Coupled plasma optical
emission spectrometry Metals
PCA, support vector
machine classification. (Jurado et al., 2012)
Sauvignon blanc Effects of different
vinification techniques
1
H-NMR PCA (Baiano et al., 2012)
Sauvignon blanc Evaluation of key
odorants
GC-O
GC-MS Volatile compounds PCA
(Benkwitz et al., 2012)
Rioja wines Geographical origin 1H-NMR 31 compounds
PCA, ECVA (extended canonical variate
analysis)
(Lopez-Rituerto et
al., 2012)
Chilean wines Varietal discrimination ESI-FT-MS PCA, LDA (Villagra et al., 2012)
627
628
629
630
631
632
Samples Characterization studies Instrumental techniques Data analysed Chemometric methods Ref
Garnacha Tintorera wines
Correlation between sensorial and chemicals
profiles.
GC-MS
Aromatic profile 70 volatile compounds PLS-2
(Noguerol-Pato et al., 2012) Spanish appellations wines Discrimination of wines based on oenological practices.
UV-vis Phenolic compounds PCA, PLS1-DA,
PLS2-DA
(Serrano-Lourido et
al., 2012)
633
634
PCA – principal component analysis; PLS – partial least squares; DA –discriminant analysis; LDA – linear discriminant analysis; HCA – Hierarquical Cluster Analysis; CRT – Classification Tree
635
Analysis; SIMCA – Soft Independent Modelling of Class Analogy; GC- gas chromatography; FID –flame ionization detector; MS –mass spectrometry; H-NMR – proton nuclear magnetic resonance;636
HPLC- high pressure liquid chromatography; DAD-diode array detector; NIR – Near-infrared; UV-vis – ultra violet- visible; MIR – mid infrared; HS – headspace; SPME - solid phase micro extraction;637
O –olfactometry; ESI – electrospray ionization; FT-Fourier transform.
638
!"#$%&'()%*+#%,-#$'&./-+#
640
!"0"#1%23*'+#
641
!"#$%&'()*+$','-(./0!1'
642
Thirty-four Port wines between the ages of 1 and 129 years were used for the construction of the
643
database. Wines were made according to standard traditional Port winemaking procedures and all the
644
wines used for the database creation were aged in “pipas” (550 L spent-oak barrels). For the kinetic
645
study (isothermal protocol), 16 litters of Port wine with pH=3.4, 2.5 mg/L dissolved oxygen, a free SO2
646
level of 17 mg/L, 105 g/L of reducing sugars and 20.5% alcohol and produced in the year of the
647
experiment (without any oak contact) were used. Samples were provided by Symington.
648
649
!"#$%&'()*+$'2'-(./3451'
650
For GC-FID analyses 37 samples were used in this study with ages between 2 and 60 years. All
651
wines were matured in oak barrels. The wines were made following standard traditional winemaking
652
procedures for Port wine and have been provided by IVDP (Instituto dos Vinho do Douro e Porto).
653
654
67$&)8#&9:"%'!&:/+$'
655
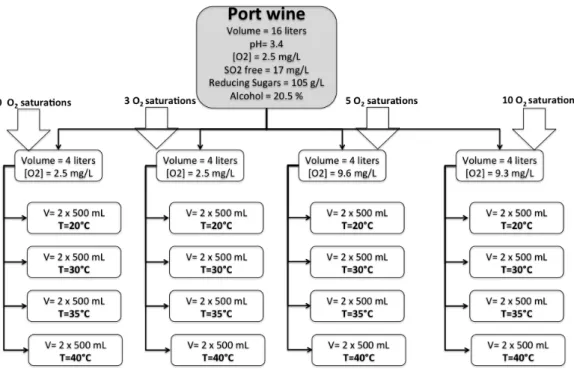
The determination of the kinetics of aging Port wine was done under differing constant storage
656
temperatures and oxygen concentrations (Figure 2.1.1.). Wines were stored at 20, 30, 35 and 40ºC in
657
temperature-controlled incubators. The oxygen treatments included 0 (F1), 3 (F2), 5 (F3) and 10 (F4)
658
saturations. For each combination of oxygen/temperature, used glass vessels filled with 500 mL of
659
wine were used. Oxygen saturation was obtained by stirring the sample vigorously for about 1 hour
660
until an oxygen concentration of about 8-9 mg/L was reached. This was performed in a laminar flow
661
chamber under UV light to prevent microbial contamination. The F1 group was never supplemented
662
with O2. F2 were saturated at sample day 14, 35 and 56. F3 were saturated in the beginning of the
663
experiment and in sample day 14, 28, 42 and 56. F4 were saturated with O2 at all sampling day points
664
(0,14, 21, 28, 35, 42, 49, 56 and 63). This forced aging experimental protocol was performed in
665
duplicate for practical reason. Not all samples were analyzed by GC-MS on the replicate trial and were
666
668
Figure 2.1.1. Experimental Design
669
670
!"!"#$%&'()*+&'#,-.+/01-/"##
671
!"!"#"$%&''()*+,$-./0+1$2+3'45+'$
672
The oxygen concentration was measured using a Fibox 3 LCD fiber optic oxygen transmitter, a
673
polymer optical fiber and planar oxygen sensitive spots (5 mm sensor spots PSt3), from PreSens
674
Precision Sensing GmbH (Germany). The sensor was positioned in the center of the 500 mL glass
675
vessel and remained in contact with the wine at all times. Oxygen levels were measured at 9 intervals
676
(weekly) during the 63 day isothermal storage.
$
677
678
!"!"!"$6()37&)+'$+.75387&(1$9$:;<2=$>13)/'&'$
679
The extraction procedure was based on the method described previously by Silva Ferreira, et al.,
680
(2003). To describe it briefly, 50 mL sample of Port is spiked with 50 μL of 3-octanol in a hydro
681
alcoholic solution (427 mg/L) as the internal standard. Anhydrous sodium sulphate (5 g) is added to
682
increase ionic strength after which the wine is extracted twice with 5 mL dichloromethane. The two
683
organic phases obtained are combined and dried over anhydrous sodium sulphate. Two milliliters of
684
this organic extract are concentrated to 0.4 mL under a constant nitrogen stream.
685
Extracts were analysed using a Varian 450 gas chromatograph, equipped with a mass spectral
686
detector, Varian 240-MS and the Saturn GC-MS workstation software version 5.51.The column used
687
was Stabilwax-DA (60m x 0.25mm x 0.25μm) fused silica (Restek, USA). The injector port was heated