1
Catarina Medeiros
152113067
Can family ownership influence firms' capital structure
decisions?
Professor Diana Bonfim
Supervisor
“We view [Wal-Mart] really more as a trust, as a legacy we are responsible for, rather than something we own.”
John Thomas Walton (2001)
Dissertation submitted in partial fulfillment of requirements for the degree of
Master of Science in Management, with a major in Corporate Finance and Control,
2
Can family ownership influence firms' capital structure decisions?
Catarina Medeiros
152113067
Abstract
The purpose of the present study is to endeavor the explanatory capacity of family ownership in determining the capital structure of the firms. Having this purpose in mind, we collect and analyze information for the period 2005-2013, regarding a sample of 194 family and non-family businesses, whose headquarters' location is in either European or North American countries. We obtain empirical evidence to conclude that i) non-family firms present higher leverage ratios compared to their family peers; and ii) non-family firms rely more on long-term debt than their family peers. Our study adds value to previous research since it compares companies from two different continents, (North) America and Europe, it analyzes how different firm characteristics may influence both leverage ratio and long-term debt to total debt and finally because it studies the impact of the financial crisis on the firms' financial results.
Professor Diana Bonfim
Supervisor
3
Acknowledgements
Firstly, I would like to express my gratitude to my supervisor, Professor Diana Bonfim, which had an extraordinarily important role in the elaboration of the present dissertation. Her tireless support and motivation helped me to overcome all the difficulties and improve the outputs of my work.
I would also like to thank to my friends and to my colleagues from the Empirical Corporate Finance seminar, whose inputs helped me to consolidate the methodology applied in the present dissertation.
I would like to show my gratitude to my old colleagues from KPMG Portugal from whom I learned so much, in particular to Jorge Farinha and Joana Morais, and to the partner of the department where I used to work, Jorge Santos, who facilitated this two-year gap.
Finally, my warmest thanks go to my family: to my parents, Pedro and Mimi, and sisters, Madalena, Mafalda and Margarida, which have always supported me no matter what, and have given me the opportunity to accomplish this long-time defined goal for my career; and to Francisco for all his love, inspirational motivation, help and patience.
4
Table of Contents
1. Introduction ... 7
1.1 Family firms defined ... 7
1.2 Hypothesis development ... 8
1.3 Contribution of the present dissertation ... 10
2. Literature Review ... 11
2.1 Contribution of family firms to the economy ... 11
2.2 Family firms in the literature ... 12
2.2.1 Financing preferences ... 13
2.2.2 Underinvestment problem ... 14
2.2.3 Agency problems ... 14
2.2.4 Firm characteristics that may influence debt ... 15
3. Methodology ... 18 3.1 Data description... 18 3.2 Sample construction ... 18 3.3 Variables definition ... 20 3.4 Empirical strategy ... 21 4. Results ... 22 4.1 Descriptive statistics ... 22 4.2 Regression models... 23 5. Robustness ... 26 6. Conclusions ... 31 7. Limitations ... 33
5
8. Tables... 34 9. References ... 50
6
List of tables
Table 1: Sample analyzed per ownership structure ... 34
Table 2: Sample analyzed per country of domicile ... 34
Table 3: Dependent variables analyzed ... 35
Table 4: Independent variables analyzed ... 36
Table 5: Sample analyzed per business sector ... 37
Table 6: Descriptive statistics for the sample (2005-2013) ... 38
Table 7: Summary of outputs from t-testing mean differences ... 39
Table 8: Descriptive statistics for the sample sub-groups (2005-2013) ... 40
Table 9: Pearson's correlation matrix ... 42
Table 10: Summary of outputs from regressions ... 43
Table 11: Summary of outputs from regressions with winsorized sample ... 44
Table 12: Summary of outputs from regressions with winsorized sample, controlled for regulatory effects ... 45
Table 13: Summary of outputs from regressions with winsorized sample, controlled for location effects ... 46
Table 14: Summary of outputs from regressions with separate winsorized samples of European and North American firms ... 47
Table 15: Summary of outputs from regressions with winsorized sample, controlled for temporal effects ... 48
Table 16: Summary of outputs from regressions with separate winsorized samples for the sub-period pre-financial crisis, at-financial crisis and post-financial crisis... 49
7
1. Introduction
The aim of the present dissertation is to give continuity to the empirical research developed so far to better understand the financing decision-making process of family firms. Hence, the main purpose of this dissertation is to answer to two research questions: i) how are the financing preferences of family-owned firms different when compared to non-family-owned firms?; ii) besides the ownership structure, what other firm characteristics influence the financing preferences of firms and how is that influence exerted?
1.1
Family firms defined
The literature on family business is extensive. Experts and researchers have not yet reached consensus on the definition of family business. Instead, different authors have been approaching the subject using different definitions.
Citing López-Gracia and Sánchez-Andújar (2007), three criteria are usually followed to define a family business: i) who effectively manages the business (e.g., Holderness and Sheehan, 1988; Ang, Cole and Lin, 2000); ii) who owns the firm capital (e.g., Donckels, Rik and Lambrecht, 1999; Littunen and Hyrsky, 2000); lastly, iii) the availability of family members of the founder or co-founder to give continuity to the business, either assuming management functions at the firm or owning a certain share of the firm capital (e.g., Allen and Panian, 1982; McConaughy and Phillips, 1999; Anderson and Reeb, 2003, 2004; Bennedsen, Pérez-González and Wolfenzon, 2006; Gómez-Mejía et al., 2007).
Some even consider as family businesses those that are run or owned by an individual, with or without partners, even if they are not related among each other (e.g., La Porta, Lopez-de-Silanes and Shleifer, 1999; Cronqvist and Nilsson, 2003; Luo and Chung, 2005). Others accept that the firm is controlled by an entity (e.g., Holderness and Sheehan, 1988) or by a group of families (e.g., Claessens, Djankov and Lang, 2000).
Shanker and Astrachan (1996) suggested an innovative measure of family ownership. The authors created a continuous range (which would go from high to low levels) for defining family involvement. Later on, Sciascia, Mazzola, Astrachan and Pieper (2012) introduced the F-PEC
8
index of family influence, based on three components — power, experience, and culture. Already in 2003, Astrachan and Shanker pointed out specific criteria based on the business life cycle which should be considered while defining a “family business”.
According to the European Commission (2009)1, a firm, of any size, is a family business if: i) the majority of decision-making rights is in possession of the natural person(s) who established the firm, or in possession of the natural person(s) who has(have) acquired the share capital of the firm, or in possession of their spouses, parents, child or children’s direct heirs; ii) the majority of decision-making rights are indirect or direct; iii) at least one representative of the family or kin is formally involved in the governance of the firm; iv) listed companies meet the definition of family enterprise if the person who established or acquired the firm (share capital), or their families or descendants, possess 25 per cent of the decision-making rights mandated by their share capital.
Given all these variations, we opted to use the definition of Campden FB2, which includes two lists: one containing the one hundred largest family businesses in Europe (2009) and the other in North America (2010). To be included in these lists, businesses have to meet the following criteria: i) at least one representative of the family or kin had to be involved in the governance of the company; ii) publicly-listed companies had to meet the definition of family enterprise, which is that the person who established or acquired the firm, or their families and descendants, possessed 25 per cent of the decision-making rights mandated by their share capital; and iii) the share capital controlled by the family had to be, at least, in the second generation or beyond.
1.2
Hypothesis development
The studies made so far to compare the leverage ratios in family and non-family firms present contradictory results. While Gallo and Vilaseca (1996), Mishra and McConaughy (1999) and Ampenberger et al. (2013) assert that family firms present low leverage ratios - which Sonnenfeld and Spence (1989) justify as a reaction to the concern that, in case the firm fails the
1
Website consulted: http://ec.europa.eu/enterprise/policies/sme/promoting-entrepreneurship/family-business/index_en.htm
2
Websites consulted: http://www.campdenfb.com/article/top-100-family-businesses-north-america; and http://www.campdenfb.com/article/top-100-family-businesses-europe-0
9
payment of debt, the family's reputation and personal guarantees will be damaged -, Anderson and Reeb (2003) do not find any significant differences between family and non-family firms, neither in the degree of leverage nor in the type of credit products used. Coleman and Carsky (1999) do not even find any significant differences in the type of credit products used by both forms of companies. Ellul (2008), on the contrary, concludes that family firms present higher leverage ratios relative to non-family firms - evidence that becomes more evident in the presence of family in the firm’s management than by having a family ownership on its own. Ellul also finds that institutional blockholders do not have a significant impact on capital structure.
Given the heterogeneity of results found by other authors, our study aims to assess whether family firms, in Europe and North-America, present lower leverage ratios relative to their non-family peers operating in similar markets:
The comparison between the proportion of long and short-term debt that family and non-family firms use has also been divisive. Marchica (2008) finds out a positive relationship between the ownership concentration and the use of short-term debt. Ang (1991) and Bopaiah (1998), on the contrary, verify that, when internal funds are insufficient, family-owned firms tend to turn more to long-term debt than to short-term debt.
One possible justification for the propensity of family firms to use more long-term debt than non-family firms has been provided in the literature. Creditors tend to perceive family-owned businesses as less risky than non-family-owned businesses, thus facilitating the attribution of long-term debt to family-owned businesses in detriment of non-family-owned (e.g., Colot and Croquet, 2007; Menéndez-Requejo, 2006). This higher level of confidence of creditors on owned businesses would be linked to two factors: firstly, the bankruptcy of a family-owned firm would usually lead to its owners' personal bankruptcy - since most owners apply their personal finances in their family businesses (e.g., Ang, 1991; Bopaiah, 1998); secondly, the family reputation would normally be linked to the firm performance (e.g., Menéndez-Requejo, 2006).
From the considerations presented above, we formulated the following hypothesis: Hypothesis 1: Family firms present lower leverage ratios than their non-family peers.
10
1.3
Contribution of the present dissertation
We contribute to the literature in different dimensions. First, to our best knowledge, our empirical study is one of the first studies to compare capital structure decisions of family and non-family firms in two different continents, (North) America and Europe.
Additionally, unlike some other studies, the present dissertation aims to find what firm characteristics, other than ownership structure, may influence financing decisions.
Finally, we study how temporary effects, such as the 2008 world crisis, may influence the financing structure of firms.
(North) America and Europe are the continents of our choice given that i) they provide a reasonable insight on whether the characteristics of each firm in mature countries influence capital structure decisions; ii) previous literature review on family businesses was primarily focused in a unique country, the United States; and iii) the two continents cover the countries that perhaps suffered the most from the world financial crisis which began in late 2008.
The present dissertation is organized as follows. In Section 2, we summarize the most significant inputs that previous literature adds to our study. In Section 3, we present the methodology adopted to elaborate this study. Section 4 introduces the results from the descriptive statistics and empirical model, while Section 5 describes the robustness tests that were made to our study. Section 6 concludes, while Section 7 indicates the most relevant limitations of the present work. At last, Section 8 gathers the tables that provide additional and detailed information on our data, methodology and findings, whereas Section 9 includes all the works referenced.
Hypothesis 2: On average, family-owned firms rely more on long-term debt than their non-family peers.
11
2. Literature Review
2.1
Contribution of family firms to the economy
It is well known that family firms are natural boosters of the world economy. However, the extent of that impact has been cause for debate for many years, mainly due to the lack of a universally accepted definition for a family business, thus hindering the comparison between different sources. Further, many of the criteria that define a family business are difficult or impossible to assess, given the private nature of the majority of family businesses (e.g., Shanker and Astrachan, 1996).
Westhead and Cowling (1998), for example, tried to demonstrate how the percentage of family firms in the United Kingdom could be significantly different depending on the criteria used to classify family firms. Using two of four criteria to classify the firms, namely family involvement and family property, approximately 79 to 81 per cent of the companies investigated would be classified as family firms. However, using the four criteria, the proportion of firms classified as family firms would fall to 15 per cent.
Citing Croci, Doukas and Gonenc (2011), most companies around the world are controlled by families, including more than half of all public corporations in the United States and Europe and more than two-thirds in Asia (e.g., La Porta, Lopez-de-Silanes and Shleifer, 1999; Claessens, Djankov and Lang, 2000; Faccio and Lang, 2002).
Citing The Economist's article "Business in the blood" (November 1st, 2014)3, family-controlled firms make up 19 per cent of the companies in the Fortune Global 500, compared to 15 per cent in 2005. These are the results of a research by McKinsey, which defines such firms as those whose founders or members of the founding-family own the biggest stake, of at least 18 per cent of the firm's capital, in addition to the power to appoint the chief executive. Since 2008, these firms' sales have been growing by 7 per cent a year, slightly ahead of the 6.2 per cent a year by the non-family firms analyzed. McKinsey expects that these trends are maintained for the
3 Website consulted:
12
foreseeable future. McKinsey also forecasts that by 2025, there will be more than 15,000 companies worldwide with at least 1 billion USD in annual revenues, of which 37 per cent will be emerging-market family firms. Currently, around 85 per cent of 1 billion USD-plus businesses in South-East Asia are family-run, around 75 per cent in Latin America, 67 per cent in India and around 65 per cent in the Middle East. China (where the proportion is about 40 per cent) and Sub-Saharan Africa (35 per cent) stand out for their relatively low share of family firms, because, in both cases, many large firms are state-owned.
2.2
Family firms in the literature
The phenomenon of family business is receiving increasing attention from scholars and consultants. Our review of the literature comprised about one hundred articles or papers published in journals or reviews, such as Family Business Review, Review of Financial Economics, The Journal of Finance, and Journal of Corporate Finance, among others.
Several different areas of research for family firms have been approached, namely firm performance (e.g., Anderson and Reeb, 2003, 2004 and 2007; Corstjens, Peyer and Van der Heyden, 2006; Herrero, 2011); innovation and technology (e.g., Correia, 2003); entrepreneurial orientation (e.g., Short et al., 2009); strategic orientation (e.g., Gudmundson, Hartman and Tower, 1999); agency theory (e.g., Anderson and Reeb, 2004; Chrisman, Chua and Litz, 2004; González et al., 2014); work contracts (e.g., Bassanini et al., 2013); or the influence exerted by the ownership structure on corporate governance (e.g., Claessens et al., 2002; Lins, 2003; Durnev and Kim, 2005; Masulis, Pham and Zein, 2009).
Research has demonstrated that the rationale behind the financial decisions at an organizational level is influenced by the ownership structure (e.g., Anderson and Reeb, 2003; Andres, 2008; McConaughy, Matthews and Fialko, 2001; Steijvers and Voordeckers, 2009; Koropp, Kellermanns, Grichnik and Stanley, 2014). The specificities of family firms raise the need to analyze their financing decisions in detail and compare them to the financing decisions of non-family firms. The present dissertation aims to analyze this, by studying the impact of both the ownership structure and firm characteristics in the financial decision-making of firms.
13
2.2.1 Financing preferences
Empirical studies have revealed that family firms follow more conservative financing decisions, which tend to be influenced by both the generation in place and managerial succession (e.g., McConaughy and Phillips, 1999; López-Gracia and Sánchez-Andújar, 2007; Amore, Minichilli, and Corbetta, 2011). Typically family business owners prefer traditional commercial banking arrangements in detriment of other sources of capital, namely investment and venture capital, initial public offerings, funding through general finance companies, and access to state and local funds (e.g., Dreux 1990; Romano, Tanewski and Smyrnios, 2001). Moreover more established, larger family businesses which have either an outside board of directors or a non-family member in the financial decision-making role are more likely to employ sophisticated financial management techniques (e.g., Filbeck and Lee, 2000).
Family firms are found to prefer internal financing (e.g., Romano, Tanewski and Smyrnios, 2001; Sirmon and Hitt, 2003), either investing the cash-flows generated by the operations or the owners' private funds (e.g., Poutziouris, 2001), to raise external financing. After exhausting their internal financing sources, family-owned firms prefer debt to external equity (e.g., Poutziouris, 2001; Romano, Tanewski and Smyrnios, 2001; López-Gracia and Sánchez-Andújar, 2007). One justification for this preference of debt over equity is that it does not have a diluting or diminishing role in the control over the firm (e.g., Ellul, 2008) and existing literature has already concluded that control motives can influence the debt-equity mix that firms choose to have (e.g., Harris and Raviv, 1988; Stulz, 1988; Israel, 1991). Another justification can be the one presented by Zwiebel (1996) which suggests that management may use debt as a signaling mechanism to the market to announce that the firm is not going after management empire building. However, Ellul (2008) was not able to find evidence for this. An additional justification has been presented by Jaskiewicz et al. (2005). The authors find that family businesses tend to underperform by the time they go public, via initial public offerings (IPOs), when compared to non-family businesses. The rationale described above is in line with the pecking-order theory, which stems from Myers (1984). The theory establishes that, when facing any kind of frictions in the market, companies
14
tend to have the following financing preferences: they prefer internal to external financing and debt to equity, in case external financing is used.
Paradoxically, non-family businesses are less likely to restrain their financing to internally generated funds and more likely to adopt a market-oriented approach to funding, consequently being more growth oriented, in general, than family firms (e.g., Binks and Ennew, 1994; Mulkay and Sassenou, 1995; Poutziouris, 2001).
2.2.2 Underinvestment problem
One of the consequences of the preference for internal financing that family firms seem to have is the underinvestment problem: they may opt by forgoing certain interesting investment projects, which would contribute to their growth, as the family is not willing to endanger its position in terms of firm control (e.g., Mahérault, 2004; Wu, Chua and Chrisman, 2007). This problem leads us to agency theory, for which several authors have had important contributions, namely Jensen and Meckling (1979), and Eisenhardt (1989).
2.2.3 Agency problems
Agency theory refers to conflicts of interest between principals and agents, who function as representatives of principals. Agents are commonly illustrated by managers, whereas principals commonly represent the ultimate owners of the firms, the shareholders - even though there are other possible representations. Agency problems arise when the agents and principals pursue distinct interests and therefore agents, who would normally possess more or better information on the firm, will practice actions and decisions which ultimately will not defend the interests of the shareholders of the firms. They will go after their own interest instead. This sort of behavior will bring what we call agency costs, which are costs incurred to make sure that agents act in the interests of principals.
Some authors refer to the family business as the optimal firm model in terms of agency problems (e.g., Daily and Dollinger, 1992; Kang, 2000). Ang, Cole and Lin (2000) synthesized this idea
15
when proposing the sole-owner managed firm as the zero agency cost base case. However, this is not what empirical evidence has shown. Sharma, Chrisman and Chua (1997) find that family firms do not correspond to this goal congruence which would, in due course, result in the absence of agency costs. Actually, information asymmetry has been a repeatedly appointed issue for this type of firms (e.g., La Porta, Lopez-de-Silanes and Shleifer, 1999; Schulze et al., 2001). The phenomenon may take the form of a biased evaluation of the family members by the firm's CEO which may avoid, punishing poor performance to avoid damaging the relationships within the family (e.g., Schulze, Lubatkin and Dino, 2003).
It is true that agency problems arising from the separation of ownership and management do not occur in sole-owner managed firms, but agency costs can still arise from conflicts of interest between creditors and firm owners, as well as between dominant and minority owners. Chrisman, Chua and Litz (2004) compared the existence of agency problems in family and non-family firms. The authors' findings are in line with those of other authors which suggest that family involvement may, indeed, decrease overall agency problems (e.g., Jensen and Meckling, 1979; Fama and Jensen, 1983).
2.2.4 Firm characteristics that may influence debt
It is not clear which factors, besides ownership, drive the capital structure decisions of firms. Therefore, we additionally analyze a set of firm characteristics with the purpose of finding the influence they exert in capital structure decision-making.
Relying on the pecking-order theory rationale, we expect that firms choose to finance new projects through internally generated funds in the form of retained earnings as their first choice. Only after exhausting that sort of financing, they will use either debt or equity. Therefore, we expect that the leverage ratio decreases as firm profitability increases. Please note that in the verification of the trade-off theory (e.g., Myers, 1984), the opposite would verify. Firms would be willing to have more financing through debt given that this would increase their benefits in terms of tax shields. On the contrary, non-family businesses are less likely to restrain their financing to internally generated funds and more likely to adopt a market-oriented approach to
16
funding, consequently being more growth oriented, in general, than family firms (e.g., Binks and Ennew, 1994; Mulkay and Sassenou, 1995; Poutziouris, 2001).
Furthermore, one would expect that the more liquid the firms are, the easier it is for them to find creditors that are willing to finance them. However, Graham (2000) finds the opposite to be true. Additionally, we look at the amount of tangible assets available as a possible explanatory variable for the positive variation in the leverage ratio of firms. It is common that creditors resort to the borrowers' tangible assets which can be pledged as collateral, such as accounts receivable, inventory and equipment. In these cases, if, for some reason, the firm is unable to repay the debt or to pay the interest expenses, the creditors would be allowed to expropriate tangible assets from the borrowing firm, as initially contracted. Therefore, the fact that the firm presents a high ratio of asset tangibility makes it look less risky in the "eyes" of creditors.
Moreover, we look at the size of the firm, which we measure by the natural logarithm of total assets, since it can be seen as representative of the amount of risk inherent to the firm. As creditors perceive it, we expect that they are consequently willing to contract a higher amount of debt proportional to the amount of total assets that the firm has (e.g., Hovakimian, Opler and Titman, 2001; Ellul, 2008).
Finally, in the verification of the pecking-order theory, after exhausting the internally generated funds, firms would choose to use debt to finance new projects. Therefore, one would expect that the more growth opportunities the firm has, the higher amount of debt financing it will use. Yet, this is not what has been observed in previous empirical studies for family firms. Instead, the opposite has been proved: the more growth opportunities family firms have, the lower amount of debt financing they tend to use (e.g., Graham, 2000). This can be justified by the underinvestment problem described earlier (e.g., Jensen and Meckling, 1979; López-Gracia and Sánchez-Andújar, 2007).
In terms of cross-sector variation, Harris and Raviv (1991) verified that companies within a particular industry present more similar capital structures when compared to those of different sectors. Compared to drug, instrument, electronic and food industries, which tend to lave low leverage ratios, paper, textile, steel, airline and cement industries tend to have higher leverage (e.g., Bowen, Lane and Huber, 1982; Bradley, Jarrell and Kim, 1984). Additionally, a negative
17
relationship between short-term debt and the retail sector and a positive relationship between debt and equity and the manufacturing sector has been shown by previous research (e.g., Welsh and White, 1981; Van der Wijst, 1989).
In sum, besides our main analysis which lies under Hypothesis 1 and 2, we expect that our analysis allows the verification of the following:
The leverage ratio decreases as the firm's profitability increases, ceteris paribus;
The leverage ratio decreases as the firm's liquidity grows, ceteris paribus;
The leverage ratio increases as the firm's asset tangibility increases, ceteris paribus;
The leverage ratio increases with the size of the firm, ceteris paribus;
18
3. Methodology
3.1
Data description
To our best knowledge, detailed empirical evidence which compares the capital structures of European and North American family and non-family businesses is lacking. The present study aims to fill in this gap, by analyzing a set of 194 European and North American companies.
3.2
Sample construction
In order to meet our goal, we gather an initial sample of 200 family firms: 100 firms whose country of origin is either the United States or Canada and 100 firms whose country of origin is European. Given the difficulties faced to extract sufficient information which would allow for the correct classification of a significant number of businesses as family-owned businesses or not (Section 1.1), we use a public list of family businesses. The one we found most accurate was the one presented by Campden FB. The source provides two different lists of companies, ordering them according to the end-of-year revenues. The list containing North American firms ranks the firms according to the end of 2010 revenues4, in billion USD, whereas the list containing European firms takes in consideration the end of 2009 revenues5, in billion Euros.
For this sample, annual data was extracted from Bloomberg spanning the period 2005-2013. All data is extracted in USD. However, we are forced to reduce the sample to 62 family firms, essentially for three reasons: i) we cannot find data in Bloomberg for some of the family firms mentioned in the Campden FB list; ii) we are not able to find information for some of the family firms regarding one or more of the variables of analysis (dependent or independent); iii) there is no available data on Bloomberg for the entire period of analysis, 2005-2013, for some of the firms. The resulting sample consists of 62 family firms, 21 of which are North American and 41 are European firms (Tables 1 and 2).
4 Website consulted: http://www.campdenfb.com/article/top-100-family-businesses-north-america 5 Website consulted: http://www.campdenfb.com/article/top-100-family-businesses-europe-0
19
The next step is to find a sample of non-family firms which would be comparable to our sample of family firms. In order to do that, we use the "Relative Valuation" screen, which is available on Bloomberg, to extract information for 50 possible peer companies for each firm. Selection was based on the following criteria: i) business sector; ii) company's region of domicile; iii) market capitalization; iv) total assets; v) gross profits; vi) revenues; and vii) sales to total assets ratio. Of these 50 potential peers, given by Bloomberg, for each of our family firms, we select 3 peers per family firm so that we gather a sample of non-family firms that is representative of reality, on one side, and so that, in case any of the firms in our sample was mistakenly classified as non-family firm, we still had a sufficient number of actual non-non-family firms in our study.
As there are no 2009 and 2010 figures available in Bloomberg in the "Relative Valuation" screen, we compare the figures of family firms and potential peers, using the most recent year available in Bloomberg (which varies from company to company). We assume that, in case they are similar in the recent years, they would already be similar by 2009 (in the case of European firms) and by 2010 (in the case of North American firms), which consist of the two years considered by Campden FB. Please note that all figures are collected in USD.
We also consider the following assumptions in the selection of non-family firms: i) all the potential peers that do not lie in Campden FB list of family firms are assumed to be non-family firms; ii) every time a firm does not present values for more than one of the criteria identified above, it is not considered a peer, unless the family firm which it compares to does not present values for those criteria as well; iii) 4 of our 62 family firms are not available in the "Relative Valuation" screen from Bloomberg, and therefore, even though we keep those firms in our sample of family firms, we cannot collect any non-family peers for those firms.
Similarly to what we consider in the family firms selection, we exclude the firms i) for which we are not able to find information regarding one or more of the variables of analysis (Tables 3 and 4) and ii) for which there is no available data on Bloomberg for the entire period of analysis, 2005-2013.
In the end, our sample of 132 non-family firms is constituted of 43 North American and 89 European firms (Tables 1 and 2), which corresponds to an average of 2.15 North American non-family firms per non-family firm and 2.17 European non-non-family firms per non-family firm.
20
The most common business sectors in our sample are food beverage and tobacco, materials and media (Table 5) and the four most common country locations are the United States, France, Britain and Italy (Table 2).
3.3
Variables definition
In the present dissertation, the characterization of the capital structure of each firm is made using two variables, namely i) Leverage and ii) Long-term leverage. We compute Leverage as the ratio of Debt to Total assets. We measure Long-term leverage as the ratio of Long-term liabilities to Total debt (Table 3).
Different firm characteristics have proved to influence the choices behind firms' capital structures (e.g., Lemmon and Zender, 2004; López-Gracia and Sánchez-Andújar, 2007; Ellul, 2008). In the present dissertation, we include different independent variables (Table 4), which can either take the form of firm characteristics or dummy variables.
In terms of firm characteristics which may influence capital structure decisions, besides ownership structure, we include the following: i) Profitability, ii) Liquidity, iii) Asset tangibility, iv) Size and v) Growth opportunities. We measure Profitability as the Return on assets. We calculate Liquidity using both Cash and Current ratios. We compute Asset tangibility using the ratio of Tangible assets to Total assets. In order to measure Size, we use the natural logarithm of Total assets. Lastly, we proxy Growth opportunities through the Tobin's Q ratio. Please note that for all the variables defined, Bloomberg was our unique source of values.
In addition to the firm characteristics, we defined six dummy variables. The first one aims to distinguish family from non-family firms, so that these can be compared in our empirical model. Our second dummy variable aims to control for country-inherent factors, so that we can distinguish European and North American factors which may affect firms' capital structure. Our third and fourth dummy variables are used to control for potential differences in sectors which are usually subject to regulation in terms of the amount of leverage they must present: utilities and financial services (e.g., Demsetz and Lehn, 1985). Our fifth and sixth variables aim to control for temporal factors which may affect the firms. We focus on the financial crisis initiated
21
in late 2008. For this reason, we consider the period 2005-2007 as prior to the crisis and 2011-2013 as the years subsequent to the financial crisis (during this latter period, the US economy was already recovering, but the European economy was at the core of the euro sovereign debt crisis).
3.4
Empirical strategy
In order to validate the research hypothesis previously (Section 1.2), we build multiple
regressions. In the case of Hypothesis 1, we build a multiple regression from which we expect to get a negative coefficient for the variable FF:
LEVi = β0 + β1ROAi + β2CURi + β3ATi + β4SIZi + β5TBQi + β6FFi + Ɛi ( 1 )
where the dependent variable LEVi corresponds to the leverage ratio of a firm i and it is
measured by the ratio of Debt to Total assets. The explanatory variables considered in the regression are: ROAi (corresponds to the return on assets of a firm i and it is estimated by the
ratio of Net income to Total assets); CURi (corresponds to the current ratio of a firm i and it is
determined by the ratio of Current assets to Current liabilities); ATi (corresponds to the asset
tangibility of a firm i and it is measured by the ratio of Tangible Assets to Total assets); SIZi
(corresponds to the size of a firm i and it is measured by the natural logarithm of Total assets); TBQi (corresponds to the Tobin's Q of a firm i and it is calculated by the sum of the market value
of equity and book value of debt divided by the sum of book value of equity and book value of debt); FFi (dummy variable which assumes the value of 1 in case the firm i is a family firm and
the value of 0 otherwise); Ɛi corresponds to the error term.
In order to validate Hypothesis 2, we build the following multiple regression, from which we expect to achieve a positive coefficient for the variable FF:
LTLi = β0 + β1ROAi + β2CURi + β3ATi + β4SIZi + β5TBQi + β6FFi + Ɛi ( 2 )
where the dependent variable LTLi corresponds to the level of long-term liabilities of a firm i
over its total debt and it is measured by the ratio of Long-term liabilities to Total debt. The independent variables are the same as in regression (1).
22
4. Results
4.1 Descriptive statistics
In this section, we present the descriptive statistics for the entire period of analysis, 2005-2013, for the entire sample group (Table 6) and separately for the two subgroups in our analysis, namely family and non-family firms (Table 7).
Looking at our independent variables, leverage ratio (LEV) and proportion of long-term debt to total debt (LTL), the descriptive statistics indicate that our sample has an average debt level of 29 per cent, whereas the average proportion of long-term liabilities over the total debt is about 60 per cent. This means that, in our sample, on average, firms, rely more on long-term than short-term liabilities (Table 6).
Even though there are no striking differences between the mean and the median of each variable presented in Table 6 - therefore we do not have strong evidence that there are outliers -, the minimum and maximum values for some variables depart significantly from the mean of the same variables. For instance, variables such as the cash ratio (CAR), the current ratio (CUR) and the Tobin's Q ratio (TBQ) seem to have, across the data points, values that are very distant from the mean.
Afterwards, we assess whether the subgroups within our sample, family and non-family firms, differ statistically from each other, basing our analysis in t-testing of mean differences. We start by testing the null hypothesis that the difference between the means of leverage level (measured as Debt to Total assets) in the two subgroups is zero. The conclusion of the t-test is that, doing a two-tail test, we cannot reject the null hypothesis, for a significance level of 5 % (Table 7). The descriptive statistics confirm this, by displaying no significant differences in terms of leverage ratio (Table 8). The two types of firms, at least in our sample, use approximately the same level of debt financing, on average.
Furthermore, we test the hypothesis that the difference between the means of long-term leverage - measured as Long-term liabilities to Total debt - for our two subgroups is zero. We conclude that, doing a two-tail test, we can reject the null hypothesis, for a significance level of 5 (Table
23
7). Our descriptive statistics, once again, confirm these conclusions: we observe a tendency of non-family firms to rely more on long-term debt than their family peers. The difference is of approximately 50 percentage points, on average. Our sample of firms, for itself, does not verify Hypothesis 2, which states that non-family firms rely more on long-term debt than family firms (Section 1.2).
From the Pearson's correlation matrix (Table 9), we conclude that most of the variables have relatively low linear correlations among each other, including the independent variables with the dependent ones, leverage ratio (LEV) and proportion of long-term debt to total debt (LTL). However, there seems to be one exception: the variables cash ratio (CAR) and current ratio (CUR), which show a correlation of 68 per cent. As both the cash ratio and the current ratio aim to characterize the firms' liquidity, we exclude cash ratio from the rest of our analysis, thus reducing multicollinearity.
4.2
Regression models
From the regressions (1) and (2), which are estimated for the entire period of analysis, we extract the outputs that are summarized in Table 10. Please note that the leverage ratio (LEV) is the dependent variable in regression (1), while the proportion of long-term debt to total debt (LTL) is the dependent variable in regression (2).
We evaluate the overall goodness of fit for our model using three different approaches. Firstly, even though this approach applies better to time series analyses and not cross-sector ones, we compare the adjusted R square obtained by running the regressions (1) and (2). We observe that it is highest for regression (2), assuming the value of 47.4 per cent. It is important to mention that we could not expect to obtain a high value of adjusted R square, since both the leverage ratio and the proportion of long-term debt to total debt that firms use, our dependent variables, may vary upon numerous observed and unobserved factors other than the independent variables that we include in our first and second regressions.
24
Additionally, we take the F-test to test the null hypothesis of the coefficients being equal to zero, for a significance level of 1 per cent. We reject this hypothesis, i.e. we conclude that our coefficients are jointly different from zero.
Finally, we look at the t-statistics obtained in the three multiple regressions for each variable and conclude that the current ratio (CUR), Tobin's Q (TBQ) and the dummy variable family firms (FF) are the unique coefficients statistically significant for a significance level of 1 per cent in our two regressions. Please note that we consider as statistically significant all the variables included in our model for which the null hypothesis of the coefficients being equal to zero is rejected. Otherwise, the variables do not add any statistically significant value to our regression model, which is the case of asset tangibility in regression (1) and return on assets in regression (2), thus not allowing the verification of neither a positive nor negative effect over the dependent variable of each regression.
Following from the t-testing, we verify that, in regression (1), we can conclude on the association between our dependent variable, the leverage ratio, and the following variables: return on assets (ROA), current ratio (CUR), size (SIZ), Tobin's Q (TBQ) and, most importantly, family firms (FF). Starting with the most important coefficient, we conclude that non-family firms are, in fact, expected to present higher leverage ratios compared to their family peers. This conclusion is the confirmation of Hypothesis 1 (e.g., Sonnenfeld and Spence, 1989; Gallo and Vilaseca, 1996; Mishra and McConaughy, 1999; Ampenberger et al., 2013).
In regression (2), having the t-testing as a basis once again, we can conclude on the association between our dependent variable, the proportion of long-term debt to total debt, and the following variables: current ratio (CUR), asset tangibility (AT), size (SIZ), Tobin's Q (TBQ) and, most importantly, family firms (FF). The most important conclusion that we can make over regression (2) is that we reject Hypothesis 2, thus confirming Marchica's (2008) expectations and denying other authors' expectations (e.g., Ang, 1991; Bopaiah, 1998; Menéndez-Requejo, 2006; Colot and Croquet, 2007). We verify that, contrarily to what we expected, non-family firms seem to present higher levels of long-term debt to total debt, when compared to their family peers.
Regarding the remaining coefficients from regression (1), we encounter a negative association betweenfirms' leverage ratio and the following firm characteristics: i) return on assets (ROA),
25
therefore confirming previous literature expectations (e.g., Ennew and Binks, 1994; Mulkay and Sassenou, 1995; Poutziouris, 2001); ii) the amount of growth opportunities, measured by the Tobin's Q ratio (TBQ), therefore confirming previous literature expectations (e.g., Jensen and Meckling, 1979; López-Gracia and Sánchez-Andújar, 2007); iii) firm's liquidity, hereby represented by the current ratio (CUR), thus meeting Graham's expectations (2000). On the other side, we find a positive association between firms' leverage ratio and size (SIZ), therefore confirming previous literature expectations (e.g., Hovakimian, Opler and Titman, 2001; Ellul, 2008).
Furthermore, the outputs from regression (2) allow the following associations between the proportion of long-term debt to the total debt and the firm characteristics:: i) firm's liquidity, which is measured by the current ratio (CUR), seems to be positively associated to the proportion of long-term debt to total debt, contrarily to what we observed with the leverage ratio; ii) the asset tangibility ratio (AT) seems to be negatively associated to the contraction of long-term debt to total debt, contrarily to what we observed with the leverage ratio; iii) similarly to what we verified in the total leverage ratio, the firms' size (SIZ) exerts a negative influence on the proportion of long-term debt to total debt; iv) finally, the Tobin's Q ratio (TBQ) seems to be negatively linked to the proportion of long-term debt to total debt, contrarily to what we observed with the leverage ratio. These conclusions are important, since that, to our best knowledge, there are not many studies focusing on the relationship between the proportion of long-term debt and the firm characteristics.
26
5. Robustness
The present section refers to the quality assurance methodology that we adopt in relation to the multiple regression model developed so far.
We start by winsorizing our sample, identifying the two top and bottom values from our observations, considering, for each of the variables that enter our regression models, all the observations that take place in any of the years of our period of analysis. Afterwards, we winsorize our sample, by replacing those values identified by the third top and bottom values. We run again regressions (1) and (2) using this winsorized sample of firms, which hopefully excludes the most significant outliers, and we obtain the results that are summarized in Table 11. Even though we winsorize the sample, not much changes from our previous results (Section 4 - Table 10). We only verify the following changes: i) all estimated coefficients increase in absolute terms, except the independent variables size, SIZ, and family firms, FF, in regression (2); ii) the independent variable size also loses significance in regression (1); iii) the adjusted R square increases for the two regressions, even though regression (2) maintains its ranking, now with 51.3 per cent of explanatory power.
In order to study the impact that sectors which face stricter regulation may have in our regression models, we introduce two dummy variables, FIN and UTI (Table 4), looking forward to identify the financials, insurance and utilities companies lying in our sample. These are the business sectors that are most commonly subject to regulation to control for their debt ratios. Given the low portion of firms within the overall sample whose business sector is one of these three, we exclude these few companies - for which the dummy variables FIN and UTI assume the value of 1 - from our winsorized sample and run the regressions (1) and (2) again.
Comparing our new results (Table 12) to the ones that we just presented (Table 11), we observe the same conclusions as before in terms of t-tests made to the coefficients obtained, thus verifying no changes regarding the significance levels for which the null hypothesis is denied. The only changes we verify are in terms of: i) a tiny increase in the coefficients ROA in regression (1) and TBQ in both regressions; ii) an also tiny decrease in the coefficients AT and FF in both regressions; and finally iii) a small decrease in the adjusted R squared value in the two
27
regressions. As no important changes are verified when running the two regressions for the winsorized sample with and without controlling for regulatory effects, we continue to use the winsorized sample including these firms for the coming regressions.
As Ellul (2008) pointed out, international data offers important benefits for our knowledge of capital structure decisions, but also entails costs: i) different countries, and especially from different continents, may follow different accounting standards; ii) different countries and companies may have implemented different cost accounting methods (historical cost Vs. current cost); iii) different countries and companies may report differently (e.g., balance sheets may be consolidated or unconsolidated). In order to control for these differences, we run our regressions (1) and (2), including the dummy variable EU that is defined in Table 4, thus originating the following regressions:
LEVi = β0 + β1ROAi + β2CURi + β3ATi + β4SIZi + β5TBQi + β6FFi + β7EUi + Ɛi ( 1.1 )
LTLi = β0 + β1ROAi + β2CURi + β3ATi + β4SIZi + β5TBQi + β6FFi + β7EUi + Ɛi ( 2.1 )
From Table 13, we conclude that the dummy variable EU that is added to the two regression models is statistically significant, consequently allowing us to infer that European firms generally have lower leverage ratios (regression (1)) and a lower proportion of long-term debt to total debt (regression (2)), when compared to North American firms. Moreover, all the independent variables included in regression (1), now in the form of regression (1.1), are, for the first time, statistically significant. Hence, we are finally able to conclude that the asset tangibility is positively associated with the firms' leverage ratio, therefore confirming previous literature's expectations. The F-test leads us, once again, to a denial of the null hypothesis that all the coefficients are null, at a 1 per cent significance level, and the adjusted R square faces again an increase in value in both regressions.
Additionally, we run regressions (1) and (2) twice: once for the European firms in our winsorized sample; and another time for the North American firms in our winsorized sample. As Table 14 suggests, we verify significant differences when comparing the results obtained for European and North American firms in the two regressions. Starting with regression (1), we observe that both European and North American firms have, as statistically relevant, the variables return on assets (ROA), current ratio (CUR), Tobin's Q ratio (TBQ) and the dummy to identify family
28
firms (FF). However, only for the European firms is the variable size (SIZ) statistically significant and only for the North American firms is the coefficient for the variable asset tangibility ratio (AT) statistically significant.
The most important conclusions that we can take from regression (1) are: i) family firms present lower leverage ratios than non-family firms, both in Europe and North America; and ii) the negative association between the leverage ratio and ownership structure is more evident for North American firms than it is for European firms.
Additionally, we observe that: i) the negative association between the leverage ratio and the return on assets is relatively more intense for European firms than for North American firms; ii) on the contrary, the negative association between the leverage ratio and the current ratio is more visible for North American firms than it is for European; iii) only for European firms, we can conclude that bigger firms tend to be more leveraged, as we expected (Section 2.2.4); and iv) only for North American firms, we can conclude that firms with higher asset tangibility tend to present lower leverage ratios, contrarily to what we expected (Section 2.2.4). Moreover, the same conclusions are obtained when taking the F-test for both samples. The adjusted R square, however, presents a higher value for European firms than for North American.
Looking now to regression (2), we verify that both European and North American winsorized samples present, as statistically significant variables, the current ratio (CUR), asset tangibility ratio (AT) and the dummy used to identify the family firms (FF). Nonetheless, we observe that the variable size (SIZ) is only statistically significant for the European firms within our winsorized sample.
Following from this, we emphasize the following conclusions: i) family firms present lower long-term leverage ratios than non-family firms, both in Europe and North America; and ii) the negative association between the leverage ratio and the ownership structure is more significant for North American firms than it is for European firms.
Furthermore, we observe the following: i) the association between the long-term debt to total debt ratio and the current ratio (CUR) is more significantly positive for European firms than it is for North American firms; ii) the same occurs with the asset tangibility ratio (AT); and iii) only for European firms, we can conclude that size is positively associated to the proportion of
long-29
term debt to total debt that firms use. Once again, the same conclusions are obtained when taking the F-test for both samples. The adjusted R square presents a much higher value for North American firms, of 73.5 per cent, than for European firms, for which it is only 42 per cent. In order to evaluate the impact of such an intense crisis as it was the financial one in 2008, we include two dummy variables, PREFC and POSFC, as defined in Table 4, in regressions (1) and
(2). In order to confirm how the financial crisis influences our sample results, we run the two regressions, which take the form of:
LEVi = β0 + β1ROAi + β2CURi + β3ATi + β4SIZi + β5TBQi + β6FFi + β7PREFCi + β8POSFCi + Ɛi
( 1.2 )
LTLi = β0 + β1ROAi + β2CURi + β3ATi + β4SIZi + β5TBQi + β6FFi + β7PREFCi + β8POSFCi + Ɛi
( 2.2 )
As we observe in Table 15, the inclusion of the two dummy variables PREFC and POSFC does not
add value to our regression models, since the variables prove to be statistically insignificant. Moreover, we try to evaluate potential differences between the sub-period before the financial crisis, the sub-period during which the crisis occurs and the sub-period after the crisis. For that manner, we run the regressions (1) and (2) three times: i) at first, for the sub-period 2005-2007; ii) secondly, for the sub-period 2008-2010; and finally iii) for the sub-period 2011-2013. The results of the six regressions are presented in Table 16.
Regarding the regression (1), we can see that only for the sub-period 2005-2007 we confirm Hypothesis 1: we verify that the relationship between ownership structure and leverage ratio is negative. For the remaining sub-periods, 2008-2010 and 2011-2013, we cannot confirm nor reject Hypothesis 1, because the dummy variable family firms, FF, is solely statistically significant for the sub-period 2005-2007. Nevertheless, the same does not happen with regression (2). In this regression, the dummy variable FF is statistically significant for the three sub-periods. Consequently, we verify that family firms tend to present lower proportion of long-term debt to total debt, compared to non-family firms. This leads us to the rejection of our Hypothesis 2 in our three sub-periods.
30
In terms of firm characteristics, we verify that, in regression (1), the variable size (SIZ) is never statistically significant for any of the three separate sub-periods, even though it was statistically significant for our entire period of analysis, 2005-2013. Contrarily to what occurs when we run regression (1) for the overall winsorized sample, we observe that the variable asset tangibility ratio (AT) is now statistically significant for the sub-period 2005-2007, proving a positive association between this ratio and the leverage ratio of firms, as we suspected (Section 2.2.4), but uniquely during that same sub-period. Only for the sub-periods 2005-2007 and 2008-2010, the Tobin's Q ratio (TBQ) seems to be negatively linked to the leverage ratio of firms. In the sub-period 2011-2013, we cannot prove any association given that the variable is not statistically significant. Both the variables return on assets (ROA) and current ratio (CUR) maintain their negative associations to the leverage ratio in the overall period of analysis, 2005-2013. At last, the adjusted R square is highest for the sub-period 2011-2013 and lowest for the sub-period during which the crisis occurs, 2008-2010.
Regarding regression (2), the F-test also rejects the null hypothesis for all the sub-periods considered. However, the same regression only presents, as statistically significant, all the independent variables for the sub-period 2005-2007. Even though, the variables return on assets (ROA), as expected (Section 2.2.4) and Tobin's Q ratio (TBQ), contrarily to what was expected, are only statistically significant for the sub-period 2005-2007. Therefore, we can only verify a negative association between the leverage ratio and the return on assets and a positive association between the leverage ratio and the Tobin's Q ratio during this sub-period. The remaining independent variables maintain their relationships with the proportion of long-term debt to total debt as they have when we run regression (2) for the overall winsorized sample (Table 11). The adjusted R square is, in this case, highest for the sub-period during which the crisis occurs, 2008-2010, and lowest for 2005-2007.
31
6.
Conclusions
The present empirical study is based on a list of 194 firms, of which 62 are family-owned businesses and 132 are non-family owned businesses. In order to be classified as family businesses, firms have to meet the following criteria: i) at least one representative of the family or kin had to be involved in the governance of the company; ii) publicly-listed companies had to meet the definition of family enterprise, which is that the person who established or acquired the firm, or their families and descendants, possessed 25 per cent of the decision-making rights mandated by their share capital; and iii) the share capital controlled by the family had to be, at least, in the second generation or beyond. The choice of the respective non-family peers considers the: i) business sector; ii) company's region of domicile; iii) market capitalization; iv) total assets; v) gross profits; vi) revenues; and vii) sales to total assets ratio.
The sample's descriptive statistics lets us observe a tendency for non-family firms to rely on the same amount of leverage as their family peers, on average, and to rely more on long-term debt than them - the difference is of approximately 50 percentage points, on average.
Our regression models confirm this tendency for non-family firms to rely more on long-term debt than their family peers. Further, we observed that non-family firms tend to present higher leverage ratios compared to their family peers, other things controlled for. The first conclusion corresponds to the rejection of Hypothesis 2 and the second conclusion to the confirmation of Hypothesis 1.
Regarding the relationship between the leverage ratio and the firm characteristics, which is approached by regression (1), we conclude that: i) more profitable firms tend to be less leveraged; ii) more liquid firms tend to be less leveraged; iii) bigger firms tend to be more leveraged; and iv) firms tend to be less leveraged as they face more opportunities to grow.
Considering the relationship between the proportion of long-term debt to total debt and the firm characteristics, we verify that: i) more liquid firms tend to have more long-term leverage in proportion to total debt; ii) more tangible firms tend to have lower long-term leverage ratios; iii) bigger firms tend to have lower term leverage ratios; and iv) firms tend to have lower long-term debt, in proportion to total debt, as they face more opportunities to grow.
32
In terms of robustness, we run the following regressions: i) regressions (1) and (2) for the winsorized sample; ii) regressions (1) and (2) for the winsorized sample excluding firms in the financial, insurance and utilities sectors; iii) regressions (1) and (2) for the winsorized sample, with the inclusion of a dummy variable EU which aims to classify firms as European or North American; iv) regressions (1) and (2) for the winsorized sample of European firms; v) regressions (1) and (2) for the winsorized sample of North American firms; vi) regressions (1) and (2), for the sub-period 2005-2007; vii) regressions (1) and (2), for the sub-period 2008-2010; viii) regressions (1) and (2), for the sub-period 2011-2013; ix) regressions (1) and (2) for the winsorized sample, with the inclusion of two dummy variables PREFC and POSFC which aims to
classify the year during which the observation occurs as pre-financial crisis and post-financial crisis.
Our robustness results allow the confirmation of the following: i) considering the winsorized sample instead of the original sample, we verify that Hypothesis 1 continues to be verified and Hypothesis 2 continues to be denied for both samples, although some firm characteristics may present stronger associations in one or the other sample of firms; ii) when running regressions (1) and (2) without the financial, insurance and utilities companies, we face no significant changes in the results; iii) when including the dummy variable EU in regressions (1) and (2), we conclude that the dummy is statistically significant in both regressions and that European firms generally tend to have lower leverage ratios - regression (1) - and lower long-term debt - regression (2) - than do North American firms; iv) when running regressions (1) and (2) separately for the European and North American firms, we verify that Hypothesis 1 continues to be verified and Hypothesis 2 continues to be denied for both samples, although some firm characteristics may present stronger associations in one or the other sample of firms; v) the inclusion of the two dummy variables PREFC and POSFC does not add value to our regression models, since the
variables prove to be statistically insignificant; vi) when running regressions (1) and (2) for the different sub-periods, we conclude that Hypothesis 1 is only verified for the sub-period 2005-2007, contrarily to Hypothesis 2 which is rejected in the three sub-periods.
33
7. Limitations
It is important to note that since that we are considering the largest firms of North America and Europe, it is expected that these firms have an easier access to debt than would smaller, less established firms. As suggestions for further research, we would advise the inclusion of companies of small and medium sizes as a manner to cater for these differences in terms of access to debt. As it was previously referred, we could not include firms of smaller dimension, given that this would require a much longer and more demanding work to collect detailed information on the ownership of the firms. Questionnaires would have to be sent out. Additionally, many small family firms are not audited therefore leading to difficulties in the validation of financial data.
Furthermore, another crisis, besides the 2008 financial crisis, occurred during our period of analysis and perhaps had important repercussions in the companies of our sample, especially in the ones located in Euro zone countries. This was the European sovereign debt crisis, whose beginning was in late 2009. The crisis was not included in the scope of the present dissertation, since that its inclusion would create two drastically different periods, the period before the crisis and the period during which the crisis occurred.
34
8. Tables
Table 1: Sample analyzed per ownership structure
This table presents the number of firms analyzed per ownership structure: family firms and non-family firms, together with the overall number of firms.
Family firms Non-family firms All firms
Description # Obs. # Obs. # Obs.
Total 62 132 194
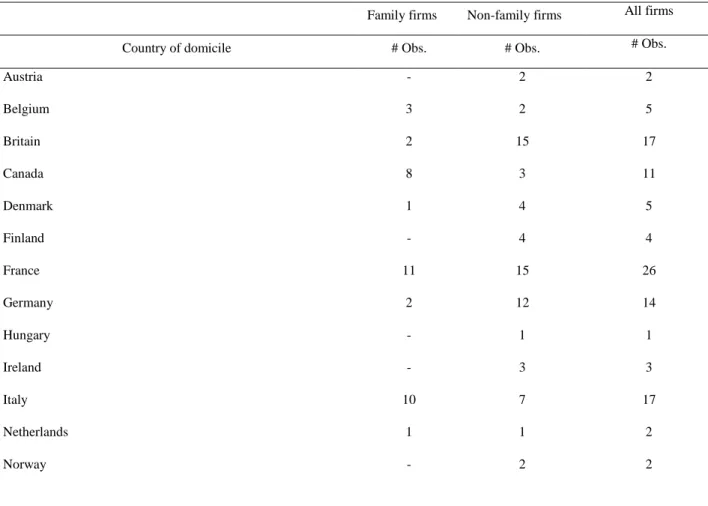
Table 2: Sample analyzed per country of domicile
This table presents the number of firms analyzed per company's country of domicile, divided between family and non-family firms and aggregated.
Family firms Non-family firms All firms
Country of domicile # Obs. # Obs. # Obs.
Austria - 2 2 Belgium 3 2 5 Britain 2 15 17 Canada 8 3 11 Denmark 1 4 5 Finland - 4 4 France 11 15 26 Germany 2 12 14 Hungary - 1 1 Ireland - 3 3 Italy 10 7 17 Netherlands 1 1 2 Norway - 2 2
35
Table 3: Dependent variables analyzed
This table contains the dependent variables that we study in this dissertation.
Poland - 1 1 Portugal 1 2 3 Romania 0 1 1 Spain 4 7 11 Sweden - 7 7 Switzerland 4 2 6 Turkey 2 1 3 United States 13 40 53 Total 62 132 194 North America 21 43 64 Europe 41 89 130 Total 62 132 194
Description Representation Formula
Leverage LEV Book value of debt divided by book value of total assets
36
Table 4: Independent variables analyzed
This table contains the independent variables that we study in this dissertation.
Description Representation Formula
Return on assets ROA Net income divided by book value of total assets
Cash ratio CAR Cash and cash equivalents divided by current liabilities
Current ratio CUR Current assets divided by current liabilities
Asset tangibility AT Book value of tangible assets divided by book value of total assets
Size SIZ Natural logarithm of total assets
Tobin's Q TBQ
Sum of market value of equity and book value of debt divided by the sum of book value of equity and book value of debt
Dummy FF FF Value of 1 if the firm is a family firm and value of 0 otherwise
Dummy EU EU Value of 1 if the firm is European and value of 0 otherwise
Dummy FIN FIN
Value of 1 if the firm is in the finance or insurance sector and value of 0 otherwise
Dummy UTI UTI Value of 1 if the firm is in the utilities sector and value of 0 otherwise
Dummy PREFC PREFC
Value of 1 if the year analyzed corresponds to the period before the financial crisis (2005-2007) and value of 0 otherwise
Dummy POSFC POSFC
Value of 1 if the year analyzed corresponds to the period after the financial crisis (2011-2013) and value of 0 otherwise
37
Table 5: Sample analyzed per business sector
This table presents the number of firms analyzed per business sector, divided between family and non-family firm and aggregated.
Family firms Non-family firms All firms
Business sector # Obs. # Obs. # Obs.
Automobiles & Components 6 10 16
Capital Goods 5 12 17
Commercial and Professional Services 1 - 1
Consumer Durables & Apparel 5 12 17
Consumer Services 1 2 3
Diversified Financials 2 4 6
Energy 1 4 5
Food & Staples Retailing 5 8 13
Food Beverage & Tobacco 9 21 30
Health Care Equipment and Services 1 3 4
Home & Office Products 2 - 2
Household & Personal Products 2 5 7
Materials 6 14 20
Media 6 14 20
Pharmaceuticals, Biotechnology 2 5 7
Retailing 3 9 12
Semiconductors & Semiconductor 1 3 4
Telecommunication Services 1 2 3
Transportation 2 4 6
Utilities 1 - 1