Terrorism and its impact on hospitality industry patterns : a data mining approach
115
0
0
Texto
(2) AUTHORSHIP STATEMENT The undersigned Pedro Ramos, a student at the University of Ljubljana, Faculty of Economics, (hereinafter: FELU), author of this written final work of studies with the title Terrorism and Its Impact on Hospitality Industry Patterns: A Data Mining Approach, prepared under supervision of Jurij Jaklič, PhD and co-supervision of Roberto Henriques, PhD, DECLARE 1. this written final work of studies to be based on the results of my own research; 2. the printed form of this written final work of studies to be identical to its electronic form; 3. the text of this written final work of studies to be language-edited and technically in adherence with the FELU’s Technical Guidelines for Written Works, which means that I cited and / or quoted works and opinions of other authors in this written final work of studies in accordance with the FELU’s Technical Guidelines for Written Works; 4. to be aware of the fact that plagiarism (in written or graphical form) is a criminal offence and can be prosecuted in accordance with the Criminal Code of the Republic of Slovenia; 5. to be aware of the consequences a proven plagiarism charge based on the this written final work could have for my status at the FELU in accordance with the relevant FELU Rules; 6. to have obtained all the necessary permits to use the data and works of other authors which are (in written or graphical form) referred to in this written final work of studies and to have clearly marked them; 7. to have acted in accordance with ethical principles during the preparation of this written final work of studies and to have, where necessary, obtained permission of the Ethics Committee; 8. my consent to use the electronic form of this written final work of studies for the detection of content similarity with other written works, using similarity detection software that is connected with the FELU Study Information System; 9. to transfer to the University of Ljubljana free of charge, non-exclusively, geographically and time-wise unlimited the right of saving this written final work of studies in the electronic form, the right of its reproduction, as well as the right of making this written final work of studies available to the public on the World Wide Web via the Repository of the University of Ljubljana; 10. my consent to publication of my personal data that are included in this written final work of studies and in this declaration, when this written final work of studies is published. Ljubljana, May 15th, 2018. Author’s signature: _________________________.
(3) TABLE OF CONTENTS INTRODUCTION .......................................................................................................................... 1 1 THEORETICAL FRAMEWORK ............................................................................................. 4 1.1 Bibliographic Analysis ........................................................................................................... 4 1.2 Terrorism Framework............................................................................................................. 6 1.2.1 Defining Terrorism .......................................................................................................... 6 1.2.2 Brief History of Modern Terrorism .................................................................................. 7 1.2.3 Terrorism in the Twenty-First Century............................................................................. 8 1.2.4 Risk Perception and Terrorist Threat Awareness .............................................................. 9 1.2.5 The Economic Impact of Terrorism ............................................................................... 10 1.3 Tourism Economics Framework ........................................................................................... 11 1.3.1 Defining Tourism .......................................................................................................... 11 1.3.2 The Importance of a Statistical Definition of Tourist...................................................... 12 1.4 Data Mining Framework....................................................................................................... 14 1.4.1 Definition of Cluster Analysis........................................................................................ 15 1.4.2 Proposing a Framework for Cluster Analysis ................................................................. 15 1.4.3 Cluster Methods and Algorithms.................................................................................... 16 1.4.4 Cluster Validity and Evaluation Criteria......................................................................... 20 1.4.5 Longitudinal Data Clustering Methods........................................................................... 25 1.4.6 Text Clustering Methods and Algorithms....................................................................... 27 2 DATA COLLECTION AND PREPARATION ....................................................................... 29 2.1 Terrorism Data: Global Terrorism Database ......................................................................... 29 2.1.1 Origin and Purpose ........................................................................................................ 29 2.1.2 Data Collection: Methodology and Limitations .............................................................. 30 2.1.3 Metadata and Data Cleansing Codebook ........................................................................ 31 2.2 Tourism Data – World Tourism Indicators............................................................................ 36 2.2.1 Origin and Purpose ........................................................................................................ 37 2.2.2 Data collection: Methodology and limitations ................................................................ 38 2.2.3 Metadata and Data Cleansing Codebook ........................................................................ 40 2.3 Unifying Data Sources.......................................................................................................... 41 3 EXPLORATORY ANALYSIS ................................................................................................. 46 3.1 Feature Selection .................................................................................................................. 47 3.2 Cluster Analysis ................................................................................................................... 50 3.2.1 Country-aggregated Cluster Analysis ............................................................................. 50 3.2.2 “Pooled” Dataset Cluster Analysis ................................................................................. 56 3.3.3 Longitudinal Dataset Cluster Analysis ........................................................................... 58 4 RESULTS DISCUSSION.......................................................................................................... 60 CONCLUSION ............................................................................................................................ 67 REFERENCE LIST ..................................................................................................................... 69 APPENDIXES. i.
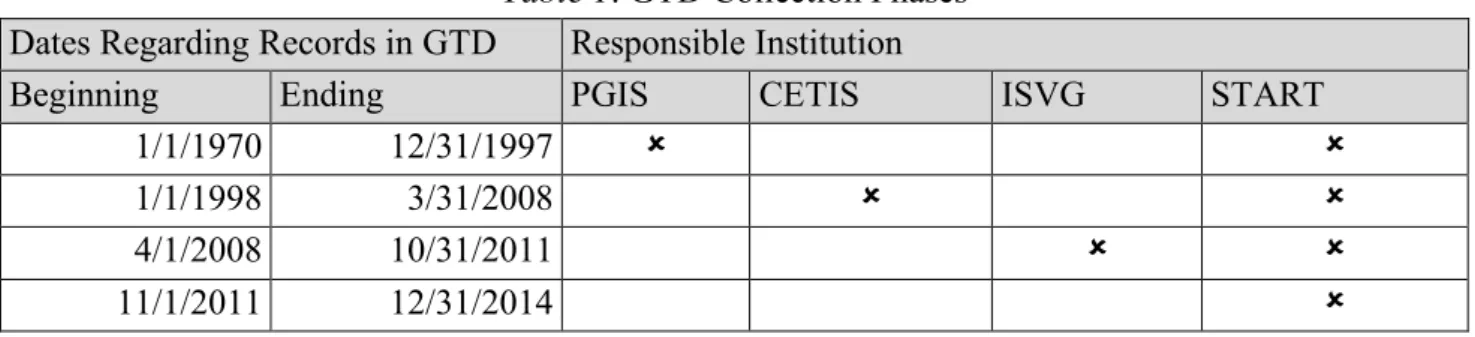
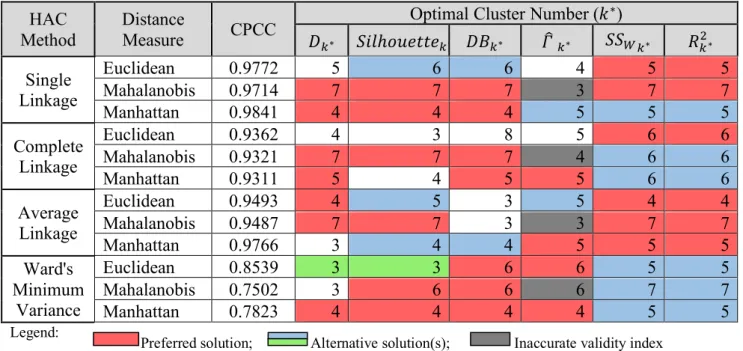
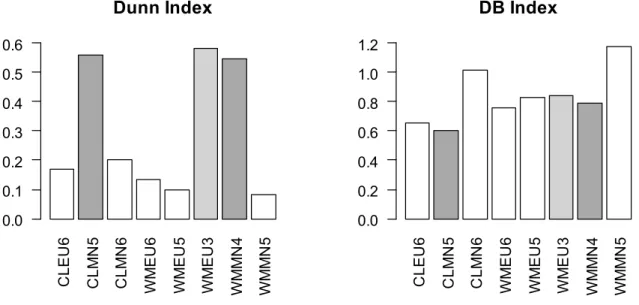
(4) LIST OF TABLES Table 1. GTD Collection Phases .................................................................................................... 29 Table 2. Political Changes in Europe ............................................................................................. 33 Table 3. Terrorism Dataset: Attributes and Metadata Summary ..................................................... 36 Table 4. World Development Indicators......................................................................................... 37 Table 5. World Development Indicators: Data Cleansing ............................................................... 41 Table 6. Merged Dataset: Countries/Region Breakdown ................................................................ 42 Table 7. Terrorism Geographical Distribution: Region Aggregates (1970-2014) ............................ 43 Table 8. Terrorism Geographic Distribution: Region Aggregates (1995-2014) ............................... 45 Table 9. Cross-correlation Analysis ............................................................................................... 49 Table 10. Optimal Partition Schemes per HAC Method and Distance Measure Employed ............ 53 Table 11. Cluster Country List: PAMEU4 ..................................................................................... 62 Table 12. Cluster Country List: PAMMN6 .................................................................................... 63 Table 13. Cluster Country List: LDKM4........................................................................................ 65 LIST OF FIGURES Figure 1. Initial Bibliographic Network ........................................................................................... 5 Figure 2. Refined Bibliographic Network ........................................................................................ 5 Figure 3. The Traveler and Visitor Concepts .................................................................................. 13 Figure 4. Typical Cluster Analysis Workflow ................................................................................ 15 Figure 5. Cluster Similarity Notions in HAC ................................................................................. 19 Figure 6. Terrorism Geographic Distribution: Included Attacks ..................................................... 44 Figure 7. Terrorism Geographic Distribution: Excluded Attacks .................................................... 44 Figure 8. The Impact of the Dataset Merging Process: Countries per Region ................................. 46 Figure 9. Aggregated Dataset: HAC Solutions (Compactness versus Separation) ........................... 54 Figure 10. Aggregated Dataset: Partitioning Solutions (Compactness versus Separation) ............... 56 Figure 11. Evaluation of PAM for Pooled Dataset: Compactness, Separation and Classification ... 57 Figure 12. Longitudinal Data Clustering: Validity Criterion (Calinski-Harabatz) ........................... 59 Figure 13. Cluster Solution Overview: PAMEU4........................................................................... 61 Figure 14. Cluster Solution Overview: PAMMN6 ......................................................................... 63 Figure 15. Cluster Solution Overview: LDKM4 ............................................................................. 64 Figure 16. Final Solution: Geographic Overview ........................................................................... 65. ii.
(5) INTRODUCTION Terrorism is commonly described as a strategy embraced by an extensive variety of ideologists and for a similarly extensive variety of political purposes (Cronin, 2002; Drake, 1998; Hoffman, 2006; Reich, 1998; Rubin, 1989). It is not indispensably connected to any ideology, belief or religion even though these can be potential reasons to trigger terrorist attacks. The choice for this strategy is empirically related to the potential ability of the strategy to successfully attain the perpetrator’s objective. Eradicating terrorism is far from being a simple task. Before eliminating terrorism, is crucial to de-legitimize terrorism at a global level. For such de-legitimization process to occur, it is fundamental to disprove the ‘false sociologies’ advanced as milestones for backing-off terrorism, exhibiting their foundation on fallacious or deceptive reasoning (Schmid, 2013). The growing pace and reach of technology, particularly social media, brought terrorism to the spotlight as internet and social networks became vehicles for news spreading and raising awareness for such events, playing a crucial role in both educating but also deceiving publics: mass media was at first a useful communication tool to spread alerts and inform endangered, threatened communities. On the other hand, and through means of misleading information, spreading sentiments like fear and panic, that might evolve into a violence snowball effect. The success of terroristic activities, from the perpetrators’ worldview, may not be measured by the same criteria that are held by steady societies and state systems. It is important to notice that terrorism is not always completely aimed to a specific target, permanently impacting several publics at once, even individuals who acknowledge or spread the underlying ideologies leading such attacks. Such victims might be accidental or collateral damages from the terrorist practices, but usually they are affected as part of high potential plans carried out by the attack perpetrators. Simply put, and intuitively, the more severe are the damages (casualties, injuries, property damage, etc.) accounted for an attack, the higher its social impact and thus its success from the perpetrators perspective. Although, this hypothesis is not always valid as some authors have been investigating, terrorist attacks of different magnitude and heinousness are considered to impact distinct publics in different manners. It is a fact that violencerelated events affect societies and countries development and growth in multiple fields – economies are impacted by wars and continued crime scenes, cultures are oppressed, demographic pyramids might get skewed and several other areas are vulnerable to such events. Even presenting quite insignificant number of casualties and damages estimate when compared to military warfare or other (natural) catastrophes that occurred in the past, terrorist attacks are still a class of events that impact several industries, markets and economies. One of the economic areas that has been suffering the most from terrorism impact during the last decades is the tourism (and the whole hospitality industry). As the awareness for the terrorist threat is becoming more and more present on the quotidian life from the peoples of many countries around the globe, travelers and tourists develop their risk perception mindset by processing information disseminated by official (e.g., travel alerts and warnings from governmental institutions such as the U.S. Department of State) and non-official sources (e.g., generalist media or social media). The growing perception of the terrorism threat mostly dues to the magnitude of the attacks – in terms of casualties and destruction – but also to the. 1.
(6) frequency of the occurrences and to the press covering on the aftermath of terrorist attacks, given the reach that mass media has been acquiring in the last few decades. These reasons are just some of the factors that prompt changes in tourists’ travel intention, often affecting their travel agenda convenience and, most likely, causing financial harm. Considering travelers as being customers in the context the hospitality industry, that same prejudice spreads throughout the several chained businesses, producing impacts of different levels on a bullwhip effect that can generate severe tourism crises. Examples are usually hotels and resorts, airline companies, travel agencies and general tourist attractions. Abadie and Gardeazabal (2003), Blomberg, Hess and Orphanides (2004) , Frey, Luechinger and Stutzer (2007) and a variety of other authors (with further mention in this written work) employ different data analysis techniques into studying the macroeconomic impacts of terrorism. Also a variety of authors engage on the impact of terrorism in financial markets and how terrorism impacts stock returns. Burch, Emery and Fuerst (2003), Chen and Siems (2004), Karolyi and Martel (2010) focused the scope of their studies into the reaction of stock markets to different periods of terrorist activity. Carter and Simkins (2004) and Drakos (2004), specifically study the effects of terrorism over the price of stocks from hospitality-related companies, in particular airlines as those are clearly one of the first business types to suffer immediate – but also long term – effects of terrorism and similar conflicts. However those studies are connected to the topic hereby addressed, there was very little research done in terms of applying data mining techniqies – and especially cluster analysis – to provide better understanding of the relationship between terrorism and tourism in different countries. That said, this study is somehow a pioneer of its kind, mostly when considering the vast work done in terms of data pre-processing and visualization. The purpose of this thesis is to combine several descriptive data mining techniques to identify similarities between a set of countries according to the nature of their hospitality industry and the unavoidable occurrence of terrorist activity over time. The ultimate goal of this written work is to collect, prepare and make an exploratory work of two-fold kinds of data: the previous pertains to terrorist events; the second belongs to the specific hospitality industries from the countries under the scope of the study, describing facts like tourist (and travelers) arrivals for the different existing segments. The second goal of this research work is to identify which countries are of high relevance for the analysis by understanding existing patterns of terrorist activity, both regarding geographies and nature of the event. Descriptive data mining techniques such as cluster analysis are used to investigate and group countries presenting similarities both regarding their hospitality industries but also the existing terroristic activity registered in their territory. The consistent combination of such databases generates well-structured sets of data that can be employed in further studies as sample for testing empirical models for studying the impact of terrorism over tourism and economics in different country groups. In addition, the methodologies employed in this research allow for easy replicability when feeding the algorithms with more structured and complete initial datasets. One clear example of a further application of this methodology is to explore how terrorist attacks in different cities within a country affect the inflow of tourist for that same country. 2.
(7) Before defining the methodology to be carried out, it is important to understand what kinds of data are available and their properties regarding the quality for achieving the purpose of this research work. Therefore, the data to be used is divided into two groups: the terrorism event data and the hospitality industry-related data. The former is extracted from the Global Terrorism Database (hereinafter: GTD), a comprehensive database of more than hundred thousand terrorism events that occurred between 1970 and 2014. This database comprises qualitative and quantitative data to describe each attack from where it is important to highlight certain attributes as described in Section 2. The second kind of data, about the hospitality industry, it is a compilation of indicators from arrivals and revenues from tourism from a large set of countries at the global level. Such dataset results from a laborious data examination and manipulation work to overcome certain constraints and inconsistencies from the data sources at the collection stage. The choice of variables at use is based both on the sources available but also on the extension of the previous researches supporting this approach. Within the critical literature, several ways of estimating the economic impact of a certain phenomenon namely terrorism were identified. Previous research works focused on the financial and stock markets response to terrorism, both for general and specific industries, such the hospitality and tourism. The present research follows a different scope by focusing mostly on detailed data from terrorist activity, exposing relationships with tourist arrivals data, collected for the respective periods as the existing data from GTD. The methodology selected to carry out this research project consists into the application of the previously stated data mining techniques, focusing over descriptive methods to perform an exploratory analysis that aims to enrich the knowledge from the data that is combined and prepared in previous stages. The remainder of this written work has five primary sections. Section 1 (Theoretical Framework) is dedicated to present the relevant literature identified during the bibliographic research phase, enabling the establishment of a theoretical background to support discussions considered to be pertinent along with the scope of the research problem(s) here addressed. Additionally, and before introducing the theoretical framework itself - where definitions and proven empirical results are presented – this section embeds a preliminary subset designed to illustrate the methodology carried out during the scientific literature analysis stage. Section 2 (Data Collection and Preparation) describes the data used as input for the statistical analysis carried out while approaching the research problem. Here all the collected data are described regarding its characteristics regarding the collection process and all inherent assumptions that are crucial to anticipate prior to any further analytical steps, such as the data preparation stage. Section 3 (Exploratory Analysis) embeds the application of descriptive data mining techniques, such as cluster analysis, to provide a clearer understanding of the data at use, enabling a simplifying description of the dataset at a lower complexity level. Section 4 (Results Discussion) presents and compares the solutions from various clustering analysis approaches employed, providing meaningful interpretation of such solutions in the context of describing how tourism and terrorism are connected for the geographical and temporal timeframes in analysis.. 3.
(8) 1 THEORETICAL FRAMEWORK The objective of this initial section is to provide the reader with relevant concepts and insights that are vital regarding the purpose of the thesis. Here the main definitions are presented and examined in accordance with prior research works carried out within the various fields covered in this thesis.. 1.1 Bibliographic Analysis To brace for the study of a given socio-economic phenomenon, it is crucial to examine prior scientific research works to have a clear understanding of the documented knowledge available for use in the purposed exploration. In the case of this written work, when studying terrorism patterns and their impacts in the hospitality industry, there is an ample variety of literature that addresses this topic in broader terms. It is important to notice that, although most of the sources addressed in this master thesis are generally concerned to terrorist events, some of them points into different directions, presenting different purposes, goals, methodologies and hence, results. This subsection is meant for providing an overview of the bibliographic research process and the methods selected for carrying it out. This research work relies on a set of scientific articles and textbooks concerned to the study of terrorism as a global phenomenon, the socioeconomic study of terrorism, tourist crisis management (those of terroristic related nature), etc. In the other hand, there is the need to browse through sources of more technical knowledge to identify appropriate research methodologies: those methods are essentially of statistical nature, with special emphasis on exploratory and descriptive methods, especially data mining techniques such as several methods for performing cluster analysis. If on one hand combining all those terms keywords for the purpose of literature research produces a scarce amount of relevant results (perhaps due to the novelty of the research question), on the other hand when searching each keyword separately, the amount of materials found is too broad for a single researcher to analyze through human inspection. The importance of understanding the quality and reliability of such resources dictated the implementation of a social network analysis of nearly 1,500 articles. Such articles relate to each other through means of citation of authors work that motivated each specific article in first place. The following analysis is obtained by first collect a list of potentially relevant articles together with the respective citations mapped out in Web of Science platform (see http://www.webofscience.com). Citation data is pre-processed by using HAMMER, a web-based server for automating the network analysis interface for literature studies scripts, providing the user with the tables that represent the nodes and the ones that represent the edges, also a set of relevant summary statistics regarding the results found; as a final step, the aforementioned tables are used to design the graph network (with resource to Gephi), that is then filtered in terms of in-degree metric. It is expectable that the most reliable articles that can potentially add superior quality and relevance to a new research project are those being cited more often among the scientific community. In the context of a directed social network, where nodes represent articles, and unidirectional edges represent citations, articles cited more often are said to have a higher in-degree, a centrality measure that counts the number of headends adjacent to a node (Biswal, 2013). 4.
(9) Figure 1. Initial Bibliographic Network. The strategy then used is to set up a certain bottom in-degree threshold, through the application of filters, to significantly reduce the dimension of the network capturing only articles that meet that criteria (at the time). In the particular case of this network, the initial 1,495 extracted articles pointed into 50,540 nodes, from which 64,259 connections arose (see Figure 1) due to the fact that each article cites a specific variety of sources, resulting in an exponential growth of the citations (edges) universe; when a citation is not common to other articles it originates a new node as well. To reduce the dimension of the resources universe, the minimum threshold for the in-degree was set up to 20 simplifying the network to only 101 nodes and 83 edges. Figure 2. Refined Bibliographic Network. 5.
(10) Also, to understand the relationships established within the simplified network, is possible to cluster the nodes into different modularity classes, identifying the community structure (Blondel, Guillaume, Lambiotte, & Lefebvre, 2008). By iteratively increasing the resolution limit of the modularity computed using Gephi, the lowest number of communities (or clusters) was of 47 different modularity classes. This complexity reduction (depicted above in Figure 2) enables a more efficient inspection of the bibliographic resources. Note that additional sources are then added through ad-hoc research of more specific topics upon need during further research phases to support assumptions that fall out of the scope of the bibliographic network analysis initially performed.. 1.2 Terrorism Framework This section presents the various resources that result from previous research works, dividing them into logically constructed and connected matters that are used as a basic support for the understanding of the terrorism phenomenon and its impacts both at a global and industry-level. 1.2.1 Defining Terrorism Despite the nonexistence of a universal consensus regarding the definition of terrorism, governments have been striving to accurately define these phenomena to enable the authorities responsible for law enforcement and homeland security to have a similar perception of the terrorist acts of different natures. It is crucial that those who are empowered to prevent and minimize the impact of terrorist events can agree in a definition that fully covers the main types of terrorism practices to develop and plan counter-terrorist strategies in effective and efficient manners, using similar criteria for acting upon them. From a simplistic point of view, terrorism is just a form of coercion using violence that goes far behind the achievement of a direct and immediate goal like in another kind of crime. “Without violence or its threat, terrorists cannot make a political decision maker respond to their demands. Moreover, in the absence of a political/social motive, a violent act is a crime rather than an act of terrorism.” (Enders & Sandler, 2012). In the absence of a consensual definition, there is the need to adopt – or combine – several existing definitions to best describe the terrorism phenomena. Although studies have found that there are more than two hundred definitions of terrorism, Schmid and Jongman, (2005) define terrorism as “an anxiety-inspiring method of repeated violent action, employed by (semi-)clandestine individual, group, or state actors, for idiosyncratic, criminal, or political reasons, whereby — in contrast to assassination — the direct targets of violence are not the main targets. The immediate human victims of violence are generally chosen randomly (targets of opportunity) or selectively (representative or symbolic targets) from a target population, and serve as message generators”. Nonetheless, the previous definition is supported on a wide theoretical background, resulting from the examination of over a hundred narrower definitions, it may be convenient for this written work to adopt the definition considered during the data collection process instead. That being said, terrorism is hereinafter defined as “the threatened or actual use of illegal force and violence by a non-state actor to attain a political, economic, religious, or social goal. 6.
(11) through fear, coercion, or intimidation." (National Consortium for the Study of Terrorism and Responses to Terrorism [START], 2016) 1.2.2 Brief History of Modern Terrorism Terrorism has been put into practice since more than two thousand years already, evolving overtimes and gaining different proportions and importance: one of the earliest recorded events was the Zealot struggle against the Roman occupation of Palestine during 66-73 A.D. (Laqueur, 1978). In spite of the elderliness of terrorism as guerrilla warfare practice, the use of the term “terrorism” arose from French terrorisme (from Latin terror) to describe the State of Terror (1793-1794), as an onset of the French Revolution, period when the post-radical government of France slaughtered the French aristocracy and associates (Primoratz, 2004). Some examples of the most noteworthy terrorist movements happening during modern and contemporary eras, are as follows, according to White (2001), Hoffman (2006) and Enders and Sandler (2012): •. •. •. •. •. •. •. the Russian anarchist faction Narodnaya Volya (hereinafter: People’s Will), active between 1878 and 1881, perpetrating the assassination of Czar Alexander II and becoming one of the most remarkable influences in the modern-day terrorism; also in Russia, Lenin and Trotsky led the Bolsheviks revolution of October 1917, using terrorist tactics such as bombings and assassinations to throw apart the Menshevik government, targeting their officials and its middle-class electorate; the Irish Republican Army (hereinafter: IRA), commanded by Michael Collins refined the terrorist tactics of People’s Will during Ireland’s 1919–1921 campaign to struggle for the independence from British control; from 1930, until the end of the century, the battle for Irish unification was coordinated by the IRA and the Provisional IRA (hereinafter: PIRA); in the Middle East, during the period of 1947–1948, and in order to attain the independence of Israel, two terrorist groups – Irgun Zvai Leumi and the Stern Gang – imported IRA bombing and assassination tactics targeting British occupants to emphasize the cost of denial Jewish demands for statehood, escalating their campaigns into urban guerrilla warfare and proving the effectiveness of urban terrorism; the Algerian rebellion against French regime between 1954 and 1962 was helmed by the Front de Libération Nationale (FLN), borrowing its methods from those of the Jewish terrorists in Palestine; similarly, from 1956 to 1959, Cypriot radicals followed the same methods, also inspired by the Jewish insurgents’ tactics successfully applied during the 1940s to struggle against the British dominance; the slaughter for the Irish unification expanded significantly in 1969, when the British armed force was conveyed to Northern Ireland, due to the developing PIRA's urban guerrilla fighting strategies, making the strikes against police and British troops seem arbitrary but persistent in Belfast, Londonderry, and other urban focuses in Northern Ireland; 7.
(12) •. •. •. the Tupamaros, active terrorist faction in Latin America (mostly in Uruguay) during 1968-1972 refined their urban guerilla methods by including kidnappings and bank robberies to fund their activities; founded in 1959 with the purpose of fighting for a sovereign Basque state ruling the autonomous Spanish region of Basque Country, the separatist group Euskadi Ta Askatasuna (Basque for “Basque Country and Freedom”, hereinafter: ETA) just adopted sizable terrorist attacks during the mid-1970s, having its bloodiest period during 1978–1980, totalizing 235 victims for that same period. Along with assassinations, and at a similarly growing pace, ETA perpetrated various fund-raising crimes such as kidnapping-for-ransom, coercion and, occasionally, assaults targeting Basque wealthy entrepreneurs, resulting in an exodus of those from the region, until the year of 2000, date when the group activity was officially ceased (Abadie & Gardeazabal, 2003); Lastly, a remarkable ongoing case, which emerged after the 1967 Arab-Israeli War is the resistance for a Palestinian state against the Israeli regime, undertaken by the Palestinian Liberation Organization (hereinafter: PLO) and respective dissident factions. These studied other aforementioned terrorist group terror-spreading techniques emphasizing the internationalization of their attacks to attain superior recognition for their cause against Israel, embracing a global struggle that shaped terrorism as it happens nowadays.. The assessment of the abovementioned timeline of remarkable continued terrorist campaigns, enabled Enders and Sandler (2012) to conclude empirically: 1. terrorists have been learning how to execute and enhance their techniques to achieve their immediate and – every so often, due to persistence – long-run goals, borrowing the knowledge of allied – or even rival – factions’ operations in seeking for more effective results; 2. terrorists manage to orchestrate their operations within metropolitan areas pursuing the accessible media covering, increasing the exposure of the attacks throughout the communication channels, and hence the wider spread of their message; 3. the steady increasing globalization of the terrorist activity from certain groups has been a successful strategy for capturing the world attention for their causes, spreading global fear and threat among potential target publics; 4. several are the cases of fortunate separatist movements that, due to the inaptitude of authorities to combat their campaigns, succeed to sustain a constituency, and thus becoming more likely to achieve their long-run goals. 1.2.3 Terrorism in the Twenty-First Century A new era was born for terrorism with the events on 11 September, 2001 (hereinafter: 9/11): the sequence of four airplane hijackings culminated in a worldwide unpreceded death toll in the context of transnational terrorism: roughly 3,000 lives were lost as a result of the attacks, exceeding the. 8.
(13) analogous number of deaths during the period of 1988-2000 (Sandler, 2003). The 9/11 attacks confirmed the conclusions above regarding the evolution of terrorist campaigns sophistication, particularly their search for media exposure and the internationalization of the tragedy. In fact, that was a day that changed the world, both for terrorists but for their targets as well. Some of the changes induced in the aftermath of 9/11 are as follows: •. •. •. since 9/11, innumerable businesses are not able to afford a terrorism coverage given the change of paradigm for insurance companies: according to Kunreuther, Michel-Kerjan and Porter (2003) and Kunreuther and Erwann (2004), roughly half of the associated losses ascending to $80 billion were covered by insurance institutions, which rapidly announced their unwillingness to provide coverage for terrorist-induced damages; suicidal terrorism was proven able to achieve maximal casualties, outstanding financial losses, and superior outspread panic by recurring to relatively low-budget plans and involving supposed inoffensive technologies; countries rapidly redesigned their homeland security enforcement strategies by reallocating resources from other areas of expenditure over additional measures to attain safety and combat terrorism in their own soil (Enders & Sandler, 2012). One of the most illustrative examples is the US Department of Homeland Security which benefited from successive budget reallocation over the upcoming years, dedicating roughly 60% of their expenditure to fight terrorism on US territory.. 1.2.4 Risk Perception and Terrorist Threat Awareness The perception of risk arising from the terrorist threat plays a fundamental role in the behavior of people as individuals and/or as part of groups within society. Several studies have been made to identify relationships between risk awareness and reaction to such risks, depending on several characteristics of individuals and the way risk situations are perceived. Roehl and Fesenmaier (1992) used cluster analysis to classify tourists into three - neutral, functional risk and place risk groups –according to the way they react to certain risk scenarios when traveling. Tourists classified as being neutrally risk takers have shown a surprisingly higher willingness to engage in riskier activities and destinations, however at the cost of more in-depth planning methods. Reisinger and Mavondo (2005) through means of a path analysis “intentions to travel internationally were determined by travel anxiety levels and level of perceived safety”, concluding that “terrorism and sociocultural risk emerged as the most significant predictors of travel anxiety”. Different individuals might perceive terrorist acts differently, which give perpetrators strong advantages towards the achievement of their goals, as attacks at random might spread more severe awareness of the terrorist imminent risk. As described by Enders and Sandler (2012) “terrorists broaden their audience beyond their immediate victims by making their actions appear to be random, so that everyone feels anxiety. In contrast to a drive-by shooting on a city street, terrorist acts are not random but well-planned and. 9.
(14) often well-executed attacks where the terrorists account for risks and associated costs as well as possible gains”. According to Chang and Zeng (2011) the hospitality industry is notably responsive to the occurrence of terrorist attacks and the risk perception from stakeholders in particular areas such as tourism. The major reasons the authors point out for justifying such fragility of this sector are three: •. •. •. for some people travelling and leisure are both superfluous expenditures, yet more when aligned with augmented fear and risk arising from terrorist activity – considering this proposition is expectable that risk adverse travelers retreat their travelling intentions or choose to travel to substitute destinations instead; given the dimension and spread of the hospitality industry, when addressing specific developing countries of high dependence on the tourism sector, any terrorist attack might understandably impact the broad economy since many industries profit on economies of scale created by tourism and travelling sectors; finally, since hotels have no ability to store capacity nor inventory, the incidence of terrorist episodes easily leads immediate effects that might be hard to flatten over time.. 1.2.5 The Economic Impact of Terrorism There are several previous studies that address the long-term macroeconomic effects of terrorism, most of them referring to cases of countries (or regions) under enduring conflicts. Abadie and Gardeazabal (2003) conclude that the Basque GDP substantially underperforms that of a similar synthetic region (in Spain) without continued terrorist attacks. Blomberg et al. (2004) note that terrorism has a negative impact on growth, especially in developing countries. Likewise, Frey et al. (2007) find that the net effects of terrorism impacts negatively the total utility and go far beyond losses of pure economic nature. Also a variety of authors engage on the impact of terrorism in financial markets and how terrorism impacts stock returns. Chen and Siems (2004) study the impact of fourteen terrorist and military attacks prior to 1915 on U.S. capital market, and the response of global capital market to later events such as the Iraq’s invasion of Kuwait, in 1990, and the 9/11 attacks to World Trade Center, concluding that in spite of the generality of stock market returns are negative, U.S. capital markets got more volatile in the later years recovering faster than other capital markets. This study corroborates the findings from Burch et al. (2003) showing that closed-end mutual discount funds aggravated seriously following the 9/11 attacks – indubitably as an echo of the negative sentiment-based response of investors – but consecutively recoverd apace with the broader market. Additionally, Karolyi and Martel (2010) investigate the most impactful seventy-five events occuring worldwide during the prior decade, noticing that terrorism “attacks in countries that are wealthier and more democratic are associated with larger negative share price reactions, and […] human capital losses, such as kidnappings of company executives, are associated with larger negative stock price reactions than physical losses, such as bombings of facilities or buildings.”. 10.
(15) The hospitality industry has often referred to terrorism as one of its biggest operating risks because a single isolated attack may affect interactions between customers and businesses, interrupting a whole previously scheduled logistic chain. Carter and Simkins (2004) scrutinize the 9/11 attacks finding extremely unusual and negative returns for airline stocks following the markets reopening on September 17th of that same year. Similarly, and according to Drakos (2004), it is also possible to verify this financial phenomenon given the abnormal increase of the volatility of the airline stocks in the post-9/11 era, predominantly due to increments in systematic risk. Looking through a slightly different scope, there is a variety of studies addressing the problematic of the terrorist attacks targeting tourists and tourism facilities. Richter and Waugh (1986) make an overview of a set of drivers that potentiate the apetite of terrorists on targeting tourists depending on the – direct and indirect – objectives terrorist organizations want to achieve which such actions. The problem hereby addressed is the fact that small work has been done regarding the impact of terrorist attacks over tourists from a descriptive data mining perspective.. 1.3 Tourism Economics Framework The present section aims to make use of literature resources to define milestone concepts regarding the tourist activity, enabling a clear understanding of the target object within the hospitality industry: tourists. 1.3.1 Defining Tourism Like terrorism, the concept of tourism caresses of a unique unanimous definition. Proposals have been made by authors and institutions, changing and adapting over the years to different realities, often varying across geographies and from each tourism stakeholders. McIntosh and Goeldner (1986) refer the four perspectives to take in consideration prior to present a tourism definition: • • • •. the tourist, an individual seeking “various psychic and physical experiences and satisfactions”; the hospitality industry, the group of “businesses providing tourism goods and services” in order to satisfy the tourist needs while generating wealth; the hosting government, presenting an important role in both regulating tourism as a business activity and tourism conflict management; the host community, resident people from tourist destinations playing both economic and cultural roles, respectively in terms of the labor force and source of cultural interaction between the local culture and the tourist, being a crucial public in order to attain the engagement of existing tourists and use their relative satisfaction to generate future tourism opportunities (e.g., through word-of-mouth, although this can also have negative effects on the tourist destination development).. 11.
(16) Additionally, Vanhove (2005) discern between “conceptual and statistical (operational or technical) definitions” of tourism identified in the literature. The first group addresses the tourism phenomenon from a higher abstraction level, broadly defining tourism as: •. the “sum of the phenomena and relationships arising from the travel and stay of non-residents, in so far as they do not lead to permanent residence and are not connected with any earning activity.” (Hunziker & Krapf, 1942); • a travel event consisting of the sum of five fundamental characteristics, according to Burkart and Medlik (1974): “tourism is an amalgam of phenomena and relationships rather than a single one […] these phenomena and relationships arise from a movement of people to, and a stay in, various destinations; there is a dynamic element (the journey) and a static element (the stay) […] the journey and stay are to and in destinations outside the normal place of residence and work, so that tourism gives rise to activities which are distinct from those of the resident and working populations of the places through which tourists travel and of their destinations […] the movement to the destinations is of a temporary, short-term character […] destinations are visited for purposes not connected to paid work – that is, not to take up employment”; • the “processes, activities, and outcomes arising from the relationships and the interactions among tourists, tourism suppliers, host governments, host communities, and surrounding environments that are involved in the attracting and hosting of visitors.” (McIntosh & Goeldner, 1986); • “one part of recreation which involves travel to a less familiar destination or community, for a short-term period, to satisfy a consumer need for one or a combination of activities.” (Gilbert, 1990). 1.3.2 The Importance of a Statistical Definition of Tourist Although the previously stated definitions provide quite an extensive characterization of the tourism phenomenon, it is important to reinforce the “need for exact definitions of tourism and the tourist (as an individual)” highlighted by Mieckzowski (1990) to enable superior quantitative measurements for statistical and operational purposes. One of the most common difficulties arising from the lack of a precise definition of tourist (and tourism) is the case of business travelers, usually included together as the remainder of the tourists, disregard of the purpose of the trip. To fulfil such conceptual breaches Burkart and Medlik (1974) suggest that a statistical definition of tourism must specifically cover the various travel and visit categories that are (and are not) included, outlining the time requirements regarding the duration of the stay in precise units, and finally identifying exceptions and special cases (e.g., transitory air passengers). There is a variety of statistical definitions that fulfill such requirements, characterizing not only tourists but a visitor in general. As a result of the United Nations Conference on Travel and Tourism (Rome, 1963), a suitable definition was agreed, defining visitor as “any person visiting a country other than that in which he has usual place of residence, for any reason other than following an occupation remunerated from within the. 12.
(17) country visited”. Additionally, the resulting definition defined boundaries for distinguishing between: •. •. tourists, defined as “temporary visitors staying at least 24 hours in the country visited and the purpose of whose journey can be classified under the headings of Economic characteristics of the tourism sector either leisure (recreation, holiday, health, study, religion, and sport) or business, family, mission, meeting”; and excursionists, defined as “temporary visitors staying less than 24 hours in the country visited (including air travelers on cruises)”.. Although this definition of visitor enables a more rigorous coverage of the different possible cases, there was a place for successive minor adjustments, as it is an example the replacement of the term “24 hours” length by “overnight” that, in spite of being a broader expression, allows the inclusion of overnight stays lasting for periods smaller than one complete day. Furthermore, and in order to create a superior limit for the possible stay of visitors, the International Network on Regional Economics, Mobility and Tourism (hereinafter: INRouTE) and the World Tourism Organization (hereinafter: UNWTO) reformulated the previous definition, considering a visitor as “a traveler taking a trip to a main destination outside his/her usual environment, for less than a year, for any main purpose (business, leisure or other personal purpose) other than to be employed by a resident entity in the country or place visited. A visitor (domestic, inbound or outbound) is classified as a tourist (or overnight visitor) if his/her trip includes an overnight stay, or as a same-day visitor (or excursionist) otherwise” (INRouTE & UNWTO, 2013). For a clearer understanding of the scope of this definition, Figure 3 breaks down the concept of (inbound) traveler and the underneath defined classes. Figure 3. The Traveler and Visitor Concepts. Source: Adapted after Department of Economic and Social Affairs, United Nations, International Recommendations for Tourism Statistics, 2008.. 13.
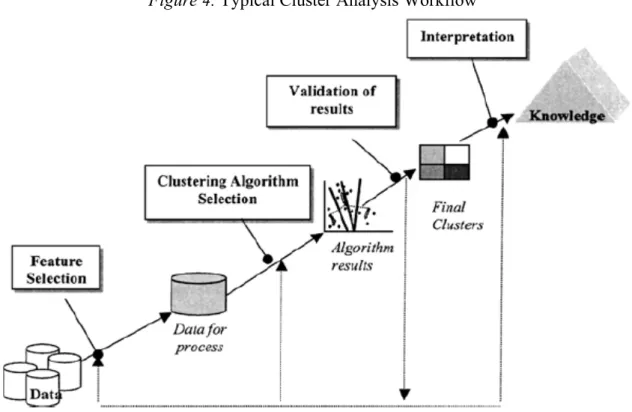
(18) According to the previously mentioned set of guidelines suggested by UNWTO, tourism must be perceived as containing three distinct kinds, partitioned as follows: 1. domestic tourism, including all the activities of resident visitors within the country of reference, either as part of a domestic tourism trip or part of an outbound tourism trip”; 2. inbound tourism, which encompasses the “activities of non-resident visitors within the country of reference on an inbound tourism trip”; 3. outbound tourism, comprehending the “activities of a resident visitor outside the country of reference, either as part of an outbound tourism trip or as part of a domestic tourism trip”. For the case of the present study, and given the nature of the data and respective limitations (see 2.2.2), only the inbound tourism figures are considered, leaving domestic and outbound tourism as opportunities for further studies.. 1.4 Data Mining Framework Han, Kamber and Pei (2012) define the term data mining as a “synonym for knowledge discovery from data”, a set of steps to undertake while taking valuable insights from an initial set of data (that can be the combination of data from several different sources). This knowledge discovery is described as a process including 5 major steps, as follows: 1. data cleansing and integration: eliminating existent noise and inconsistencies and merging data if numerous sources are identified; 2. data selection and transformation: identifying and fetching data considered as relevant for the research problem from the database (or data warehouse, if employed), transforming data through means of summary, reduction and/or aggregative procedures (when applicable, depending on the aim and precision of the analysis); 3. data mining: employing comprehensive statistical and machine learning methods to derive patterns and similarities on data; 4. pattern evaluation: identifying patterns of interest based the research scope and aimed knowledge, comparing them against predefined theoretical measurements; 5. knowledge presentation: employing visual representation techniques for the knowledge derived from the previously stated stages to attain concise understanding from final users. This section is meant to establish a broad framework to support the data mining related tasks addressed in the execution of the research work. The following subsections present specific knowledge from several fields of data mining and machine learning areas in application to clustering problems, supported by previous research works found upon bibliographic research.. 14.
(19) 1.4.1 Definition of Cluster Analysis A clustering problem is broadly defined in the literature as: •. •. •. the “unsupervised process of grouping data patterns into clusters so that patterns within a cluster bear strong similarity to one another but are very dissimilar to patterns in other clusters.” (Xiong & Yeung, 2002); to “identify structure in an unlabeled data set by objectively organizing data into homogeneous groups where the within-group-object similarity is minimized and the between-group-object dissimilarity is maximized.” (Liao, 2005); an “unsupervised learning task aimed to partition a set of unlabeled data objects into homogeneous groups or clusters (…) in such way that objects in the same cluster are more similar to each other than objects in different clusters according to some defined criterion.” (Montero & Vilar, 2014).. 1.4.2 Proposing a Framework for Cluster Analysis Defining clusters is not an exact science, rather than the application of computational and statistical techniques of different nature that provide different solutions. There are no right or wrong solutions for a clustering problem: from all the potential solutions to be encountered some are more “meaningful” in order to resolve a specific research question (Norušis, 2010). Figure 4. Typical Cluster Analysis Workflow. Source: Adapted after Halkidi., Batistakis and Vazirgiannis, On Clustering Validation Techniques, 2000.. 15.
(20) Cluster solutions can vary significantly among the constraints of the problem, depending upon the selection of clustering variables, the clustering procedure (i.e., the set of techniques involved) and the selected number of clusters. In fact, the selection of the variables to cluster is one of the main stages to attain a set of solutions of enhanced accuracy for the cluster problem solving. The above Figure 4 presents the main steps recommended by Halkidi, Batistakis and Vazirgiannis (2001) to perform while formalizing and resolving a cluster analysis problem. Following this methodology, it is crucial to have an extensive understanding of the data prior to employing any clustering task. 1.4.3 Cluster Methods and Algorithms The input data can be of various types, for which different algorithms apply, each one presenting its particular strengths and weaknesses from the perspective of the required inputs, computational complexity and results performance. Han and Kamber (2001) categorize the existent static data clustering methods into five main classes: partitioning, hierarchical, density-based, grid-based and model-based methods. A brief overview of the previously stated methods follows next, presenting their main features, advantages and limitations. 1.4.3.1 Partitioning Methods Considering a set of ! records of data, a partitioning method aims to divide the dataset into " partitions (with " ≤ !), each one representing a cluster containing at least one element. Although their straightforward implementation, Halkidi et al. (2001) denote partitioning clusters major shortcomings as they: • • • •. are “applicable mainly to numerical datasets”, although implementations such as the "-Modes algorithm have been purposed for handling categorical data; such methods are “unable to handle noise and outliers”; are limited in terms of “discover clusters with non-convex shapes”; often require aprioristic information regarding the number of partitions to obtain; such information might be ", number of clusters, or some other parameter (usually intimately linked to the number of clusters).. The employed partition might be crisp (in case each element strictly belongs to a single cluster) or fuzzy (in case elements are possible to be included within several clusters). Crips partitioning algorithms are often generically defined as 2. E = & & d(x, m, ), ,34 .∈01. 16. (1).
(21) where 56 is the representative of the cluster 76 , and 8(9, 56 ) is the distance measure between a point 9 and 56 . One of the most illustrious methods used to perform crisp partitions is k-Means algorithm. It relies on a quite simple clustering criteria: “to minimize the distance of the objects within a cluster from the representative point of this cluster” (Halkidi et al., 2001) where such representative is given by “the mean value of the elements within that cluster” (MacQueen, 1967). The second most popular method within the category of partitioning cluster methods is k-Medoids, popularized through implementation of the Partitioning Around Medoids (hereinafter: PAM) algorithm. PAM “minimizes a sum of dissimilarities instead of a sum of squared Euclidean distances” (allows for the use of an arbitrary non-Euclidean distance measure) for which “each cluster representative is the most centrally located object in a cluster.” (Kaufman & Rousseeuw, 1990). The same does not hold for k-Means (based on pairwise Euclidean distances between data points): in fact, implementations of k-Means using non-Euclidean distance measures do not span Euclidean space. The authors describe PAM as being more robust to the presence of noise and outliers than k-Means. However, PAM carries an important drawback since its associated computational cost is quite demanding. Although this issue is becoming less crucial given the improvements in terms of processing power, it is still a limitation when trying to scale it for large datasets (Salvador & Chan, 2004). Clustering for Large Applications (hereinafter, CLARA) is built on top of the same clustering criterion as PAM but it operates on samples of the data set, applying PAM throughout each one of those samples and returning the best partition as the final output. The fact that the iterations are performed over samples of the dataset allows for superior scalability than PAM. On the other hand, its performance depends on the sample size, producing results based on such samples and thus it leaves room for bias since “if a sample is biased, a good clustering based on samples will not necessarily represent a good clustering of the dataset.” (Halkidi et al., 2001). In order to overcome such shortcomings Ng and Jiawei Han (2002) suggest the use of CLARANS (often named Randomized CLARA), which randomly defines the subsets of the initial dataset to use as samples, mitigating bias through extending the search to wider areas of the dataset, and thus producing more consistent results. When considering alternatives to obtain fuzzy partitions, analogue methods, such as Fuzzy :-Means (Kaufman & Rousseeuw, 1990) and Fuzzy :-Medoids (Krishnapuram, Joshi, Nasraoui & Yi, 2001) are applicable. Although these are out of the scope of this research project (crisp partitions are preferred for the sake of simplicity) it is noteworthy to mention that these algorithms perform well under certain conditions such as searching for spherical-shaped clusters and while handling small/medium-sized sets of data.. 17.
(22) 1.4.3.2 Hierarchical Methods This class of methods is based in the premise of grouping elements into a tree of clusters, usually graphically represented through means of a dendrogram. Hierarchical clustering includes two general types of methods: •. •. agglomerative methods, with a starting point where each element belongs to its own cluster and iteratively merging clusters into successively larger dimension clusters until all elements belong to a single cluster (or until certain pre-defined stoppage conditions such as a maximum number of clusters to define are met); divisive methods, starting from a single cluster that comprises all elements, these methods iterate splitting it into successively smaller clusters until each element belongs to its own cluster (or until certain pre-defined stoppage conditions such as a maximum number of clusters are met).. According to Liao (2005) both kinds of “pure hierarchical methods suffer from the inability to perform adjustments once a merge or split decision has been executed”. For this reason, hierarchical methods are usually combined with other clustering techniques to address such limitation. Although the use of hierarchical clustering methods does not grant the desired level of flexibility at each iteration, their application can be worthwhile when combined with other non-hierarchical methods. For that reason, the implementation carried in this study has its foundation on the application of hierarchical agglomerative clustering (hereinafter: HAC) methods as means of a synergy to decide for a suitable number of " clusters, given the need of this aprioristic element as an input for nonhierarchical clustering application. Such class of methods makes use of a similarity-dissimilarity matrix used to “gradually build clusters by putting similar entities into the same cluster”, where each of the matrix constituting cells accounts for the “degree of similarity between two entities” (Blashfield, 1976). Among all the HAC methods described in the available literature and illustrated in Figure 5, there are four methods that are commonly recognized to be the ones of most popular application according to Anderberg (1973), Manning, Raghavan and Schütze (2008) and Everitt (2011). The first method, single-linkage clustering, proposed by Sneath (1957) and later improved by Johnson (1967), Lance and Williams (1967) and finally McQuitty (1967), uses a local merge criterion assuming that “the similarity of two clusters is the similarity of their most similar members”, focusing solely over “the area where the two clusters come closest to each other” and ignoring “other, more distant parts of the cluster and the clusters’ overall structure”. Sokal and Sneath (1963) and Cormack (1971) point single-linkage’s major drawback to be the tendency to suffer from chaining effect as “an entity is added to a cluster if it is highly similar to any member of that cluster […] causing resulting clusters to resemble long chains when plotted in a multidimensional space”, discouraging most researchers to employ this method. The second method within this category is complete-linkage clustering, which considers non-local merge criterion if “the similarity of two clusters is the similarity of their most dissimilar members […] equivalent to choosing the cluster 18.
(23) pair whose merge has the smallest diameter”, typically resulting into “a preference for compact clusters with small diameters over long, straggly clusters, but also causes sensitivity to outliers.” (Manning et al., 2008). Although this method can be considered as chaining-effect-proof, Lance and Williams (1967) identify its “space-diluting” properties as a major shortcoming. Put simply, given the fact that “an entity cannot join a cluster until it obtains a given similarity level with all members of a cluster, the probability of a cluster obtaining a new member becomes smaller as the size of the cluster increases” (Blashfield, 1976) . Average-linkage clustering, often named group-average agglomerative clustering, as proposed by Sokal and Sneath (1963), essentially relies on the definition of cluster as a “group of entities, in which each member has a greater mean similarity with all members of the same cluster than it does with all members of any other cluster” (Blashfield, 1976) and thus circumventing the pitfalls of the previous identified methods within this category, reason why it is considered to be the “most preferable” for a number of authors such as Sokal and Rohlf (1962), Sneath (1966), Rohlf (1970) and Cunningham and Ogilvie (1972). Other authors such as Williams, Clifford and Lance (1972) criticize this method upon proving its higher likelihood to produce “nonconformist groups as the size of clusters increase”. Figure 5. Cluster Similarity Notions in HAC. Source: Adapted after Manning, Raghavan and Schütze, Introduction to Information Retrieval, 2008.. The last method among the four most popular in the HAC category, is the Ward’s minimum variance, proposed by Ward (1963) and later enhanced by El-Hamdouchi and Willett (1986), iteratively merging the clusters with the smallest residual sum of squares (hereinafter: RSS). Defined as “the squared distance of each vector from its centroid summed over all vectors”, RSS is described in the literature as “a measure of how well the centroids represent the members of their clusters” (Manning et al., 2008). The agglomeration criterion applied in Ward’s method is intimately related with the one in the average-linkage clustering. The major drawback of this method it is, as denoted by Cormack (1971), its inherent bias towards producing spherical-shaped clusters. 1.4.3.3 Density-based Methods Density-based clustering methods define clusters as higher element density areas within the dataset (Kriegel, Kröger, Sander & Zimek, 2011). The most renowned method within this class is DBSCAN. 19.
(24) for which the main idea is to “continue growing a cluster as long as the density (number of objects or data points) in the neighborhood exceeds some threshold” (Sander, Ester, Kriegel & Xu, 1998). 1.4.3.4 Grid-based Methods This class of methods is named after the “quantization of the object space into a finite number of cells that form a grid structure on which all of the operations for clustering are performed” (Wang, Yang, & Muntz, 1997), for which the STING algorithm is the most popular, especially in application to spatial datasets of very large dimension. 1.4.3.5 Model-based Methods Model-based methods are built on the premise of assigning to each of the clusters a different model, pursuing the best fit of the data to the respectively assigned model. Two major approaches within this class of methods are of special relevance: • •. statistical, where the determination of the number of clusters makes use of Bayesian statistical analysis, and for which methods like “AutoClass” (Cheeseman & Stutz, 1996); artificial neural networks, including variations such as competitive learning and self-organizing feature maps.. Disregarding the broad variety of clustering algorithms belonging to different method categories, this research project is mainly focused in the application the most renowned hierarchical (agglomerative) and partitioning methods, leaving the implementation of additional clustering methods as an opportunity for further research. 1.4.4 Cluster Validity and Evaluation Criteria Clustering, as previously mentioned, is a process that requires both knowledge on the data at use and the methods employed. Although, even possessing aprioristic knowledge on the data does not ensure an effective choice of the “optimal” grouping scheme: the one that best reproduces the latent partitions of the dataset. Cluster analysis requires trial and error experimentation and recursive evaluation and comparison of the produced solutions to attain the desired partition scheme. This section presents a number of criteria to assess the validity of produced clustering solutions. Regardless of the dataset geometric structure, each clustering solution is intimately connected to the algorithm at use and thus the values assigned to the underlying input parameters. As mentioned in the preceding section, some clustering methods require an aprioristic knowledge of the number of clusters to determine (e.g., partitioning methods). While this requires an extensive knowledge of the dataset, since multidimensional visualization is often limited, the first aspect to address is the choice of the “optimal” number of clusters to identify. In the sequel of the choice of the “optimal” number 20.
(25) of clusters follows the evaluation of the obtained solutions. Theodoridis and Koutroumbas (1999) present three main inspective approaches regarding cluster validity, each of them on the foundation of different evaluation criteria: external, internal and relative. 1.4.4.1 External Evaluation Criteria External criteria are employed to “measure the agreement between two partitions where the first is the a priori known clustering structure, and the second results from the clustering procedure” (Dudoit & Fridlyand, 2002). It is immediate the conclusion that such criteria do not fit for the study conducted in this thesis give the fact that data is unlabeled and thus, there is no information regarding an existent partition structure of the dataset. 1.4.4.2 Internal Evaluation Criteria On the other hand, internal criteria aim to “measure the goodness of a clustering structure without external information (…) evaluating the results using quantities and features inherent in the data” (Thalamuthu, Mukhopadhyay, Zheng & Tseng, 2006). Halkidi et al. (2001) discern two main applications of internal criteria upon the clustering structure. The former regards to the validation of a hierarchy of clustering schemes having its main application for the validation of solutions resulting from the employment of hierarchical clustering methods. Considering the cophenetic matrix, ;< , which stores in each ;< (=, >) cell a distance measure (typically the dendrogram height) at which the 96 and 9? elements are included in the same cluster. Sokal and Rohlf (1962) define the Cophenetic Correlation Coefficient (hereinafter: CPCC) as an index to “measure the degree of similarity between ;< and ; (proximity matrix) matrices”. This index varies within the [−1,1] range, and can be formalized as 1 MO4 M ∑,34 ∑I3,N4 d,I c,I − µL µ2 M CPCC = F , 1 M Q Q Q R P 1 ∑MO4 ∑M QR ∑ PM ∑MO4 d − µ c − µ L 2 ,34 I3,N4 ,I M ,34 I3,N4 ,I where: • •. T is the number of constituting elements of the dataset; U = T ∙ (T − 1)⁄2;. •. \ YZ = [ ∑\O4 634 ∑?36N4 ;(=, >);. •. \ Y< = ^] ∑\O4 634 ∑?36N4 ;< (=, > ), with;. •. YZ and Y< the respective means of ; and ;< matrices.. 4. 21. (2).
(26) The CPCC must be interpreted in terms of the level of similarity between ;< and ; matrices, for which values close to 0 support the evidence of a high similarity between the two matrices and thus a low-quality solution. Values closer to 1 are therefore preferred. The latest application of internal cluster evaluation criteria concerns to the validation of a single partition scheme, investigating the level of similarity between a given partition 7 and the proximity matrix ;. In order to perform such similarity check, Halkidi et al. (2001) suggest the use of Hubert’s Γ statistic defined as MO4. M. 1 Γ = & & X(i, j)Y(i, j) M. (3). ,34 I3,N4. or the normalized Hubert’s Γ statistic defined as MO4. M. (X(i, j) − µe )(Y(i, j) − µf ) 1 Γd = & & M σe σf. (4). ,34 I3,N4. where h and i are the matrices under comparison and Yj , Yk , lj and lk are their respective means and variances. The use of the normalized statistic provides values within the [−1,1] range, which are of easier interpretation. 1.4.4.3 Relative Evaluation Criteria Finally, relative criteria are useful when “comparing a specific partition structure against other clustering schemes obtained using the same algorithm but with different parameter values” (Halkidi et al., 2001). This approach implies a reduced computational cost when compared to the previous external and internal criteria given their statistical-based nature. Relative evaluation can be performed by the evaluation of certain validity indices that allow the identification ", optimal number of clusters, even when applying algorithms that require the specification of this parameter as an input. Such validity indexes are computed for each run of an algorithm within a certain targeted range of ". As a result, it is possible to plot the obtained values of the index against the respective number of clusters considered. Each plot requires one of two different interpretations: •. for the cases where there is no evidence of an increasing (decreasing) trend of the index as a result of an increase (decrease) of ", the ideal number of clusters is given at the value of " for which the index is maximized (minimized);. 22.
(27) •. on the contrary, when a trend in the index value in terms of " is not evident, the optimal number of clusters is usually given by “the value of " at which a significant local change in value of the index occurs”; in graphical terms, this point represents a “knee” which usually outstands the remaining plotted structure. Additionally, the authors suggest that “the absence of a knee may be an indication that the dataset possesses no clustering structure”.. While there is a variety of validity indexes that can aid the search for the optimal number of clusters and thus to the optimal partition structure, this study comprehends a set of those which have been popularized within the relevant literature. The first here presented is the modified Hubert m statistic defined as a particular case of the aforementioned Hubert m statistic having ; (dataset proximity matrix) and n\×\ (matrix containing the distance between the cluster representatives for each element of the dataset) as the matrices under comparison. A large value obtained as a result of this implementation indicates evidence towards more compact clusters. Additionally, this implementation can be done applying similar reasoning to Γd (normalized Hubert m). The graphical interpretation of the plot of the Hubert m statistic in terms of " clusters, the optimal number for " is located at the value where a significant “knee” outstands. Another validity index here addressed is the Dunn index, useful for identifying “compact and well separated crisp clusters” (Dunn, 1974). It is possible to formalize the Dunn index, pq , as a function of both dissimilarity and diameter, given by the equation. Ds = min v min w ,34,…,s I3,N4,…,s. dxc, , cI y |} , max diam(c{ ). (5). {34,…,s. having: •. 8x:6 , :? y = min 8(9, Ç), dissimilarity between two clusters :6 and :? ;. •. 8=É5(7 ) = max 8(9, Ç), diameter of a cluster 7, defined as the maximum distance between. ~∈< ,Ä∈<Å ~,Ä∈Ñ. the two most distant elements belonging the same cluster. Conversely, given a dataset comprising compact and well-separated clusters, large values of Ds are expectable, implying the evidence for the existence of a partition structure where clusters are narrow (in diameter) and widely separated. Given the absence of a trend in Ds regarding ", the optimal number of clusters is graphically represented by the value of " at which the Ds index is maximum. Some common known drawbacks of using Ds as a validity index are both the computational effort required and its sensitivity to noise and outliers which might produce larger values of 8=É5(7 ).. 23.
Imagem


+7


Documentos relacionados
Como estas alterações são mais severas em casos de distrofia miotónica congénita, a sua etiologia pode ser devido à redução da função muscular apresentada por estes pacientes
O�, ��m� b�m ��������� FACHIN, ‘� ������� �� ��� ��� ��v���, �� ���� no de sua efetivação, uma busca pela verdadeira paternidade. RECONHECIMENTO dE PATERNIdA�
The objective of this research was to build up a model (decision tree) using data mining techniques such as feature selection and data classification, for predicting broiler
Partindo dessas considerações, o presente estudo foi realizado em um supermercado localizado em Cataguases, no interior de Minas Gerais, com o objetivo de identificar
Após optimização das condições cromatográficas e do estudo de interferentes foi selec- cionada uma mistura final a ser analisada por GC/IRMS durante o Ensaio de Certificação
Articulação de papéis dos profissionais de restauração com horário repartido: um estudo exploratório
Como objetivos específicos, esta pesquisa exploratória visa: (a) Compreender qual o perfil sociodemográfico (nível socio-económico e cultural) dos profissionais do setor
Conclui-se que os documentos produzidos por agentes formadores e gestores de recursos humanos (planos e cronogramas de atividades educativas, manuais
Data mining is the process of discovering meaningful correlations, patterns and trends by sifting through large amounts of data stored in repositories. Data mining employs pattern
