DETERMINANTES DE SAÚDE NUMA AMOSTRA DE CRIANÇAS PORTUGUESAS HEALTH DETERMINANTS AMONG A SAMPLE OF PORTUGUESE CHILDREN DETERMINANTES DE LA SALUD EN NIñOS PORTUGUESES
Nélio Veiga1 Carlos Pereira2 Rosalina Loureiro3 Maria Odete Amaral2 Inês Coelho4
Joana Pereira5
1 Universidade Católica Portuguesa, Instituto de Ciências da Saúde, Viseu, Portugal
2 Instituto Politénico de Viseu, CI&DETS, ESSV, Departamento de Enfermagem, Viseu, Portugal 3 Câ mara Municipal de Tondela, Tondela, Portugal
4 Unidade de Saúde Familiar grão Vasco, Viseu, Portugal 5 Riga Stradins University, Latvia
Nélio Veiga - nelioveiga@gmail.com | Carlos Pereira - carlospereiraviseu@gmail.com | Rosalina Loureiro - 1975@hotmail.com | Maria Odete Amaral - mamaral@ essv.ipv.pt | Inês Coelho - inesisabelcoelho@gmail.com | Joana Pereira - joanaitpereira@gmail.com
Millenium, 2(1), 77-84.
Autor Correspondente
Nélio Veiga
Rua Major Leopoldo da Silva, nº34, 4ºEsq. 3510-123 Viseu, Portugal
nelioveiga@gmail.com
RECEBIDO: 05 de setembro, 2016 ACEITE: 26 de setembro, 2016
Introdução: Os estilos de vida actuais podem estar associados a comportamentos de risco que estão na base do perfil de saúde de um país.
Objetivos: O objectivo do estudo consiste na avaliação dos determinantes da saúde e sua associação com variáveis sócio-demográficas numa amostra de crianças portuguesas dos 3 aos 10 anos de idade.
Métodos: Foi realizado um estudo transversal desenhado com um total de 1617 crianças de escolas públicas, a partir dos dois principais grupos escolares de Tondela e Vouzela, Portugal. A amostra final do estudo foi construído com um total de 1365 crianças com idades compreendidas entre os 3 e 10 anos de idade. A recolha de dados foi realizada através da distribuição de um questionário auto-administrado aos pais e cuidadores das crianças.
Resultados: Verificou-se que as crianças mais velhas tinham uma menor adesão a hábitos alimentares saudáveis e uma maior prevalência de atividade física. Os meninos tinham níveis mais elevados de atividade física e maior prevalência de sedentarismo, em comparação com as meninas. A área de residência das crianças foi associada a uma maior prevalência de consumo de fastfood e comportamentos sedentários. Torna-se evidente a necessidade de realizar intervenção sobre os grupos sociais mais vulneráveis para obter a igualdade em saúde de forma mais eficaz. A definição de estratégias de promoção da saúde deve ser seriamente considerada nas comunidades, a fim de melhorar os estilos de vida saudáveis entre as crianças portuguesas e as suas famílias.
Palavras-chave: crianças; estilos de vida; aspectos sócio-demográficos; atividade sedentária.
ABStrACt
Introduction: The current lifestyles suggest risk behaviors that are the basis of a country’s health profile.
Objectives: The objective of this study was the assessment of health determinants and its association with socio-demographic variables among a sample of Portuguese children from 3 to 10 years old.
Methods: A cross-sectional study was designed with a total of 1617 children from public schools, from the two main school groups of Tondela and Vouzela, Portugal. The final study sample was built with a total of 1365 children aged between 3 and 10 years old. Data collection was accomplished by the distribution of a self-administered questionnaire to the parents and caregivers of the children.
Results: It was found that the older children had a lower adherence to healthy eating habits and a higher prevalence of physical activity. The boys had higher levels of physical activity and higher prevalence of sedentary behaviors, in comparison with girls. The residence area of the children was associated with a higher prevalence of fastfood consumption and sedentary behaviors. Conclusions: It becomes noticeable the need to make an intervention on the most vulnerable social groups to obtain more effective health equality. Health promotion strategies should be seriously considered in communities in order to improve healthy lifestyles among Portuguese children and their families.
Keywords: children; lifestyles; socio-demographic aspects; sedentary activity.
RESUMEN
Introducción: Los estilos de vida actuales pueden estar asociados con comportamientos de riesgo que subyacen en el perfil de salud de un país.
Objetivos: El objetivo del estudio es evaluar los determinantes de la salud y su asociación con variables sociodemográficas en una muestra de niños portugueses de 3 a 10 años de edad.
Métodos: Un estudio transversal diseñado con un total de 1617 niños de las escuelas públicas, a partir de los dos grupos principales de la escuela y Tondela Vouzela, Portugal. La muestra final fue construido con un total de 1365 niños de edades comprendidas entre los 3 y 10 años de edad. La recolección de datos se realizó mediante la distribución de un cuestionario autoadministrado a los padres y cuidadores.
Resultados: Se encontró que los niños mayores tenían una menor adhesión a los hábitos alimentarios saludables y una mayor prevalencia de actividad física. Los niños tenían niveles más altos de actividad física y una mayor prevalencia de inactividad física en comparación con las niñas. área de residencia de los niños se asoció con una mayor prevalencia de consumo de comida rápida y los comportamientos sedentarios.
Conclusiones: Es evidente la necesidad de intervención de los grupos sociales más vulnerables de la igualdad en la salud de manera más eficaz. La definición de las estrategias de promoción de la salud debe considerarse seriamente en las comunidades con el fin de mejorar los estilos de vida saludables entre los niños y sus familias portuguesas.
INTRODUCTION
The World Health Organization (WHO) consideres chronic noncommunicable diseases as a serious public health issue that represent a significant threat to health and human development (WHO, 2002). Studies do demonstrate that the socially vulnerable population groups seem to be more exposed to the development of certain diseases associated with obesity/overweight and inadequate food intake. (general Health Directory of Portugal, 2015).
1. THEORETICAL FRAMEWORK
The report on “Noncommunicable Diseases Country Profiles 2014” presented at the United Nations general Assembly reveals that, worldwide, 38 million people (28 million in developing countries) die annually due to chronic diseases, and it is estimated that they are responsible for nearly 86% of premature deaths, mainly associated with cardiovascular diseases (WHO, 2014). Among the determinants of health, lifestyles and daily habits occupy an important role due to the risk factors associated and the impact on the quality of life, well-being, morbidity and mortality, since they are primarily responsible for the development of chronic diseases. (Regional Health Administration of Algarve, 2016; general Health Directory of Portugal, 2015).
Worldwide, WHO data indicate that after smoking, obesity is currently considered as the second main cause of preventable death and if no urgent measures are taken to prevent and treat this issue, over 50% of the world population will be obese by 2025 (general Health Directory of Portugal, 2005). According to the Childhood Obesity Surveillance Initiative Portugal 2010 project data, one in three children in the European Union aged between 6 and 9 years, were overweight or obese (Rito et al., 2010). The number of children from 0 to 5 years, overweight or obese, increased from 31 million in 1990 to 44 million in 2012 (Ng et al., 2014). In Portugal, in recent years, the country achieved significant health gains due to socio-economic improvement. However, modernization has also led to strong changes in lifestyle and unhealthy behaviors that are the basis of the country’s health profile. The results of the “Portugal Healthy Eating Report” of 2014, indicates a high prevalence of obesity among the Portuguese population (about 1 million obese and 3.5 million pre-obese adults) (general Health Directory of Portugal, 2015).
Scientific evidence shows a direct association between physical inactivity and favoring conditions for obesity and overweight (Rito et al., 2010). There is strong evidence that inequalities in health among different population groups result from differences in the factors that influence health such as the health-related behavior, employment status, educational level and monthly income (Mantziki et al., 2014).
This study aims to determine dietary habits, physical activity and sedentary behavior practices and analyze their association with sociodemographic data in a sample of Portuguese children from 3 to 10 years old.
2. METHODS
A cross-sectional observational epidemiological study was designed. The study population consisted of all children attending in the 2012-2013 school year, in the pre-school and the 1st cycle (1st to 4th grades) of the School groups of Tondela and Vouzela, Portugal,
totaling 1617 children.
2.1. Sample
The type of sampling was non-probabilistic, by convenience technique where all the students of the schools in question were eligible to participate in the study. The sample included all collected and completed questionnaires. The questionnaires without information for gender and age were excluded, leaving a final sample consisted of 1385 children (52% male gender), of whom 1118 (80.7%) belonged to the school groups of Tondela and 267 (19.3%) to the school groups of Vouzela. In the age distribution in both genders, the group aged 3-5 years showed a proportion of 26.4%, 50.5% aged 6-8 years and 23.1% aged ≥9 years old. Most of the children lived in rural areas (68.5%) and 31.5% in urban areas. With regard to professional status of the parents, 86.2% fathers and 74.7% mothers were employed, while 12.6% fathers and 25.3% of mothers were in the condition of unemployed.
2.2. Data collection
Data collection was accomplished using a self-administered questionnaire distributed between February and March of 2013 to all parents and / or guardians of the study population. The measuring instrument used was divided into two main parts: the first addressed the data identification/characterization and the second was dedicated to providing data on the child’s lifestyle and daily habits (Appendix 1).
For the variables, we considered the lifestyles (eating habits, physical activity and sedentary behaviors) as the dependent variables and sociodemographic background (gender, age, residential area, parents´ educational level and the families´ monthly household income) as independent variables.
2.3. Statistical methods
Statistical analysis was performed using the software Statistical Package Statistical for Social Sciences (SPSS) version 21.0 for Windows. Descriptive statistics with the presentation of frequencies and percentages for nominal variables were used, and the qualitative variables were presented in the form of proportion and compared using the chi-square test. The statistical interpretation of tests was carried out using a significance level of p=0.05 with 95% confidence intervals.
2.4. Legal Proceedings
Authorization for data collection was requested to the school boards under study, by registered letter. Subsequently, a meeting was held with the directors of the respective school groups, where the objectives and purposes of the research were explained and requested the collaboration for the distribution and collection of the questionnaires. It was also guaranteed anonymity and confidentiality of the data collected, which served only to carry out this study, without any economic or commercial interests.
RESULTS
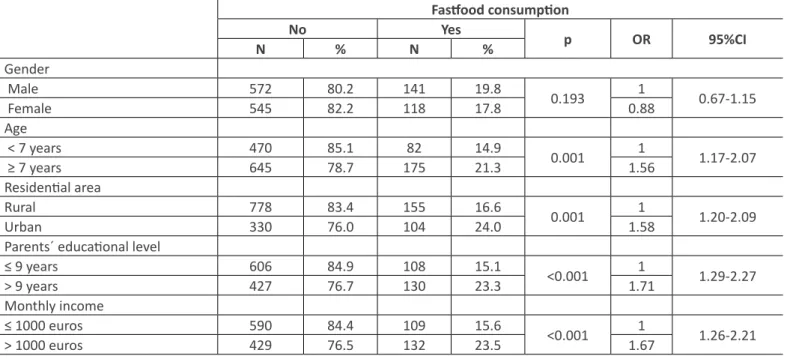
The results showed that children usually have breakfast (98.5%) and dinner (98.9%) at home, and lunch mostly is taken in the cafeteria or school canteen (88.6%). It was found that the foods consumed at breakfast were mostly: milk (92.8%), cereals (85%) and yogurts (81.9%). Fruit was one of the foods least consumed during breakfast (8.4%). When questioned about the frequency of consumption of sweets, 74.2% of parents reported that their children “sometimes” ate sweet snacks, 13% said they “never or rarely” consumed sweets, and 9.5% consumed sweets “every day “or” almost every day “. Results showed a pattern of association between age and the consumption of milk and dairy products (p=0.02) as well as the monthly income of parents and consumption of milk and dairy products (p=0.01). Assessing the prevalence of consumption of dairy products by age it was found that children under the age of 7 years old have a higher consumption when compared with the children with the same age or over 7 years old (p=0.02). Table 1 - Association between the consumption of fastfood and socio-demographic factors.
Fastfood consumption No Yes p OR 95%CI N % N % Gender Male 572 80.2 141 19.8 0.193 1 0.67-1.15 Female 545 82.2 118 17.8 0.88 Age < 7 years 470 85.1 82 14.9 0.001 1 1.17-2.07 ≥ 7 years 645 78.7 175 21.3 1.56 Residential area Rural 778 83.4 155 16.6 0.001 1 1.20-2.09 Urban 330 76.0 104 24.0 1.58
Parents´ educational level
≤ 9 years 606 84.9 108 15.1 <0.001 1 1.29-2.27
> 9 years 427 76.7 130 23.3 1.71
Monthly income
≤ 1000 euros 590 84.4 109 15.6 <0.001 1 1.26-2.21
> 1000 euros 429 76.5 132 23.5 1.67
The results of Table 1 demonstrate a pattern of association between the consumption of fastfood and age of the children (p=0.001; OR=1.56, 95%CI 1.17 to 2.07), residence area (p=0.001; OR = 1.58, 95%CI 1.20 to 2.09), parents´educational
level (p<0.001; OR=1.71, 95%CI 1.29 to 2.27), and monthly income (p<0.001; OR=1.67, 95%CI 1.26 to 2.21). As for gender, the data show that the consumption of fastfood was 19.8% in boys and 17.8% in girls. Regarding the consumption of fastfood, depending on age, children under 7 years of age have a lower prevalence of fastfood consumption when compared with children ages 7 years or higher (14.9% vs 21.3% p=0.001; OR=1.56, 95%CI 1.17 to 2.07). It was also found that children living in urban areas have a higher prevalence of fastfood consumption than those living in rural areas (16.6% vs 24 0% p=0.001; OR=1.58, 95%CI 1.20 to 2.09). With regard to the parents educationl level, there is a higher prevalence of fastfood consumption among children whose parents have a higher educational level compared with children with parents of lower qualifications (15.1% vs 23.3% p<0.001; OR=1.71, 95%CI 1.29 to 2.27). As for the monthly household income, a higher prevalence of consumption of fastfood was found among children from higher monthly household incomes in comparision with children from families with lower households incomes (23.5% vs 15.6% p<0.001; OR=1.67, 95%CI 1.26 to 2.21).
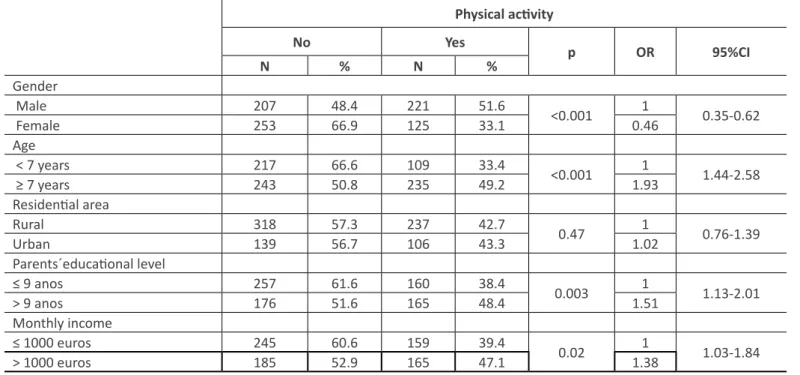
Table 2 - Association between the performance of physical activity and socio-demographic factors.
Physical activity No Yes p OR 95%CI N % N % Gender Male 207 48.4 221 51.6 <0.001 1 0.35-0.62 Female 253 66.9 125 33.1 0.46 Age < 7 years 217 66.6 109 33.4 <0.001 1 1.44-2.58 ≥ 7 years 243 50.8 235 49.2 1.93 Residential area Rural 318 57.3 237 42.7 0.47 1 0.76-1.39 Urban 139 56.7 106 43.3 1.02 Parents´educational level ≤ 9 anos 257 61.6 160 38.4 0.003 1 1.13-2.01 > 9 anos 176 51.6 165 48.4 1.51 Monthly income ≤ 1000 euros 245 60.6 159 39.4 0.02 1 1.03-1.84 > 1000 euros 185 52.9 165 47.1 1.38
The prevalence of physical activity (sporting activities: swimming, cycling and soccer) is only 43.0% of the total sample. According to the results of Table 2, there is a pattern of association between physical activity and gender (p<0.001; OR=0.46, 95%CI 0.35 to 0.62), child´s age (p<0.001; OR=1.93, 95%CI 1.44 to 2.58), parents´ educational level (p=0.003; OR=1.51, 95%CI 1.13 to 2.01) and monthly income (p=0.02, OR=1.38, 95%CI 1.03 to 1.84).
Regarding the practice of physical activity by gender, the boys presented a higher prevalence of the practice of physical activity compared to girls (51.6% vs 33.1 % p<0.001; OR=0.46; 95%CI 0.35 to 0.62). As for physical activity according to age, children younger than 7 years have lower prevalence compared with children older than 7 years (33.4% vs 49.2% p<0.001; OR=1.93, 95%CI 1.44 to 2.58). Regarding the child’s residential area, the prevalence of physical activity practice is 42.7% among rural children and 43.3% among the children living in urban areas. Regarding the parents´ educational background, we could verify that the practice of physical activity is lower among children whose parents have lower educational qualifications in comparision to children whose parents have higher qualifications ( 38.4% vs 48.4% p<0.003; OR=1.51, 95%CI 1.13 to 2.01). With regard to the monthly household incomes, it was found that in families with incomes below or equal to 1000 euros, the children had a lower prevalence of physical activity when compared to children from families with more than 1000 euros of monthly household incomes (39.4% vs 47.1% p<0.02; OR=1.38, 95%CI 1.03 to 1.84).
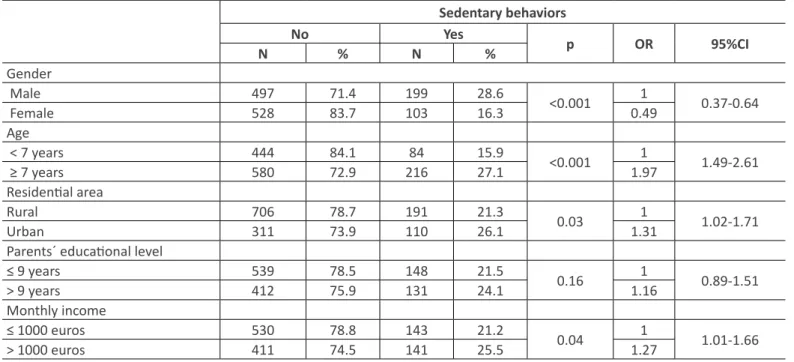
Table 3 - Association between sedentary behaviors and sociodemographic factors. Sedentary behaviors No Yes p OR 95%CI N % N % Gender Male 497 71.4 199 28.6 <0.001 1 0.37-0.64 Female 528 83.7 103 16.3 0.49 Age < 7 years 444 84.1 84 15.9 <0.001 1 1.49-2.61 ≥ 7 years 580 72.9 216 27.1 1.97 Residential area Rural 706 78.7 191 21.3 0.03 1 1.02-1.71 Urban 311 73.9 110 26.1 1.31
Parents´ educational level
≤ 9 years 539 78.5 148 21.5 0.16 1 0.89-1.51
> 9 years 412 75.9 131 24.1 1.16
Monthly income
≤ 1000 euros 530 78.8 143 21.2 0.04 1 1.01-1.66
> 1000 euros 411 74.5 141 25.5 1.27
In the context assessing sedentary behaviors, the results of table 3 demonstrate a pattern of association between sedentary behaviors and gender (p<0.001; OR=0.49, 95%CI 0.37 to 0.64), the child´s age (p<0.001; OR=1.97, 95%CI 1.49 to 2.61), the residential area (p=0.03, OR=1.31, 95%CI 1.02 to 1, 71) and the monthly income (p=0.04, OR=1.27, 95%CI 1.01 to 1.66). With regard to sedentary behaviors by gender, the boys showed a higher prevalence compared to girls (28.6% vs 16.3% p<0.001; OR=0,49, 95%CI 0.37 to 0.64). After analysis of sedentary behaviors in relation with age, it was found that children under 7 years have lower prevalence in comparision with children older than 7 years (15.9% vs 27.1% p<0.001; OR=1.97, 95%CI 1.49 to 2.61). With regard to the residential area, children living in rural areas have a lower prevalence of sedentary behaviors when compared with children living in urban areas (21.3% vs 26.1% p<0.03; OR=1.31, 95%CI 1.02 to 1.71). Regarding the parents´ educational level, there was a prevalence of sedentary behaviors of 21.5% in children whose parents have educational qualifications below the 9th grade and 24.1% in children with parents with higher qualifications. Regarding the monthly household income, it was found that in families with incomes below or equal to 1000 euros, the children had a lower prevalence of sedentary behaviors when compared with children whose families presented more than 1000 euros of monthly household incomes (21.2% vs 25.5% p<0.04; OR=1.27, 95%CI 1.01 to 1.66).
DISCUSSION
The present study revealed that a high prevalence of children present daily sedentary behaviors in which 85.8% of the children every day. These results or similar to those obtained in the Epode for the Promotion of Health Equity project that showed that, in average, children spent a considerable part of their time in front of a computer (half an hour a day during the week and about one a day over the weekend) (Mantziki et al., 2014). This behavior also highlights the WHO data, collected between 2009 and 2010, where Portugal is one of the European Union countries with higher physical inactivity rates (WHO, 2014). This reality is expressed in the same way in the Special Eurobarometer statistics of the European Commission: Sport and Physical Activity, published in March 2014. Following Bulgaria and Malta, Portugal was considered the 3rd European Union country where respondents said they never engaged in physical activity (TNS Opinion & Social, 2014).
When we associate eating habits, physical activity and sedentary behaviors to sociodemographic data the present study shows that: - In older children, the consumption of dairy products decreases while the consumption of fastfood increases. - The older children showed the highest prevalence of physical activity, however, are also those with the highest prevalence of sedentary behaviors.
- In relation to gender, the boys do more physical activity but are also those with higher prevalence of sedentary behaviors. - In regard to residential area, children who live in the countryside consumed less vegetables when compared to children who lived in urban areas, although also presented lower prevalence of consumption of fastfood and sedentary behaviors.
- With regard to parents’ educational level, children whose parents possessed more qualifications, consumed more vegetables and practiced more physical activity, even though they are the same who consumed more fastfood. - Children of families with more favorable monthly household incomes consumed more dairy products, vegetables and practiced more physical activity. However, they also had a higher prevalence of fastfood consumption and sedentary behaviors. The advancing of age is associated with the decrease in the adherence to healthy eating habits and a greater rate of sedentary activities. With regard to gender, compared to girls, boys had higher levels of physical activity, but also reported higher levels of sedentary behaviors. Scientific evidence demonstrates the possible combination between physical activity (play football, por example) with sedentary behaviors (watching TV), where the most important goal is to ensure that the consumption is equal to the total daily energy expense. However it is conceivable that the reduced levels of physical inactivity observed in children may predispose to obesity (Sousa, 2011).
Regarding the residence area, easy access to food seems to be on the basis of higher consumption of vegetables and fastfood in urban areas compared to rural areas. These results may be associated with a real decrease in rates of the family sustainablity of agriculture that characterized the Portuguese countryside. In this study it was shown that the literary level of parents do influence the behavior of children. In this field, the Epode for the Promotion of Health Equity project states that the vegetable and fruit consumption by the Portuguese children is low, however, almost 30% of households with lower educational level indicated that children ate vegetable salads “less than once a week.” This project also states that children whose families have a lower educational level spend an average of 3.5 hours watching television, which is higher in comparision with children from families with a higher educational level (Mantziki et al., 2014).
This study showed that children belonging to a more favourable socioeconomic status consume more dairy products and vegetables and also praticed more physical activity. However, they also had a higher prevalence of fastfood consumption and sedentary behaviors. These results are in line with the conclusions of some authors, that state that the literary levels assume relevance in regard to the definition of rules on the time of exposure to television and in the field of nutritional education, playing a very important role in the healthy eating patterns of children (Mantziki et al., 2014).
CONCLUSIONS
The study demonstrates the need to intervene in the most vulnerable groups in order to obtain more effective health equality. Policies and strategic programs for the promotion of health should be specifically targeted to this population segment. However, this research also concluded that better social and economic family patterns does not justify, by itself, healthier behaviors, since higher levels of fastfood consumption and sedentary behaviors are among those with higher socioeconomic status. This analysis reflects the importance that should be given to health literacy among parents, particularly investing in the capacity of becoming models for healthy behaviors for their children. This field is also relevant in school programming, because the role of the school is essential for the acquistion of knowledge about healthy behaviors and lifestyles. In this sense, the school must also commit to ensure quality meals, at a nutritional, food hygiene and safety levels. Future research should be developed in order to understand the health behaviors of children, adolescents and families that live in various portuguese regions in order to show the real needs, in a national scale, of healthy lifestyles promotion programs and the constant development of adequate strategic health policies.
CONFLICT OF INTERESTS
The authors have no conflicts of interest.
ACKNOWLEDGEMENTS
Research Centre for Education, Technology and Health Studies of the Polytechnic Institute of Viseu, Portugal (CI & DETS).
REFERENCES
Administração Regional de Saúde do Algarve. (2016). Programa de combate à obesidade infantil na região do Algarve [Internet]. Retrevied from: <http://www.arsalgarve.min -saude.pt/portal/sites/default/files//images/centrodocs/nutricao/
programa_combate_obesidade_infantil.pdf.>
Direcção-geral de Saúde. (2004). Programa nacional de intervenção integrada sobre determinantes da saúde relacionados com os estilos de vida. . [Internet]. Retrieved from:
Direção-geral da Saúde. (2005). Programa Nacional de Combate à Obesidade. [Internet]. Retrieved from: <http://1nj5ms2lli5hdg gbe3mm7ms5.wpengine.netdna-cdn.com/files/2015/08/Programa-Nacional-de-Combate-%C3%A0-Obesidade.pdf.> Direcção-geral de Saúde. (2015). Alimentação saudável em números 2015: Programa nac ional para a promoção da alimentação
saúdável [Internet]. Retrieved from: <https://www.sns.gov.pt/wp-content/uploads/2016/03/Relat%C3%B3rio-Portugal-Alimenta%C3%A7%C3%A3o-Saud%C3%A1vel-em-N%C3%BAmeros-2015.pdf.>
Mantziki, k., Vassilopoulos, A., Radulian, g., Borys, J. M., du Plessis, H., gregório, M. J., Seidell, J. C. (2014). Promoting health equity in European children: Design and methodology of the prospective EPHE, epode for the promotion of health equity: Evaluation study. BMC Public Health, 14, 303.
Ng, M., Fleming, T., Robinson, M., Thomson, B., Graetz, N., & Margono, C. (2014). global, regional, and national prevalence of overweight and obesity in children and adults during 1980-2013: A systematic analysis for the global burden of disease study 2013. Lancet, 384(9945), 766-81.
Rito, A., Paixão, E., Carvalho, M. A., & Ramos, C. (2008). Childhood obesity surveillance initiative: COSI Portugal 2008. [Internet]. Retrieved from: <http://www.insa.pt/sites/INSA/Portugues/Publicacoes/Outros/Documents/AlimentacaoNutricao/ Relatorio_COSI.pdf.>
Sousa, J. (2011). Obesidade infanto-juvenil em Portugal: Associação com os hábitos alimentares, atividade física e comportamentos sedentáros dos adolescentes escolarizados de Portugal Continental. Lisboa: Colibri.
TNS Opinion & Social. (2014). Special Eurobarometer 412: Sport and physical activity. [Internet]. Retrieved from: <http:// http:// ec.europa.eu/health/nutrition_physical_activity/docs/ebs_412_en.pdf.>
World Health Organization. (2002). The european health report 2002. [Internet]. Retrieved from: <http://www.euro.who.int/__ data/assets/pdf_file/0007/98296/E76907.pdf.>
World Health Organization. (2014). Noncommunicable diseases: country profiles 2014. . [Internet]. Retrieved from: <http://apps. who.int/iris/bitstream/10665/128038/1/9789241507509_eng.pdf?ua=1.>
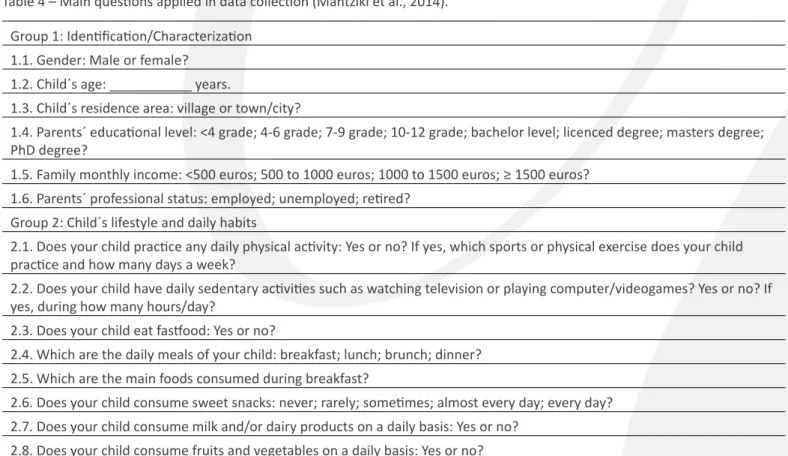
APPENDIx 1
Table 4 – Main questions applied in data collection (Mantziki et al., 2014). group 1: Identification/Characterization
1.1. gender: Male or female? 1.2. Child´s age: ___________ years.
1.3. Child´s residence area: village or town/city?
1.4. Parents´ educational level: <4 grade; 4-6 grade; 7-9 grade; 10-12 grade; bachelor level; licenced degree; masters degree; PhD degree?
1.5. Family monthly income: <500 euros; 500 to 1000 euros; 1000 to 1500 euros; ≥ 1500 euros? 1.6. Parents´ professional status: employed; unemployed; retired?
group 2: Child´s lifestyle and daily habits
2.1. Does your child practice any daily physical activity: yes or no? If yes, which sports or physical exercise does your child practice and how many days a week?
2.2. Does your child have daily sedentary activities such as watching television or playing computer/videogames? yes or no? If yes, during how many hours/day?
2.3. Does your child eat fastfood: yes or no?
2.4. Which are the daily meals of your child: breakfast; lunch; brunch; dinner? 2.5. Which are the main foods consumed during breakfast?
2.6. Does your child consume sweet snacks: never; rarely; sometimes; almost every day; every day? 2.7. Does your child consume milk and/or dairy products on a daily basis: yes or no?