Mobile Service Experience -‐ a quantitative study
Teresa Sarmento, Lia Patrício
Keyword(s): Multidimensional scaling, Mobile Services, Service Experiences, Service Design
Abstract
Incorporating Mobile service experiences into service design bring new challenges to service innovation and entails a consciousness of service specific characteristics in the mobile context. This is more relevant if we have in mind that these are customer-‐journeys with self-‐service situations. This paper presents the results of a quantitative study of mobile service experience. This quantitative study was based on a survey with users of a new mobile service for managing loyalty programs. Study results allow the identification of service experience dimensions. Based on this process a new measurement model is proposed for the customer experience factors and includes them into the design of new services. These results are important to understand the impact of some Mobile Experience factors on experience outcomes such as emotions, sensorial descriptors, attitudes, and social self-‐concept. Previous literature has conceptualized customer experience but empirical studies are still scarce. Helkkula (2011) charactherizes the service experience’s concept demonstrating the existence of empirical studies only as a outcome based. However, in order to better understand this concept, Verhoef et al. (2009) have developed a conceptual model that reveals the holistic influence of antecedents and moderators in the customer experience. Thus, in spite of its interest, complexity and distinctiveness the service experience and its research applied to mobile services, has not been made in-‐depth so far. Therefore, it is important to study Mobile service identifying its main dimensions so they can be incorporated into New Service Design.
This study develops a scale to measure Mobile Service Experience (MSE). Starting from exploratory and qualitative study, a questionnaire was developed and administered to 241 customers around the world. Data analysis allowed the identification of six MSE dimensions: ‘Awareness’ is the extent to which the service is promoted to be known by the general public. ‘Availability’ is the extent to which the service is available and accessible. ‘Usefulness’ is the degree of service’s convenience through an overall experience perspective. ‘Ease of use’ is how the service is ‘ease to learn’ and how ‘appealing’ it is. ‘Security’ is the extent to which the service cares with ‘privacy of data’ and ‘trust’. ‘Service in store’ is the way service takes place in the store environment. This paper contributes as an empirical study of MSE showing that
encompasses a broader set of experience factors. MSE dimensions influence the conception of mobile services; their consciousness will be a good contribution to New Service Development.
1.
Abstract
Mobile service experience is an imperative topic to service design and innovation, being the understanding of experience factors a requested contribution to the services success. This study develops a multidimensional scale to evaluate Mobile Service Experience (MSE). Thus a new measurement model is proposed to study these experience factors. The study revealed that the Mobile Service experience encompasses a rich set of experience factors related to core service quality attributes such as ‘availability’ as the way service promotes itself to be known, but also the ‘service in store’ as sporadic service personal contact. These results are important to understand Mobile experience factors relatively to experience outcomes and include them into the design of new services.
2.
Introduction
Mobile Services are among the necessary set of service research priorities according to Ostrom, Bitner et al. (2010), Smart services take advantage of the “Internet of things” to support customer
freedoms by bringing capabilities directly to them. (…) This ubiquitous connectivity fundamentally changes the way companies can create and sustain value for their customers. (…) This connectivity provides new ways to deliver services, and new business architectures are exploiting opportunities.
This emergence of mobile services and their consequent impact challenge to better understand which aspects of experience contribute best to service success, because even though it is an ever-‐changing sector a logic of use remains. The increased change is mainly determined by technologies innovation, however we must focus on mobile service use and their slower change of behaviors. Contributing to the New Service Development, designers must carefully integrate innovation through customer-‐centric experiences (Zomerdijk and Voss 2009). So the comprehension of mobile service experiences defies service design and innovation. To deliver superior service experiences, mobile service companies or those who use mobile channels, must first understand which experience drivers are important. This study identifies mobile
experience factors, through the assessment of a multidimensional MSE scale.
Mobile Service Experience
Mobile service experience engages all service touch-‐points even before and after its use. Mobile customer’s experience involves also aspects that are away the companies’ control. Verhoef et al.(2008) describe the customer experience as a holistic experience that involves customer’s cognitive, affective, emotional, social and physical responses. These service experiences occur when a customer has any sensation or acquires knowledge from some level of interaction with the elements of a context created by the service provider (Pullman and Gross 2004). And as a result, what the user looks at, feels and hears, while using a technology-‐based-‐service, goes
beyond the concrete sensory (Buchenau and Suri 2000; Fenko, Schifferstein et al. 2010).
While researchers studying behaviors with mobile services begin to create a picture of attributes that are important to mobile consumers, they largely do not address the issue of conceptualizing constructs (Wolfinbarger and Gilly 2003). As well, the validity and reliability of their measures have not been established so far. Pagani (2004) defined a hierarchy of importance concerning the critical factors influencing adoption of mobile services: based on importance ratings, usefulness emerged as the most important factor in the adoption of mobile services; ease of use was second in importance; price ranked third followed by speed of use. Although, these aspects are mainly concerned with service’s tangible interfaces, they do not address the people and the service process involved. Some other empirical studies considered the understanding of using mobile services, and they used previously developed constructs to build their hypothesis (Nysveen, Pedersen et al. 2005; Nysveen, Pedersen et al. 2005; Pura 2005; Kleijnen, Lievens et al. 2009). However they do not offer a holistic view of the service experience.
Research on mobile service experience is still scarce, and is mainly conceptual (Gentile, Spiller et al. 2007; Klaus and Maklan 2007; Verhoef, Lemon et al. 2009). Thus, in spite of its interest, complexity and distinctiveness service experience and its research applied to mobile services, needs to be made in-‐depth. This study provides a quantitative study with a broader perspective of Mobile service experience.
3.
Research Design
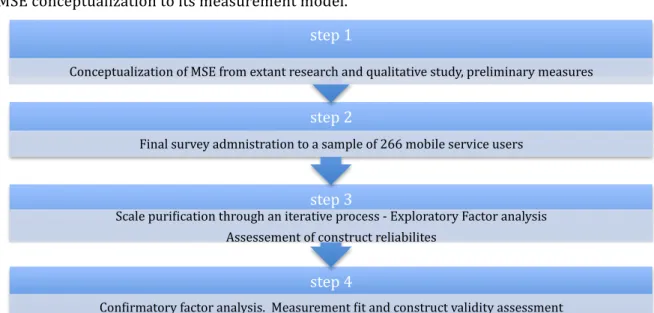
Accordingly, it is relevant to build a measurement model that can define experience factors driven by the service provider and that may have impact on experience outcome measures. In the diagram below research design is presented through the several steps developed from the MSE conceptualization to its measurement model.
Figure 1 Scale development to measure mobile service experience according to Parasuraman (2005)
step 4
Coneirmatory factor analysis. Measurement eit and construct validity assessment
step 3
Scale purieication through an iterative process -‐ Exploratory Factor analysis Assessement of construct reliabilites
step 2
Final survey admnistration to a sample of 266 mobile service users
step 1
The first step involved the definition of the Mobile Service Experience phenomenon as well as its domain from which scale items would stand. This stage involved the insight from a comprehensive literature review and an in-‐depth qualitative study (Sarmento and Patrício 2011). The survey questionnaire was built upon the rich set of MSE items identified in the qualitative study. In Step 2 the final survey was performed. Data analysis and the scale purification occurred in steps 3 and 4 in a process consistent with scale development procedures in order to develop the measurement model to mobile service experience (Parasuraman 2005; Hair, Black et al. 2009). The analysis involved exploratory factor analysis (EFA) and confirmatory factor analysis (CFA). In areas where little research has been done, such as mobile service experience, EFA is normally required to provide an a priori structure of the underlying dimensions of the constructs to be finalized using CFA.
4.
Mobile Service Experience scale
Conceptualizing MSE and preliminary measures (step 1)
The developmet of MSE conceptual domain involved literature review and an in-‐depth qualitative study (Sarmento and Patrício 2011). The study undertook 61 exploratory interviews with consumers of a new mobile service for managing loyalty programs -‐ those being marketing tools to promote service loyalty often supported by identity cards and rewards. These observations and interviews were important to increase the probability of producing valid measures, as they explored a large set of potential mobile experience factors that were later on used to develop the survey questionnaire. This study gathered their personal experiences through the several stages of service development. The MSE factors must be the main elements that the service provider can manipulate to promote good mobile experiences, this way facilitating the interactive process for the mobile offer. Starting from this preliminary and in-‐ depth qualitative research the theoretical model was formed considering the constructs obtained. Therefore the dimensions and indicators that formed the Mobile services experience domain provided a rich source of data from which items were thought for the MSE scale development in the following step.
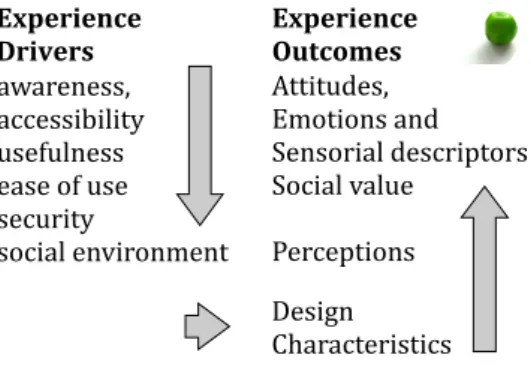
Figure 2 Framework for understanding the domain and consequences of mobile service experiences
This previous approach to the mobile service experience factors identified dimensions with a holistic perspective. Sarmento and Patrício (2011) identified six MSE dimensions: [1] Accessibility, also studied by Pagani (2004), joined the ‘time convenience’ and ‘portability’, which are representative experience factors for mobile services. Being a mobile service doesn’t mean being convenient because service accessibility can be affected and then restrict the quality of the experience. [2] Awareness assembled the capacity of the service to promote itself anticipating the desire to be ‘tried’ and reveal its ‘innovativeness’ and ‘informativeness’. These aspects were referred as well by Meuter, Bitner et al. (2005) as a desire to experiment a new service. [3] Usefulness and [4] Ease of use are common factors for HCI; although for this framework Usefulness attached the ‘store ability’, the ‘data management’ and the ‘service content’ compatibility to features like ‘rewards’ and ‘feedback’. So it was mainly considered the usefulness of the service within an overall experience perspective. Ease of use on the other hand, joined interface characteristics like ‘recognition’, ‘ease of learn’ this time considering different tangible platforms, or being ‘appealing’. So within this dimension it was considered also the usability aspects of the interface. [5] Security issues, like ‘contextual use’ and ‘data security’ and ‘privacy’, also referred by several authors, were mainly mentioned at the beginning of the study by potential customers and revealed not being so relevant for the regular users (Maamar 2006; Vlachos and Vrechopoulos 2008). On the contrary, [6] Social environment, revealed to be more relevant for the regular users after the service had been launched. This dimension assembled categories like social interaction with store assistants or with other customers, as well as being fashionable.
Therefore a list of potential indicators corresponding to the MSE definition, with an average of 8 items per individual construct, was measured through a scale with 7 points likert format, with the endpoints “strongly disagree” and “strongly agree” (Churchill 1979).
!"#$%&$'($) *%&+$%, !""#"$%&'() *+,"#,-').-%) /&-',0#.1)%&'20#3",0'( /,2#.1)4.1$& 5&02&3"#,-' 6&'#7-) 89.0.2"&0#'"#2' !"#$%&$'($) -./(01$, .:.0&-&''() .22&''#;#1#"< $'&=$1-&'' &.'&),=)$'& '&2$0#"<) ',2#.1)&-4#0,-+&-"
This survey instrument was subject to a qualitative pre-‐test for further refinement and improving its final validity. The pretest was administered to a sample of users of the Mobile loyalty service, who were expected to reply and understand the service concept. A 55 item questionnaire was emailed, gathering 36 participants enough to evaluate redundancy as well as sentence ‘structure of some items (DeVellis 2012).
Final Survey administration to mobile service users (step 2)
The final version of the questionnaire included 40 experience attributes that were evaluated with the same 7-‐point itemized scale mentioned above. Participation in the study was based on the respondents’ own initiative to get in touch with the mobile service’s newsletter and then access to the online questionnaire. Through this method of recruitment we gathered 266 inquiries to the call from around the world, being 20% on English and the other 80% in Portuguese, with 82% of mobile loyalty customers being men and 18% of women.
Table 1 Final Sample Profile n= 241
Age <=18 1,5% 19-‐28 10,6% 29-‐38 32,6% 39-‐48 30,4% 49+ 19,8% NA 5,3% Gender Men 82% Women 18%
Mobile Operative System
Symbian 13% Java 4% Iphone 37% Windows Mobile 16% Android 19% Windows Mobile 7 7% Don’t Know 3% Education High School 24% College 74% NA 2% Profession
Employed full time 78%
Employed part time 4%
Student 9% Retired 5% NA 4% Income Over 40 000$ 19% Between 12000$ & 40.000$ 31% Between $ 6000 & 12000$ 10% Under $6000 & 12000$ 4%
Scale purification through Exploratory Factor Analysis (step 3)
The preliminary Missing Value Analysis (MVA) involved the analysis by inquiry and by variable. In both analyses were found missing values, however, none of the analysis revealed significant issues. In the analysis by inquiry, were identified 25 respondents with missing values higher than 25% and they were eliminated from the sample of 266 respondents totalizing a final sample of 241 inquiries as described in table 1. Analyzing by variable, three variables had more than 20% missing values so were taken out from the analysis. After MVA, the scale development followed with exploratory factor analysis (EFA).
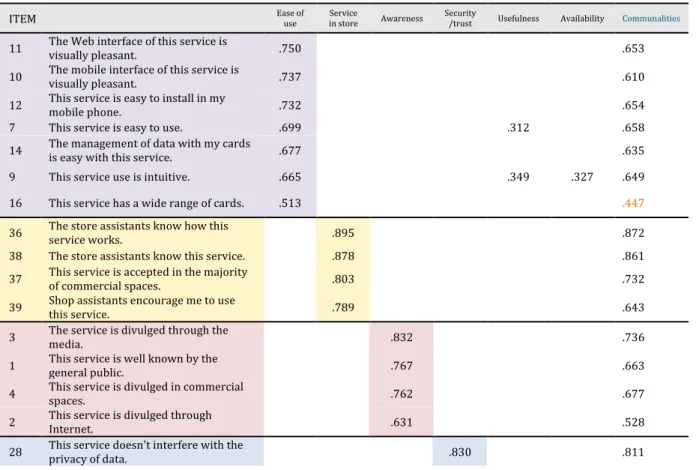
EFA was conducted to provide preliminary check on the number of dimensions and the pattern of loadings. EFA, using principles component with Varimax rotation, was performed on the 37 MSE attributes using SPSS 19.0. Items were retained if (1) they loaded .50 or more on a factor, (2) did not load more than .50 on two factors (Wolfinbarger and Gilly 2003; Hair, Black et al.
2009), and (3) in the reliability analysis, all extracted factors exceeded the Cronbach’s alpha
conventional minimum of .7 and indicated an item-‐to-‐total correlation of more than .50 (Nunnally and Bernstein 1994). This process allowed the re-‐arrangement of the remaining 23 items compared to the theoretical model. This iterative process of scale purification resulted in six dimensions, explaining 71,1 % of variance.
Table 2 Rotated Component Matrix
ITEM Ease of use Service in store Awareness Security /trust Usefulness Availability Communalities
11 The Web interface of this service is visually pleasant. .750 .653
10 The mobile interface of this service is visually pleasant. .737 .610
12 This service is easy to install in my mobile phone. .732 .654
7 This service is easy to use. .699 .312 .658
14 The management of data with my cards is easy with this service. .677 .635
9 This service use is intuitive. .665 .349 .327 .649
16 This service has a wide range of cards. .513 .447
36 The store assistants know how this service works. .895 .872
38 The store assistants know this service. .878 .861
37 This service is accepted in the majority of commercial spaces. .803 .732
39 Shop assistants encourage me to use this service. .789 .643
3 The service is divulged through the media. .832 .736
1 This service is well known by the general public. .767 .663
4 This service is divulged in commercial spaces. .762 .677
2 This service is divulged through Internet. .631 .528
27 The company that operates this service is trustful. .829 .837
26 The service is safe. .788 .747
20 With this service I don t need to carry cards with me. .747 .672
15 This service is useful. .343 .736 .716
21 This is convenient as it makes it easy to carry information. .319 .736 .745
23 This service is always available. .901 .906
22 This service is always accessible. .889 .898
Extraction Method: Principal Component
Analysis.
Rotation Method: Varimax with Kaiser
Normalization. 7 iterations
Cronbach's Alpha 0.869 0.895 0.764 0.877 0.759 0.932 0,897
All MSE scale dimensions, except Availability, included three or more items as suggested by Hair et al. (2009) as a good practice to proceed to CFA. Availability was retained due to its adequate reliability, high loadings, no cross-‐loadings and theoretical significance.
Confirmatory Factor Analysis (step 4)
Accordingly this quantitative analysis was then subject to Confirmatory Factor Analysis with the goal of investigating unidimensionality and sees how well the specification of the MSE matched the mobile services reality (Hair, Black et al. 2009). Each construct was specified, through the generated items that completely would confirm domains derived from the statistical results of
EFA. In the CFA, AMOS 17.0 software was used with maximum likelihood estimation (MLE). The
item - service has a wide range of cards (item 16 in Table 2) was excluded from the original model because it had not a clear theoretical relation with the ease of use’ construct and communalities below .5 (Blunch 2011). The item -‐ this service is easy to install in my mobile
phone (item 12 in Table 2) was excluded as well, as this usability issue has mainly to do with the
initial stage of the service use (to install) and improved the model fit.
The final MSE measurement model consisted of the 21 items shown in Table 3. The model showed good convergent validity as item loadings on their respective constructs all exceeded the .7 cut-‐off value and the average variance-‐extracted of each construct was higher than .5 (Nunnally and Bernstein 1994) except for Awareness with the lower loading of the item 2
divulged through Internet, but relevant theoretically (see Table 3). Following Hair et al.’s (2009)
suggestion, a more adequate construct reliability value (CR) than Cronbach’s α was computed. All MSE items revealed high internal consistency and reliability with construct reliability that exceeded .7.
Table 3 Mean rating values, CFA standardized loadings and fit statistics for the MSE scale
Item loading mean AVE CR
Ease of use
7 The service is easy to use. 0.817 5,65
9 The service use is intuitive. 0.798 5.86
11 The Web interface of the service is visually pleasant. 0.722 5.58
14 The management of data with my cards is easy with the service. 0.717 5.5
10 The mobile interface of the service is visually pleasant. 0.697 5.65 0.565 0.892
Service in store
36 The store assistants know how the service works. 0.950 2.67
38 The store assistants know the service. 0.934 2,64
37 The service is accepted in the majority of commercial spaces. 0.745 3.24
39 Shop assistants encourage me to use the service. 0.677 1.94 0.697 0.900
Awareness
3 The service is divulged by the media (newspapers, TV, radio). 0.751 3,24
1 The service is well known by the general public. 0.747 3.30
4 The service is divulged in commercial spaces. 0.711 2.54
2 The service is divulged through Internet. 0.596 4.59 0.495 0.795
Security /trust
27 The company that operates Cardmobili service is trustful. 0.893 5.56
28 The service doesn't interfere with the privacy of data. 0.856 5.20
26 The service is safe. 0.774 5.41 0.709 0.879
Usefulness
21 The service is convenient as it makes it easy to carry information. 0.825 6.18
15 Cardmobili service is useful. 0.793 6.26
20 With this service I don t need to carry cards with me. 0.612 4.85 0.561 0.728
Availability/accessibility
22 The service is always accessible. 0.945 5.58
23 The service is always available. 0.924 5.65 0.873 0.932
Fit index Degrees of freedom 174
χ2 324.946 *** cmin/ df 1,868
Goodness-‐of-‐fit (GFI) 0.892
Non-‐normed Fit index (NNFI or TLI) 0.937 -‐
Comparative Fit Index (CFI) -‐ 0.948
Standardized Root Mean Squared Residuals SRMR 0.0540
Root mean square error of approximation (RMSEA) 0.060
According to scale development guidelines, several indexes were used to assess the measurement model fit, see bottom of Table 3 (Hu and Bentler 1999; Hair, Black et al. 2009;
Marôco 2010). The χ2 values obtained were significant. Goodness-‐of-‐fit indexes -‐ GFI, CFI, NNFI -‐
globally approached or exceeded .9, which indicated that the model satisfactorily fit the data. Regarding “badness-‐of-‐fit measures”, RMSEA and standardized RMR presented also good values (Hair, Black et al. 2009). Considering Fornell and Larcker’s (1981) conservative test to analyze the scale’s discriminant validity, the variance-‐extracted estimates for all constructs were greater than the squared correlation estimate between the other constructs. For five of six factors, the average variance extracted exceeded the squared correlations with the remaining factors. Only
for Ease of use, which is the factor that our research suggests has the broadest and most varied
domain, was this criterion not met(see Table 4).
Table 4 Squared Correlation between Experience Factors constructs, standard errors and t-value
Ease of use Service in store Awareness Security Usefulness Availability
Ease of use .565
Service in store .220 .697
SE (.106) CR 2.989*** Awareness .331 .448 .495 SE (.097) (.156) CR 3.913*** 5.349*** Security .581 .355 .313 .709 SE (.109) (.144) (.125) CR 6.294*** 4.708*** 3.828*** Usefulness .728 .270 .259 .583 .561 SE (.138) (.149) (.128) (.156) CR 6.131*** 3.406*** 3.016*** 5.769*** Availability .480 .134 .154 .436 .395 .873 SE (.125) (.163) (.142) (.155) (.165) CR 5.605*** 1.928* 2.031* 5.458*** 4.540*** Discussion
Starting from the insights on the extant literature and using the means-‐end framework supported by the in-‐depth qualitative study, we conceptualize, construct, refine and test a multiple item scale MSE for measuring mobile service experiences. The sample selection was based on regular users of a mobile service being the research focused on pure-‐service offer and being this empirical ground, one of the first in the context of mobile platforms (Parasuraman 2005). It is expected that this scale will stimulate and facilitate additional research in this domain as it demonstrates good psychometric properties based on findings from a variety of reliability and validity tests.
The findings from the present study have several important and broad implications for practitioners. Data analysis allowed the identification of six MSE dimensions:
• ‘Awareness’ is the extent to which the service is promoted to be known and to promote itself near the different communication’ channels.
• ‘Availability’ is the level to which the service is available and accessible through space and time.
• ‘Usefulness’ is the degree of convenience to use the service with an overall experience perspective.
• ‘Ease of use’ is how the service is ‘ease to learn’, to deal with, or how ‘appealing’ it is. • ‘Security’ is the extent to which the service cares for the privacy of data and promotes
‘trust’ next to its customers.
• ‘Service in store’ is the way service takes place in the store environment, through the physical and social store’s interaction.
These results contribute with a broader view of the service experience. They put together technology-‐based requests with the concerning on people and process elements that integrate the service support. As a result Usefulness is a dimension that goes beyond the service mobile application and integrates the service’ concept and its utility. On the other hand Ease of use comprehends aspects of the physical service interface such as being appealing. Awareness -‐ states for different channels of communication to promote the service, not including a specific allusion for a technological trial ability, but standing before service usage. However, Availability -‐ is a dimension that has to do with service capacity to be everywhere at any time. Moreover -‐ Service in store -‐ incorporates a set of factors that completely fulfill MSE scale with a holistic view of experience with elements that commonly are not completely controlled by the mobile service provider.
5.
Research and Managerial implications
These results integrate strategic issues for the increasing mobile services area. The broader conceptualization of MSE involves both the moments before service usage as ‘Awareness’ and elements that are not in direct control of the mobile service provider like the ‘Service in store’. Although these elements belong to a context created by the service provider, they are not entirely controlled by him, and are crucial for a good customer experience (Pullman and Gross 2004). These results have also important managerial implications. Service designers should also have a broader view of service experience. New Service development must consider slower changes of mobile behaviors and designers must carefully integrate innovation through customer-‐centric experiences. The new ways to deliver services are not necessarily the increased mobile technologies but experience factors where service providers may get differentiation through a holistic perspective.
MSE scale concerns the conception of mobile services; It consciousness will be a good contribution to research with managerial implications, also having good influence on service experience outcomes.
6.
References
Blunch, N. J. (2011). Introduction to Structural Equation Modelling using SPSS and AMOS. London, SAGE.
Buchenau, M. and J. F. Suri (2000). Experience Prototyping. DIS ’00, Brooklyn, New York., ACM.
Churchill, G. A. and D. Iacobucci (2002). Marketing Research -‐ Methodological Foundations, Harcourt College.
Churchill, J. G. A. (1979). "A Paradigm for Developing Better Measures of Marketing Constructs." Journal of Marketing Research XVI: 64-‐73.
DeVellis, R. F. (2012). Scale Development theory and applications. LA, London, New Dehli, SAGE. Fenko, A., H. N. J. Schifferstein, et al. (2010). "Shifts in sensory dominance between various
stages of user–product interactions." Applied Ergonomics 41: 34–40.
Fornell, C. and D. F. Larcker (1981). "Structural Equation Models with Unobservable Variables and Measurement Error: Algebra and Statistics." Journal of Marketing Research
18(3 ): pp. 382-‐388 .
Gentile, C., N. Spiller, et al. (2007). "How to Sustain the Customer Experience:: An Overview of Experience Components that Co-‐create Value With the Customer." European Management Journal 25(5): 395-‐410.
Hair, J. F. J., W. C. Black, et al. (2009). Multivariate Data Analysis, Pearson.
Hair, J. J. F., W. C. Black, et al. (2009). Multivariate Data Analysis. New Jersey, Pearson Prentice Hall.
Helkkula, A. (2011). "Characterising the concept of service experience." Journal of Service Management 22 (3, 2011): 367-‐389.
Hippel, S. T. a. E. v. (2002). Customers as Innovators, A new way to create value. Harvard Business Review: 74-‐81.
Hu, L.-‐t. and P. M. Bentler (1999). "Cutoff Criteria for Fit Indexes in Covariance Structure Analysis: Conventional Criteria versus New Alternatives." Structural Equation Modeling 6(1): 1-‐55.
Klaus, P. and S. Maklan (2007). "The role of brands in a service-‐dominated world." The Journal of Brand Management 15: 115-‐122.
Kleijnen, M., A. Lievens, et al. (2009). "Knowledge Creation Through Mobile Social Networks and Its Impact on Intentions to Use Innovative Mobile Services." Journal of Service Research 12(1): 15-‐35.
Maamar, Z. (2006). "A mobile application based on software agents and mobile web services." Business Process Management Journal 12( 3): 311-‐329.
Marôco, J. (2010). Análise de Equações Estruturais, Fundamentos Teóricos Software e Aplicações. Pêro Pinheiro, Report Number.
Meuter, M. L., M. J. Bitner, et al. (2005). "Choosing Among Alternative Service Delivery Modes: An Investigation of Customer Trial of Self-‐Service Technologies." Journal of Marketing 69: 61–83.
Nunnally, J. C. and I. H. Bernstein (1994). Psychometric theory. New York, McGraw-‐Hill.
Nysveen, H., P. E. Pedersen, et al. (2005). "Intentions to use Mobile services: Antecedents and cross-‐service comparisons." Journal of the Academy of Marketing Science 33: 330-‐346. Nysveen, H., P. E. Pedersen, et al. (2005). "Explaining intention to use mobile chat services:
moderating effects of gender." Journal of Consumer Marketing 22(5): 247-‐256 .
Ostrom, A. L., M. J. Bitner, et al. (2010). "Moving Forward and Making aDifference: Research Priorities for the Science of Service." Journal of Service Research
Pagani, M. (2004). "Determinants of Adoption of third generation Mobile Multimedia Services." Journal of Interactive Marketing 18(3): 46-‐57.
Parasuraman, A. (2005). "E-‐S-‐QUAL a Multiple-‐Item Scale for acessing electronic Service Quality." Journal of Service Research: 213-‐233.
Pullman, M. E. and M. A. Gross (2004). "Ability of Experience Design Elements to Elicit Emotions and Loyalty Behaviors." Decision Sciences 35: 551-‐578.
Pura, M. (2005). "Linking perceived value and loyalty in location-‐based mobile services." Managing Service Quality Vol. 15 (No. 6).
R.S. Subramanya, B. K. Y. (2007). Enhancing the user experience in mobile phones. Computer: 114-‐117.
Sarmento, T. and L. Patrício (2011). Mobile Service Experience Prototyping: A holistic view of the service experience. 18th International Product Development Management Conference Delft, Holand.
Verhoef, P. C., K. N. Lemon, et al. (2008). "Customer Experience Creation: Determinants, Dynamics, and Management Strategies." Journal of Retailing: 31-‐41.
Verhoef, P. C., K. N. Lemon, et al. (2009). "Customer Experience Creation: Determinants, Dynamics and Management Strategies." Journal of retailing 85(1): 31-‐41.
Vlachos, P. A. and A. P. Vrechopoulos (2008). "Determinants of behavioral intentions in the mobile internet services market." Journal of Services Marketing 22(4): 280–291.
Wolfinbarger, M. and M. C. Gilly (2003). "eTailQ: dimensionalizing, measuring and predicting etail quality " Journal of Reatailing 79: 183-‐198.
Zomerdijk, L. G. and C. A. Voss (2009). "Service Design for Experience-‐Centric Services." Journal of Service Research XX(X) 1,16.