Ana Isabel Cristóvão Lopes
Ecological and biochemical responses of the amphipod
Gammarus locusta after chronic exposure to sertraline
Dissertação de candidatura ao grau de
Mestre em Toxicologia e Contaminação
Ambientais submetida ao Instituto de
Ciências Biomédicas Abel Salazar da
Universidade do Porto
Supervisor – Teresa Neuparth
Categoria – Investigadora Post-doc
Afiliação
– Centro Interdisciplinar de
Investigação Marinha e Ambiental.
Co-Supervisor – Miguel Santos
Categoria - Investigador Auxiliar e
Professor Auxiliar Convidado
Afiliação
– Centro Interdisciplinar de
Investigação Marinha e Ambiental e
Departamento de Biologia, Faculdade
de Ciências da Universidade do Porto.
i
AGRADECIMENTOS
À Doutora Teresa Neuparth pelo seu apoio constante, atenção dispensada, paciência, e orientação deste projeto.
Ao Professor Doutor Miguel Santos pelo seu apoio indispensável nesta parte final.
Ao Professor Doutor Jorge Oliveira e à Doutora Ana Rocha pela sua disponibilidade e ensinamentos transmitidos.
Ao João Tiago pelo constante incentivo e encorajamento, durante todo este período.
Às pessoas grupo de Disruptores Endócrinos e Contaminantes Emergentes do CIIMAR, em especial ao Ricardo Capela e Ana André, pelas suas sugestões e ajuda insubstituível ao longo deste projeto.
iii
ABSTRACT
The presence of pharmaceuticals in the aquatic environment have raised concerns due to their possible threats to aquatic organisms. Currently, there is a lack of information about the adverse effects of pharmaceuticals in non-target organisms, mainly regarding long-term exposure at environmentally relevant concentrations. Selective serotonin reuptake inhibitors (SSRI) are among the most widely prescribed antidepressants worldwide and they have been detected at low levels in several aquatic systems. Nevertheless, the knowledge regarding chronic sublethal effects of SSRI in non-target aquatic organisms is scarce. In humans, SSRI are designed to treat psychiatric disorders by modulating the neurotransmitter serotonin. However, in aquatic invertebrates, it seems to disrupt several biological functions such as reproduction, behavioural patterns and metabolism, among others. Sertraline (SER) was the SSRI selected for this ecotoxicological assay due to being described as the most toxic SSRI in some aquatic organisms.
The aim of this study is the assessment of the ecotoxicological responses of the amphipod Gammarus locusta (Crustacea, Amphipoda, Gammaridae) chronically exposed to ecologically relevant concentrations of sertraline. A chronic bioassay (48 days) was conducted at low levels of SER (8, 40, 200, 1000 ng/L). An integration of ecological endpoints (survival, sex ratio, growth, reproduction and behaviour) and biochemical-level endpoints (glutathione S-transferase, catalase, superoxide dismutase, lipid peroxidation and acetylcholinesterase) was performed.
SER affected the amphipods’ growth and lead to a non-monotonic response in activity of some biochemical markers. The most predominant effect of SER was a significant impact on females’ behaviour exposed to 1000 ng/L SER. These results demonstrate that SER induces chronic effects on G. locusta, which may affect the wild populations of this species. The data here presented will further improve the understanding of the low level effects of SER in aquatic ecosystems; contributing for the advancement on the field of pharmaceutical risk assessment. Further studies should, however, be undertaken to provide additional insight into the multigenerational effects of SER, as well as on the toxicological mode of action SER in non-target organisms.
iv
RESUMO
A presença de fármacos no ambiente aquático tem suscitado uma grande preocupação, devido às suas possíveis ameaças para os organismos aquáticos. Atualmente há uma falta de informação sobre os efeitos adversos dos fármacos em organismos não-alvo, principalmente no que toca às exposições crónicas a concentrações ambientalmente relevantes. Os inibidores seletivos da recaptação da serotonina (ISRSs) estão entre os antidepressivos mais prescritos e têm sido detetados em vários sistemas aquáticos em concentrações residuais, ao nível do ng/L. No entanto, o conhecimento sobre os efeitos subletais crónicos que os ISRSs podem provocar em organismos não-alvo é escassa. Em humanos, os ISRSs são concebidos para o tratamento de problemas de índole psiquiátrica através da modulação do neurotransmissor serotonina. Contudo, em invertebrados aquáticos, parece modificar várias funções biológicas tais como a reprodução, padrões comportamentais e metabolismo, entre outros. A sertralina (SER) foi o ISRS selecionado para este ensaio ecotoxicológico por ser descrito como o mais tóxico em alguns organismos aquáticos.
O objetivo deste estudo é avaliar as respostas ecotoxicológicas do anfípode
Gammarus locusta (Crustacea, Amphipoda, Gammaridae) durante uma exposição crónica
à sertralina, usando concentrações ecologicamente relevantes. Com este propósito, uma exposição de 48 dias foi realizada com baixas concentrações de sertralina (8, 40, 200, 1000 ng/L). Foram analisados os efeitos provocados pela exposição da sertralina utilizando
respostas ecológicas (sobrevivência, sex-ratio, crescimento, reprodução e comportamento)
e bioquímicas (glutationa S-transferase, catalase, superóxido dismutase, peroxidação lipídica e acetilcolinesterase).
SER afetou o crescimento dos anfípodes e causou uma resposta não-monotónica na atividade de alguns marcadores bioquímicos. O efeito mais evidente da sertralina consistiu na alteração da atividade de fêmeas quando expostas a 1000 ng/L de SER. Os resultados evidenciam que a exposição crônica de G. locusta a SER causa efeitos a concentrações ecologicamente relevantes e que estas poderão potencialmente afetar as populações no ambiente natural. Os resultados aqui apresentados permitirão melhorar a compreensão dos efeitos de baixas concentrações da SER em ecossistemas aquáticos; contribuindo assim para um melhor conhecimento sobre o risco deste fármaco. Novos estudos devem, contudo, ser efetuados para fornecer esclarecimentos adicionais sobre os efeitos multigeracionais de SER, bem como clarificar o modo de ação em organismos não alvo.
v
ABBREVIATIONS AND ACRONYMS
µg Microgram
AChE Acetylcholinesterase ANOVA Analysis of variance
BHT Butylated hydroxytoluene BSA Albumin bovine serum CAT Catalase
CDNB 1-chloro-2,4-dinitrobenzenE cm Centimetre
CuSO4 Copper(II) sulfate
EC50 Median Effective Concentration EDTA Ethylenediaminetetraacetic acid
EU European Union FLU Fluoxetine FLU-d5 Fluoxetine-d5
fps Frames per second GSH Reduced glutathione
GST Glutathione-S -transfereses H2O2 Peroxide of hydrogen
IS Internal Standard K2HPO4 Dipotassium phosphate KNaC4H4O6•4H2O Potassium sodium tartrate
L Litre
LC50 Median lethal concentration
LC-MS/MS Liquid chromatography-tandem mass spectrometry LOEC Lowest observed effect concentration
Log KOC Soil Organic Carbon-Water Partition Coefficient Log KOW Octanol-Water Partition Coefficient
LPO Lipid peroxidation M Molar
MDA Malondialdehyde min Minutes
Na2CO3 Sodium carbonate NaOH Sodium hydroxide
ng Nanogram nm Nanometer
vi NOEC No observed effect concentration
O2•− Superoxide radical
OECD Organisation for Economic Co-operation and Development PPCPs Pharmaceuticals and Personal Care Products
ROS Reactive oxygen species s Seconds
SER Sertraline
SIR Selected Ion Recording SOD Superoxide dismutase
SPE Solid phase extraction
SSRIs Selective Serotonin Reuptake Inhibitors TBA Thiobarbituric acid
TBARS Tiobarbituric acid reactive substances TCA Trichloroacetate
vii
CONTENTS
Agradecimentos ... i
Abstract ... iii
Resumo ... iv
Abbreviations and Acronyms ... v
Figure List ... ix
Table List ... x
1 Introduction ... 1
1.1 State of art of pharmaceuticals in aquatic environment ... 1
1.1.1 Source and fate of pharmaceuticals in environment ... 2
1.1.2 Selective serotonin re-uptake inhibitors: sertraline ... 4
1.1.3 Ecotoxicity of sertraline ... 5
1.2 The use of Gammarus locusta in ecotoxicological studies ... 8
1.3 Methodologies used in the study ... 9
1.3.1 Ecological Endpoints ... 9
1.3.2 Biochemical endpoints ...10
1.4 Objectives ...10
2 Materials and methods ...11
2.1 Amphipod culture ...11 2.2 Chemicals ...11 2.3 Experimental bioassay ...11 2.3.1 Experimental design ...11 2.4 Ecological endpoints ...12 2.5 Biochemical endpoints ...13 2.5.1 Protein determination ...13 2.5.2 Glutathione-S-transferase ...14 2.5.3 Catalase ...14 2.5.4 Superoxide dismutase ...14 2.5.5 Lipid peroxidation ...15 2.5.6 Acetylcholinesterase ...16 2.6 Sertraline quantification ...16 2.6.1 Sample extraction ...16 2.6.2 LC-MS/MS ...17
viii 2.7 Statistical analysis ...18 3 Results ...19 3.1 Ecological endpoints ...19 3.2 Biochemical endpoints ...21 3.2.1 Antioxidant biomarkers ...21 3.2.2 Neurotransmission biomarker ...23 3.3 Sertraline quantification ...23 4 Discussion ...24 4.1 Ecological endpoints ...25 4.2 Biochemical endpoints ...28 4.3 Sertraline quantification ...30
5 Conclusions and Future work...31
ix
FIGURE LIST
Figure 1: Schematic of sources and fates of PPCP’s in environment (Adapted from: Ellis, 2006; Lapworth et al., 2012;). --- 3 Figure 2: A couple of Gammarus locusta --- 8 Figure 3: Representation of the hierarchy of responses to an exposure. (Adapted from Van der Oost et al. 2003). --- 9 Figure 4: Percentage of survival of Gammarus locusta males and females after chronic exposure to sertraline. Error bars indicate the standard errors. --- 19 Figure 5: Sex ratio of Gammarus locusta after chronic exposure to sertraline. Error bars indicate the standard errors. --- 19 Figure 6: Chronic effects of SER on Gammarus locusta growth after a chronic exposure in (A) females and (B) males. Error bars indicate the standard errors. Differences between results are identified by different letters. --- 20 Figure 7: Cumulative number of newborns per female. Error bars indicate the standard errors. --- 20 Figure 8: Total distance travelled and average speed for Gammarus locusta males and females after a chronic exposure to sertraline. Error bars indicate the standard errors. Asterisks indicate significant differences from control group (p<0.05) --- 21 Figure 9: Levels of glutathione S transferase (GST), catalase (CAT) and superoxide dismutase (SOD) activities determined in Gammarus locusta males and females after a chronic exposure to sertraline. Error bars indicate the standard errors. Differences between treatments are identified by different letters --- 22 Figure 10: Lipid peroxidation (LPO) levels determined in Gammarus locusta males and females after a chronic exposure to sertraline. Error bars indicate the standard errors. Differences between treatments are identified by different letters. --- 22 Figure 11: Acetylcholinesterase (AChE) activity determined in Gammarus locusta males and females after a chronic exposure to sertraline. Error bars indicate the standard errors. --- 23
x
TABLE LIST
Table 1: Properties of sertraline (Adapted from: DeVane et al., 2002). --- 4
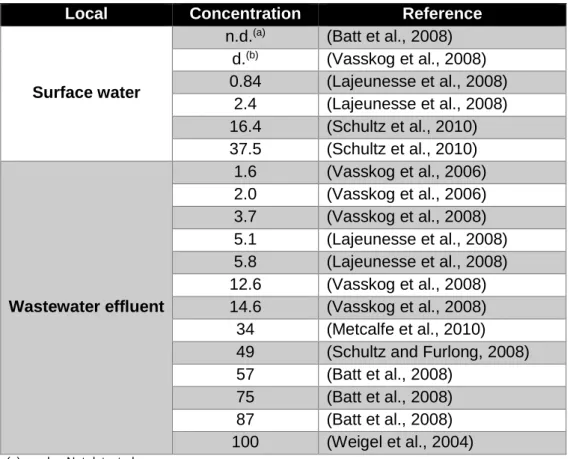
Table 2: Environmental concentrations of sertraline reported in literature (ng/L). --- 6
Table 3: Sertraline toxicological endpoints reported in literature. --- 7
Table 4: Mass spectrometer settings [M+H+] --- 17
Table 5: Nominal and measured concentrations of sertraline in water samples collected in duplicate from each treatment. Data expressed as mean (ng/L) ± standard error --- 23
1
1 INTRODUCTION
1.1 STATE OF ART OF PHARMACEUTICALS IN AQUATIC ENVIRONMENT
Awareness regarding pharmaceuticals in the aquatic environment was only possible in the 90’s due to advance of chemical analysis technology, which allows for the detection of these compounds at trace-level concentrations (Calisto and Esteves, 2009; Christen et al., 2010; Santos et al., 2010). The detection of pharmaceuticals in environment has been a growing concern due to the amount of new pharmaceuticals that are present at trace levels (Monteiro and Boxal, 2010). Pharmaceuticals are designed to produce specific biological effects in specific targets, being used for the prevention, diagnosis or treatment of diseases in humans and animals (Monteiro and Boxal, 2010). They may negatively affect non-target organisms if the molecular target, such as a receptor or enzyme, is conserved or if they have a homologous target, resulting in a specific pharmacological effect. This concept is known as read-across hypothesis (Christen et al., 2010; Ford and Fong, 2015; Franzellitti et al., 2014; Gunnarsson et al., 2012; Rand-Weaver et al., 2013). Pharmaceuticals have been found at low concentrations in the aquatic systems, so the adverse effects of these compounds in wild species seems to be a consequence of high-affinity interactions. The aquatic organisms that possess the pharmaceuticals’ target preserved are most likely to be affected by pharmaceuticals, in comparison with species that do not have it (Gunnarsson et al., 2012). Thus, if the genome of non-target organisms is known, it becomes easier to predict whether the pharmaceutical has an effect. In particular, it is necessary to know if the organism has the target gene(s) in which the pharmaceutical will trigger their pharmacological activity. It is documented that aquatic vertebrates, such as Xenopus tropicalis and Danio rerio hold 80% of pharmaceutical molecular targets. This value is slightly lower for the invertebrates, being around 60% in
Daphnia pulex (Gunnarsson et al., 2012; Rand-Weaver et al., 2013). Besides the
pharmacodynamics response that may be detectable in non-target organisms it is fundamental to consider that side effects may also occur (Franzellitti et al., 2014).
The exposure of aquatic organisms to pharmaceuticals occurs at low concentrations, within ng/L to µg/L range; so, lethal effects are not observed because these usually occur at higher concentrations in the order of mg/L, far from ecologically relevant. It is, therefore, most pertinent analyse sub-lethal and chronic effects of pharmaceuticals, since aquatic organism are continuously exposed to them at low concentrations, during their entire lifecycle or over multiple generations (Lamichhane and Garcia, 2014), which can lead to more serious consequences. So it is important to ascertain the potential long-term risks
2 of pharmaceuticals in aquatic organisms. However, previous research focused mainly in acute exposures (Ankley et al., 2007; Franzellitti et al., 2013), with concentrations above those found in the environment (Ankley et al., 2007; Kümmerer, 2010). Currently, there is still a low number of studies that report significant effects under environmentally realistic concentrations. As the concentrations of these compounds are very low in aquatic systems, studies indicate that these concentrations are well below of acute toxic levels, but there are uncertainties regarding the effects of chronic exposures (Franzellitti et al., 2013). Therefore, there is a need to focus on low-level and long term exposure assessment to better judge the implications of pharmaceuticals in aquatic environments (Lamichhane and Garcia, 2014).
1.1.1 SOURCE AND FATE OF PHARMACEUTICALS IN ENVIRONMENT
Currently, there are thousands of active compounds being commercialized in the European Union (EU) (Calisto and Esteves, 2009), between these, nearly 3000 are used for human medicine (Christen et al., 2010; Fent et al., 2006). Pharmaceuticals have been found in several aquatic systems around the world (Kosma et al., 2014; Zhang et al., 2014). Their distribution is widespread and influenced by the consumption patterns (Silva et al., 2014). After ingestion, some pharmaceuticals are metabolized while others remain in an unmetabolized form until they are eliminated (Kümmerer, 2010; Monteiro and Boxal, 2010). After their elimination, pharmaceuticals and their metabolites are discharged in hospital or municipal wastewater treatment plants (WWTPs), where removal processes will be applied (Monteiro and Boxal, 2010). The pharmaceuticals’ removal from WWTPs depends of their physicochemical characteristics, so many of them aren’t completely removed. Moreover, the efficiency of same compound removal is variable (Fent et al., 2006; Monteiro and Boxal, 2010; Zhang et al., 2014). This happens due to differences in WWTPs equipment and treatment protocols used as well as due to external factors such as weather conditions (Fent et al., 2006; Santos et al., 2007). Usually, the WWTPs use primary and secondary treatment stages for the removal process of pharmaceuticals; sometimes, it is also applied a tertiary treatment (Monteiro and Boxal, 2010). The first stage consists of a mechanical treatment where solids and greases are removed by coagulation and sedimentation processes (Monteiro and Boxal, 2010; Oulton et al., 2010; Santos et al., 2007). The secondary stage decreases the dissolved organic matter by activated sludge and biological filters (Monteiro and Boxal, 2010; Santos et al., 2007). It is in this stage that most pharmaceuticals are removed due to the activated sludge’s action (Monteiro and Boxal, 2010). In most advanced WWTPs, it is generally applied a third stage. This allows the nutrient reduction, such as
3 nitrates and phosphates, through chemical processes (Monteiro and Boxal, 2010; Santos et al., 2007).
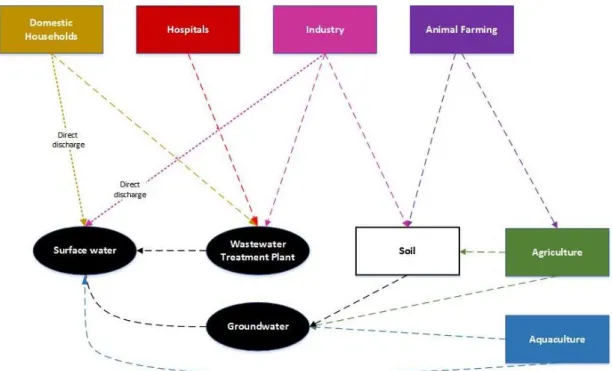
After these treatments, the wastewater gets in the aquatic environment. However, these treatments are not specific for pharmaceuticals’ removal. So, as a consequence of an ineffective removal, pharmaceuticals have been found in the aquatic environment (Zhang et al., 2014). Still, the WWTPs contribute to the decrease of pharmaceutical concentrations in aquatic systems (Monteiro and Boxal, 2010). There are other sources of pharmaceuticals in the aquatic environment which are considered minor such as those from manufacturing processes and distribution (Ellis, 2006; Monteiro and Boxal, 2010), the direct input through aquaculture facilities (Christen et al., 2010; Ellis, 2006; Fent et al., 2006) and the farming and agricultural activities. The last one includes the direct excretion of animals in the field (Christen et al., 2010; Kümmerer, 2010), the application of manure (Christen et al., 2010; Fent et al., 2006) or of sewage sludge (Fent et al., 2006; Monteiro and Boxal, 2010) as fertilizers in agricultural activities (Figure 1). These contaminants flow into aquatic systems without going through any prior treatment (Ellis, 2006; Fent et al., 2006).
Considering these scenarios, pharmaceuticals have been present in several aquatic systems like WWTPs’ effluents, surface water, groundwater and in drinking water (Christen et al., 2010; Fent et al., 2006). With the intention of removing their presence in the aquatic environment, it is necessary to achieve higher effectiveness in WWTPs treatments as well as a greater knowledge of “green pharmacy” where the development of easily degradable pharmaceuticals would be possible (Kümmerer, 2009).
Figure 1: Schematic of sources and fates of PPCP’s in environment (Adapted from: Ellis, 2006; Lapworth et al., 2012;).
4
1.1.2 SELECTIVE SEROTONIN RE-UPTAKE INHIBITORS: SERTRALINE
One of the most prescribed group of pharmaceuticals are the psychiatric drugs, specifically the antidepressants (Calisto and Esteves, 2009). These compounds have therapeutic effects on the nervous system, regulate behaviour, reproduction and neuro-endocrine responses of the target organisms (Calisto and Esteves, 2009).
In average all of the EU member states increased the consumption of antidepressants by 80% in the last decade (OECD, 2012). Portugal has the highest use of antidepressants of the EU countries, with more 15% of the average reported for the EU countries (Eurobarometer, 2010). Currently, the antidepressants most prescribed in worldwide are the selective serotonin re-uptake inhibitors (SSRIs) (Silva et al., 2012), that have been commercialized since 1980’s (Silva et al., 2015). Among the SSRI, Fong and Ford, (2014) reported that sertraline (SER) is one of the most commonly prescribed antidepressants in the world. In United States the consumption of SER arise and became the 3rd psychiatric drug more prescribed (Lamichhane and Garcia, 2014). In Portugal the most consumed antidepressant was fluoxetine (FLU) until 2008. From that moment on, SER has been the most prescribed antidepressant in Portugal (Furtado, 2012).
Sertraline, fluoxetine, citalopram, paroxetine and fluvoxamine are among the SSRIs (Lamichhane and Garcia, 2014; Silva et al., 2012). The SSRIs are used as antidepressants for the treatment of psychiatric disorders in humans (Brooks, 2014; Lamichhane and Garcia, 2014) like depression, obsessive-compulsive behaviour, anxiety, personality disorders and others (Bossus et al., 2014; Di Poi et al., 2013; Rodrigues et al., 2015). The SSRI acts by inhibiting serotonin reuptake on cell membranes leading to elevated levels of serotonin in the nerve synapses, stimulating serotoninergic neurons (Fent et al., 2006; Henry and Kwon, 2004). The serotonin is a neurotransmitter responsible for influencing the proper operation of the nervous and hormonal systems (Fent et al., 2006; Franzellitti et al., 2013; Minagh et al., 2009). Additionally, this neurotransmitter can change appetite, influence behaviour and modify sexual function (Fent et al., 2006). This pathways seems to be well conserved across
Table 1: Properties of sertraline (Adapted from: DeVane et al., 2002).
Formula C17H17NCl2
Molecular weight 305.07 g/mol
Biological Half-life 26 hours
Solubility 3.52 mg/L
Log KOW 1.37
Log KOC 4.17
5 metazoans and is found in both vertebrates and invertebrates, although the mode of action is not known for all species (Campos et al., 2012; Silva et al., 2015).
It is known that SSRIs have undesirably effects on the non-target organisms. In aquatic organisms it is reported that SSRIs can alter several biological functions. Among them are: alteration of reproduction pattern in Daphnia magna (Flaherty and Dodson, 2005) and Ceriodaphnia dubia (Brooks et al., 2003a) induction of spawning in zebra mussels
Dreissenna polymorpha and fingernail clams Sphaerium striatinum (Fong, 1998) cause
abnormalities in the embryonic development of Japanese medaka Oryzias latipes (Brooks et al., 2003a), cause delay in sexual maturation in male goldfish Carassius auratus (Mennigen et al., 2010), affect the metabolism in the mussel Lampsilis fasciola (Hazelton et al., 2014) and decrease the growth of the fish Pimephales promelas (Stanley et al., 2007). Some behaviour alterations were also associated with action of SSRI such as aggressiveness in decapod crustaceans (Doernberg et al., 2001), alteration of ventilation and swimming activities of Gammarus pulex (De Lange et al., 2009, 2006) and affect the cilia action in gastropods Physa elliptica (Uhler et al., 2000). Several authors have reported that some SSRI tend to bioaccumulate in aquatic organisms, in particular in fish (Brooks et al., 2005) and bivalves (Franzellitti et al., 2014). Most of the SSRI studies focuses on FLU, while there are few studies addressing the effects of SER in aquatic organisms (Park et al., 2012).
SER (Table 1) was the SSRI selected for this study, because it is reported to be the most toxic of this class to the aquatic species (Conners et al., 2009; Minagh et al., 2009; Park et al., 2012). SER is detected at low concentrations in the environment, at ng/L range (Table 2).
1.1.3 ECOTOXICITY OF SERTRALINE
Studies about the antidepressants effects in non-target aquatic organism are needed. Currently, the ecotoxicological research about antidepressants focuses mainly on acute toxicity assays (Franzellitti et al., 2013) and uses higher concentrations than those that are currently found in the environment. Thus chronic toxicity and potential subtle effects are slightly known (Fent et al., 2006). However, considering that aquatic organisms are uninterruptedly exposed to these compounds, a chronic approach is more relevant (Ankley et al., 2007).
Since the adverse effects of antidepressants, namely SSRI, are not completely known, their impacts in aquatic environment are difficult to predict (Zhang et al., 2014). As SSRI act through the regulation of serotonin and since this neurotransmitter is present in both vertebrate and invertebrate (Fent et al., 2006), effects in aquatic organisms are expected. As previously mentioned, SER was found to be the most toxic SSRI for aquatic
6 organisms (Christensen et al., 2007; Henry and Kwon, 2004). In literature, it is documented that SER has been detected in tissues of aquatic organisms, such as crabs (Rodrigues et al., 2015) and of fish (Brooks et al., 2005; Schultz et al., 2011). So, the toxicity of SER is potentially greater for these aquatic organisms that accumulate this compound.
The toxicity effects of SER were described in several studies. Henry et al. (2004) showed that 8 days exposure to SER lead to a lower number of neonates per female in C
dubia. Also, Lamichhane and Garcia (2014) showed that, an chronic exposure to SER leads
to fecundity and growth effects in C dubia, in addition to multigenerational effects (Lamichhane and Garcia, 2014). The assess of the effects of SER on ecological endpoints revealed a reduced growth in tadpoles Xenopus laevis in a chronic assay consisting of 70 days of exposure (Conners et al., 2009). This reduced growth was also observed in tadpoles
Lithobates sylvaticus when these were raised with conspecifics (Carfagno and Fong, 2014).
Modifications in behaviour were also described after a SER exposure. In Echinogammarus
marinus a significant increase in velocity was detected after 1 day of exposure (Bossus et
al., 2014). In male fathead minnows an increase of shelter-seeking behaviour was seen after a chronic 28 days exposure (Valenti et al., 2012). The main toxicological data of SER are summarized in table 3. The data from table 3 shown that there is a lack of knowledge
Table 2: Environmental concentrations of sertraline reported in literature (ng/L).
Local Concentration Reference
Surface water
n.d.(a) (Batt et al., 2008) d.(b) (Vasskog et al., 2008) 0.84 (Lajeunesse et al., 2008) 2.4 (Lajeunesse et al., 2008) 16.4 (Schultz et al., 2010) 37.5 (Schultz et al., 2010) Wastewater effluent 1.6 (Vasskog et al., 2006) 2.0 (Vasskog et al., 2006) 3.7 (Vasskog et al., 2008) 5.1 (Lajeunesse et al., 2008) 5.8 (Lajeunesse et al., 2008) 12.6 (Vasskog et al., 2008) 14.6 (Vasskog et al., 2008) 34 (Metcalfe et al., 2010) 49 (Schultz and Furlong, 2008) 57 (Batt et al., 2008)
75 (Batt et al., 2008) 87 (Batt et al., 2008) 100 (Weigel et al., 2004)
(a) n.d. – Not detected
7 about the chronic effects of SER in aquatic organisms, particularly at environmentally relevant concentrations.
Table 3: Sertraline toxicological endpoints reported in literature.
Species Concentration (µg/L) Parameter measured Toxicological endpoint Exposure time Reference Ceriodaphnia dubia
45 LOEC(a) Reproduction 8 days (Henry and
Kwon, 2004) 9 NOEC(b) Reproduction 8 days (Henry and
Kwon, 2004) 120 LC50(c) Mortality 48 hours (Henry and
Kwon, 2004) 53.4 LOEC Fecundity and growth (1st and 2nd generation) 7 days (Lamichhane and Garcia, 2014) 4.8 LOEC Fecundity and growth (3rd generation) 7 days (Lamichhane and Garcia, 2014) Daphnia magna
66 EC50(d) Reproduction 21 days (Minagh et
al., 2009) 100 LOEC Reproduction 21 days (Minagh et
al., 2009) 120 LC50 Lethality 21 days (Minagh et
al., 2009) 32 NOEC Lethality 21 days (Minagh et
al., 2009) 100 LOEC Lethality 21 days (Minagh et
al., 2009)
Echinogammarus marinus
0.01 LOEC Velocity 24 hours (Bossus et al., 2014) 0.001 NOEC Velocity 24 hours (Bossus et
al., 2014)
Thamnocephalus platyurus
400 NOEC Lethality 24 hours (Minagh et al., 2009) 600 LOEC Lethality 24 hours (Minagh et
al., 2009)
Oncorhynchus mykiss
380 LC50 Lethality 96 hours (Minagh et
al., 2009) 320 LOEC Lethality 96 hours (Minagh et
al., 2009) 100 NOEC Lethality 96 hours (Minagh et
al., 2009)
Pimephales promelas
80.3 EC50 Feeding rate 7 days
(Valenti et al., 2009) 3 LOEC Behaviour pattern 28 days (Valenti et al., 2012)
8 Table 4: Continued Species Concentration (µg/L) Parameter measured Toxicological endpoint Exposure time Reference Xenopus laevis
0.1 LOEC Growth 70 days (Conners et al., 2009) 0.1 LOEC Development 70 days (Conners et
al., 2009)
(a) LOEC - Lowest Observed Effect Concentration (b) NOEC - No Observed Effect Concentration
(c) LC50 - Median Lethal Concentration
(d) EC50 - Median Effective Concentration
1.2 THE USE OF
G
AMMARUS LOCUSTA IN ECOTOXICOLOGICAL STUDIESGammarids are crustacean amphipods with a wide distribution in aquatic environments, having been found in marine, freshwater and estuarine habitats (Whiteley et al., 2011). These organisms are particularly abundant and widely spread in the northern hemisphere (Hou et al., 2007; Whiteley et al., 2011). They fulfil an important role in the aquatic ecosystem, especially in food chains and in the decomposing of particulate organic matter (Bossus et al., 2014; De Lange et al., 2006), they are an important food source for fishes, birds, amphibians, seals and invertebrate species (Peschke et al., 2014; Vellinger et al., 2012; Whiteley et al., 2011), which significantly contributes to its high ecological value
(Costa et al., 1998; Vellinger et al., 2012). Due to these features, gammarids are refereed as an important representative of invertebrates (Peschke et al., 2014).
Gammarids have been used in ecotoxicology studies due to their sensitivity to an extensive variety of contaminants (Geffard et al., 2010; Neuparth et al., 2014b; Peschke et al., 2014). Furthermore, they are easy to maintain in the laboratory (Geffard et al., 2010; Whiteley et al., 2011), have short generation time (Minagh et al., 2009; Peschke et al., 2014) and exhibit high reproductive rates (Neuparth et al., 2014b; Peschke et al., 2014). Moreover, these organisms have the benefit of not causing ethical problems as fish and other invertebrates (Neuparth et al., 2014b). These amphipods have been used as sentinel, indicating changes in environmental parameters. There is an increase of research using these organisms (Whiteley et al., 2011).
The Gammarus genus has been used in several ecotoxicological research (Costa et al., 1998; De Lange et al., 2006; Neuparth et al., 2014b, 2005; Peschke et al., 2014; Vellinger et al., 2012). In Europe, there is an estimated occurrence of 100 species of Gammarus genus Figure 2: A couple of Gammarus
9 (Hou et al., 2007), among them is the Gammarus locusta (L., 1758) (Figure 2) (Neuparth et al., 2014b). This species is epibenthic and shows a wide geographic distribution appearing in locations from northern Norway to southern Portugal (Costa et al., 2004, 1998; Neuparth et al., 2014b; Whiteley et al., 2011) and is quite abundant in the Sado estuary (Costa et al., 1998). The presence of this specie in Portuguese coast, along with its ecological importance and its sensitivity to contamination, make G.locusta the chosen organism to perform the study presented in this thesis.
1.3 METHODOLOGIES USED IN THE STUDY
The chronic sub-lethal effects of SER were investigated through the analysis of ecological endpoints (survival, sex-ratio, growth, reproduction and behaviour analysis) and biochemical markers (glutathione S-transferase (GST), catalase (CAT), superoxide dismutase (SOD), lipid peroxidation (LPO) and acetylcholinesterase (AChE).
1.3.1 ECOLOGICAL ENDPOINTS
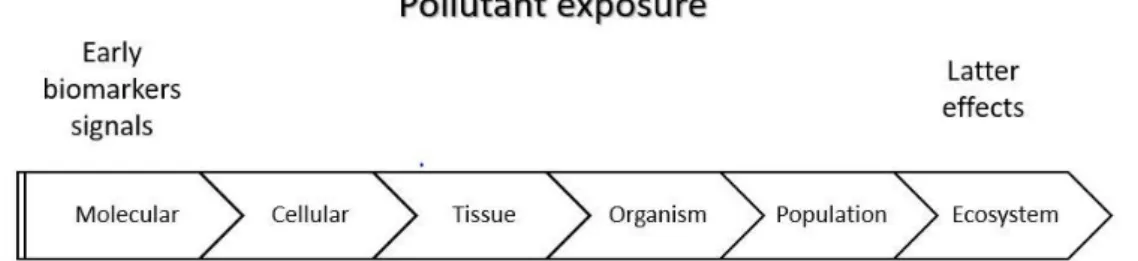
When it becomes evident that a contaminant negatively affects the population, it is difficult to take precautionary measures because the consequences of exposure reached a point where it is no longer possible to reverse the risk (Van der Oost et al., 2003). So, it is necessary to study the effects in a lower level of the biological hierarchy (Figure 3). Generally, in ecotoxicological assays, a battery of traditional ecological endpoints such as survival, sex ratio, individual growth and reproduction are applied. These endpoints were chosen in this study for being sensitive and for allowing the detection of effects at low levels of contaminants. It is described in the literature that SER causes behavioural modifications, the behaviour analysis was also considered in this thesis to assist the interpretation of the responses observed in the traditional ecological endpoints (survival, growth and reproduction).
Figure 3: Representation of the hierarchy of responses to an exposure. (Adapted from Van der Oost et al. 2003).
10
1.3.2 BIOCHEMICAL ENDPOINTS
As a valuable complementary approach to the ecological endpoints typically analysed in ecotoxicological assays, biomarkers analyses were performed. Biomarkers related to biotransformation, oxidative stress and neurotransmission were selected because they could provide information about the health status of the organism. Moreover, the SER mechanism of action might interfere with oxidative stress and the AChE activity (Xie et al., 2015).
Antioxidant enzymes were analysed for being essential in maintaining the cellular homeostasis whenever oxidative stress occurs. The antioxidant enzymes selected were CAT and SOD activity for being the leading agents in preventing oxidative stress (Chen et al., 2015; Xie et al., 2015). The GST was chosen due to its ability to not only protect cells from oxidative stress but also catalyse the conjugation of xenobiotics with glutathione, facilitating their elimination from the organism (Chen et al., 2015; Van der Oost et al., 2003; Xie et al., 2015). LPO was analysed in order to verify the existence of oxidative damage in lipids, since lipids are important molecules as they aid with cellular integrity (Valavanidis et al., 2006) and can be an energy source (Correia et al., 2003).
As a neurotoxicity biomarker we analysed the AChE enzyme due to its role in regulating the nervous transmission (Xie et al., 2015). Besides, in literature it is reported that SER might influence the cholinesterase activity in crabs (Rodrigues et al., 2015).
1.4 OBJECTIVES
The main objective of this thesis is to evaluate the biological responses of G. locusta following chronic exposure to environmental relevant concentrations of SER. An integration of multiple key ecological endpoints (survival, sex ratio, individual growth, reproduction and behaviour analysis) with biochemical markers, indicative of oxidative stress (catalase, glutathione S-transferase and superoxide dismutase activities and lipid peroxidation levels) and neurotransmission, were determined.
11
2 MATERIALS AND METHODS
2.1 AMPHIPOD CULTURE
Gammarus locusta amphipods were obtained from a permanent laboratory culture
developed at CIIMAR. This culture has been kept for several generations in the laboratory. The maintenance of the G. locusta culture is dependent on amphipods collected once a year from a clean site in Sado estuary, Portugal, (N 38º 27’, W 08º 43’), where a population of G. locusta is abundant (Neuparth et al., 2002). The organisms were maintained in plastic aquaria with controlled conditions: temperature 18 ± 2ºC, photoperiod 16h light: 8h dark and salinity 33–35‰. In each aquarium, a clean sediment layer up to 1cm and small stones were added to provide shelter. The animals were fed with Ulva sp (Costa et al., 1998; Neuparth et al., 2014b), and aeration was provided with plastic tips. The algae was collected from a local considered reference site in a beach at Vila Nova de Gaia, Portugal (N 41º 3’ 29.17’’, W 8º 39’ 23.39’’) and sediment and stones were collected in Mindelo beach, Vila do Conde, Portugal (N 41º 18’ 35.24’’, W 8º 44’ 25.06’’).
The amphipods were distributed by three size’s classes (adults, juveniles and newborns) due to the occurrence of cannibalism verified in this species (Correia et al., 2002; Costa et al., 2005). In order to distribute the animals into the different size classes, twice a week the water of each aquarium was sieved through a battery of screens with decreasing mesh size (1500, 500 and 250 µm).
2.2 CHEMICALS
Sertraline hydrochloride (CAS 79559-97-0, purity ≥98.0%) was purchased from Sigma-Aldrich®. The fluoxetine-d5 hydrochloride (FLU-d
5) (CAS 1173020-43-3; purity =98%), also purchased from Sigma-Aldrich® was used an internal standard for water SER quantification.
2.3 EXPERIMENTAL BIOASSAY
2.3.1 EXPERIMENTAL DESIGN
The bioassay, with a duration of 48 days, was conducted in 7 L aquaria with 20 amphipods each in a semi static system. Sub-adults were picked from the culture in order to start the chronic exposure. The bioassay was designed to study the effects of sertraline in a range of ecological (survival, sex ratio, individual growth and reproduction) and biochemical (oxidative stress and neurotransmission biomarkers – GST, CAT, SOD, LPO
12 and AChE levels) endpoints. During the test, the organisms were maintained in the same photoperiod, salinity and temperature of the culture system. The aquaria had a clean sediment layer up to 1 cm, small stones and aeration provided with plastic tips. The animals were fed ad libitum with Ulva sp. which was collected regularly at the clean site mentioned above in 2.1. In each aquaria, alongside with Ulva sp., commercial fish pellets, were added in order to decrease the cannibalism that occurs in Gammarus sp. (MacNeil et al., 2003; Vellinger et al., 2012).
After one week of acclimation, amphipods were exposed to SER. Five experimental conditions with three replicates each were considered: one control (natural sea water 33‰) and four SER treatments with nominal concentrations of 1000, 200, 40 and 8 ng/L. A stock solution was prepared in ultra-pure water at 100 mg/L and stored in dark at 4ºC. The test solutions of SER were prepared by successive dilution of the stock solution and directly applied to each aquarium every two days.
The aquaria were inspected daily for feeding requirements, assuming that Ulva sp is never in shortage, for aeration or to remove dead animals. The water was exchanged every 48 hours and the SER nominal concentrations were renewed in every water change. pH, conductivity, dissolved oxygen and ammonia concentration were measured before each water change.
At 21st, 31st and 40th days of the beginning of bioassay, the aquaria were sieved
through 1500 and 250 µm mesh sieves to collect, respectively, adults and newborns. To ensure that all newborns are collected the aquaria were rinsed twice and sieved. The newborns were preserved in 70% ethanol with Bengal rose for later determination of newborns production per female (Costa et al., 2005). The adults were put back in their respective aquarium. At the end of the bioassay (day 48) all the aquaria were sampled and the individual and biochemical endpoints were determined as described in section 2.4 and 2.5, respectively.
2.4 ECOLOGICAL ENDPOINTS
The adults collected in the 1500 µm mesh sieve were used for ecological endpoints determination. The newborns collected in the 250 µm mesh sieve were preserved for the aforementioned determination. The ecological endpoints analyzed comprised survival, sex ratio, individual length, reproduction and behavior and were determined separately in each replicate for each sex. Survival was expressed as a percentage relative to the initial number of organisms. The sex ratio was determined dividing the number of males by the number of females. The individual length was defined as the individual size of the organism at the end of the assay. For this determination the metasomatic length was used. The metasomatic
13
length, that is defined as the distance between the anterior end of the rostrum and the posterior end of the last metasomatic segment (Costa et al., 2005; DeWitt et al., 1992; Neuparth et al., 2014b), was measured using a stereomicroscope (Nikon SMZ 1000).
The behavioural analysis was based on video recordings. For each treatment, nine organisms per sex, which were randomly selected, were placed individually in one petri dish (diameter 8.5 cm, height 1.5 cm). In each video, six organisms were recorded at the same time. Individual behaviour was recorded in each petri dish full of water of the respective treatment. The video recording was made in a lit environment in the same room where the bioassay was conducted. After 5 min of acclimation, the amphipods´ movement were recorded for 5 min with a HD digital camera (C525, Logitech). The video was obtained in Windows Media Video file (extension .wmv) in 15 frames per second (fps), and it was converted in pictures (extension .jpeg) in 5 fps with iWisoft Free Video Converter (it was download in “http://www.iwisoft.com/videoconverter/”). The data analysis was made with image J with the particle tracker plugin (downloaded in “http://mosaic.mpi-cbg.de/?q=downloads/imageJ”). The behavioural endpoint analysis was the total distance covered by the organism.
2.5 BIOCHEMICAL ENDPOINTS
After the ecological endpoint analyses all males and females were frozen in liquid nitrogen and conserved at -80ºC until further determination of the oxidative stress (CAT, SOD and GST activities and LPO level) and neurotransmission (AChE) biomarkers, which were determined separately by males and females according to the methods described below. Pools of bodies of 1 or 2 males and 2 or 3 females (approximately 0.1 g) were used for CAT, SOD, GST and LPO determinations and pools of 2 males or 2 females heads (approximately 0.050 g) were used for AChE determination. All the tissues were homogenised in ice-cold phosphate buffer (KPi 100 mM, 1 mM EDTA, pH 7.5). The homogenized solution was centrifuged at 12 000G, during 20min at 4ºC. The cytosolic phase (supernatant) was stored at -80ºC in several aliquots for the different biochemical analysis.
2.5.1 PROTEIN DETERMINATION
The amount of protein present in each sample was determined in triplicate using the Lowry’s method with albumin bovine serum (BSA) as standard. This method was based on the formation of a copper-protein complex and the reduction of Folin-Ciocalteu (phosphomolybdate - phosphotungstate), yielding a change in colour which was quantified by spectrophotometry
14 Eleven standard solutions of BSA were prepared through a dilution of BSA stock solution (38 mM). 100 µL of standard solutions were added to microplate wells in triplicate, and samples (5 µL sample and 95 µL ultrapure water) were added in the following wells also in triplicate. The mix of solution A-B (previously prepared) was added to all wells and was incubated for 10 min. The solution A consisted of 0.2 M sodium carbonate (Na2CO3), 0.001 mM potassium sodium tartrate (KNaC4H4O6·4H2O) and 0.1 M sodium hydroxide (NaOH). The solution B was obtained with a drop of sulphuric acid (H2SO4), 30mM copper(II) sulfate (CuSO4) and deionized water. Lastly, the Folin reagent was placed in all wells and, after incubating in the shaker for 30 min, the absorbance was read at 690 nm.
2.5.2 GLUTATHIONE-S-TRANSFERASE
The GST activity was measured by spectrophotometry at 340 nm, using the methods described by Habig et al. (1974), adapted to microplate. The 1-chloro-2,4-dinitrobenzene (CDNB) was used as substrate of GST in order to form a conjugate with the reduced glutathione (GSH). The GST activity was measured by the formation of this conjugate.
Prior the assay, 10 mM GSH was prepared in the GST buffer (0.1 M phosphate buffer, pH 6.5) and 60 mM CDNB in ethanol. The reaction buffer was made with GST:GSH:CDNB in 4.95:0.9:0.15 mL, proportion. In the wells of the microplate, 50 µL of sample and 50 µL of GST buffer were added. A blank was performed, also in triplicate, by adding 50 µL of GST buffer instead of sample. Afterwards, the reaction buffer was added to start the reaction. The absorbance was recorded during the first 5 min, at intervals of 20 s. GST activity is expressed in ηmol/min/mg protein (Ferreira et al., 2010).
2.5.3 CATALASE
CAT activity was measured by spectrophotometry, using a microplate specific for ultraviolet light readings. The method measures the depletion of the hydrogen peroxide (H2O2) at 240 nm. The reaction’s solution was made with 0.05 mM phosphate buffer pH 7.0 and H2O2 (30%). The absorbance was measured with 135 µL of phosphate buffer, 15 µL of sample and 150 µL of the reaction’s solution. Spontaneous substrate hydrolysis was assessed using a blank without the sample, in triplicate. The results were recorded during 1 min, at intervals of 10 s. The activity of CAT was expressed as µmol/min/mg protein (Ferreira et al., 2010).
2.5.4 SUPEROXIDE DISMUTASE
The SOD activity was measured indirectly. The cytochrome c was used as exogenous compound to compete with the endogenous SOD for superoxide radical (O2•−).
15 The assay consists in inducing the formation of hydrogen peroxide (H2O2) in the cells, by the xanthine oxidase, according to the reaction:
Xanthine + H2O + O2 Uric acid + O2•− + H+
After the cytochrome c was added, a competition occurred between cytochrome c and SOD for the degradation of O2•−. Oxidised cytochrome c is reduced by the superoxide radical. The reaction occurs as follows:
O2•− + cytochrome c (Fe 3+) O2 + cytochrome c (Fe 2+)
Superoxide dismutase inhibits the reduction of cytochrome c by competing for the superoxide radical. The reaction occurs as follows:
2 O2•− + 2 H+ H2O2 + O2
The reduction of cytochrome c was quantified by spectrophotometry at 550 nm, through the changes in colour. So, the greater the reduction of cytochrome c, the smaller the amount SOD present.
A measuring unit of the SOD activity is defined as the amount that causes 50% of inhibition of the reduction of your exogenous competitor (in this case cytochrome c) per mg of protein (Ferreira et al., 2010).
The standard solutions of SOD enzyme were prepared from dilutions from the stock solution (3000 U/mL). 25 µL of the standard solution were added to the wells, as well as 25 µL of samples and 25 µL of SOD buffer to serve as blank, all in triplicate. Then, 25 µL of SOD buffer were added in all wells. Subsequently, 200 µL solution A were added, and 50 µL of solution B were placed after. The solution A consisted of 0.7 µM xanthine solution, 30 µM cytochrome c and 50 mM phosphate buffer, and the solution B was obtained with xanthine oxidase 0.4 U/mL and 0.1 M Na2EDTA. The absorbance was read at 550 nm, every 20 s, during 5 min.
2.5.5 LIPID PEROXIDATION
The quantification of the peroxidative damages of lipids was performed by the determination of thiobarbituric acid reactive substances (TBARS). The LPO level was determined by analysis of malondialdehyde (MDA) content using the thiobarbituric acid (TBA) method. The MDA is a secondary product of lipid peroxidation, and is a major product formed. The MDA precipitate with TBA, and, consequently, an increase of absorbance will occur which can be easily assessed with a spectrophotometer (Del Rio et al., 2005).
Trichloroacetate (TCA) 100% was added to the tissue samples, stirred by vortex and centrifuged at 12 000 G, during 20 min at 4ºC. The supernatant was collected and 0.1 M
16 EDTA, TBA 1%, 0.05 M NaOH and butylated hydroxytoluene (BHT) 0.025% were added. A blank was prepared using the same procedure but rather than supernatant, ultra-pure water was added. Then, the mixture was boiled for 30 min and left to cool down before reading the absorbance at 532 nm. All the samples and the blank were read in triplicate. The LPO is expressed as ηmol of MDA equivalents per mg of protein (Ferreira et al., 2010).
2.5.6 ACETYLCHOLINESTERASE
The Ellman method was used to determine the AChE activity (Lionetto et al., 2003). Acetylthiocholine was used as substrate. The 5,5'-dithiobis-(2-nitrobenzoic acid) (DTNB) formed adducts with the thiocholine produced from the degradation of acetylthiocholine by AChE. The AChE’s activity was measured by spectrophotometry at 412 nm and was expressed as ηmol/min/mg protein. The reaction’s solution was made with 0.1 M phosphate buffer, pH 7.2, 0.1 M acetylthiocholine and 10 mM DTNB. In the microplate wells, 50 µL of sample and 250 µL of reaction solution were added, in triplicate. Also, in triplicate, a blank was made to assess the spontaneous substrate hydrolysis. This blank was made by placing 50 µL of 0.1 M phosphate buffer instead of sample. The absorbance was read at 412 nm through the microplate reader, during 5 min in intervals of 20 s.
2.6 SERTRALINE QUANTIFICATION
In each treatment, the actual concentration of SER was determined by liquid chromatography-tandem mass spectrometry (LC-MS/MS), at zero hours after one of the water change (time 0) and 48 hours, immediately before the next water change. Two samples of water per treatment (bulk samples collected from each treatment replicate) were extracted and quantified by LC-MS/MS as described in the next sections. After collection, the samples were frozen at -20ºC until the analysis.
2.6.1 SAMPLE EXTRACTION
After thawing overnight in dark, at room temperature, the water samples were extracted by solid phase extraction (SPE) using cartridges from Strata™-XL-C 100 µm Polymeric Strong Cation (500 mg/6 mL), obtained from Phenomenex, on a vacuum extraction manifold. Previously, the cartridges were conditioned with 10 mL of acetonitrile followed by 10 mL 100 mM dipotassium phosphate (K2HPO4) pH 7.9. Then, the water sample was loaded into the cartridges. After, the cartridges were washed with 10 mL 100 mM dipotassium phosphate pH 7.9 followed by 10 mL of methanol and were dried in vacuum for 10 min. Lastly, the samples were eluted with 10 mL of Ammonium Hydroxide:Acetonitrile in the proportion of 5:95. Following the extraction procedure, the
17 extracts were frozen at -20ºC in glass vials with a nitrogen gas, in the dark. Then the extracts were evaporated under nitrogen steam and were reconstituted with 190 µL of acetonitrile. Finally, 10 µL of internal standard were added at 1 µg/mL in all reconstituted extracts and were analysed by LC-MS/MS.
2.6.2 LC-MS/MS
Samples were injected in a liquid chromatograph, Waters Alliance e2695 HPLC,
coupled with a Mass Spectrometry detector Micromass® Quattro Micro Api™ (Waters, MA, USA), with a chromatographic SB-C18 columns (Zorbax 50 mm x 4.6 mm; 1.8 µm particle size) (Agilent Technologies, USA). The separation was performed with acetonitrile and 0.1% formic acid in ultra-pure water as mobile phase. The gradient of mobile phase applied was as follows: solvent (A) acetonitrile and solvent (B) 0.1% formic acid in ultra-pure water at a flow rate of 0.150 mL/min. The sample volume injected was 1 µL and the following gradient was applied: initially from 0 to 5 minutes, 50% of each gradient was applied; then, from 5 to 7min, 75% of (A) and 25% of (B); finally, from 7 to 15 min, 50% of each gradient was applied, once more, with a total run time of 15 min. The MS parameters were defined as follows: source temperature 120ºC, desolvation nitrogen flow 650 L/Hr at 300ºC, capillary voltage 2.46 kV; cone 30.0 V; extractor 2.0 V; resolution (LM1, HM1, LM2, HM2) 10.0; ion energy 1 and 2 1.0; entrance 10.0; exit 9.0; multiplier 650 V. Samples were injected and analysed in a positive mode by its precursor and fragment ions (table 4) in selected ion recording (SIR) and full scan (100-500 m/z) modes. Tune method was performed with a SER and FLU-d5 standard solutions (2.3 µg/mL and 1 µg/mL, respectably). The carryover test of the method was also performed. Collected data was interpreted using MassLynx™ 4.1 SCN 805 software.
Table 5: Mass spectrometer settings [M+H+]
Compounds Parental
ion
Fragment
Ion Reference
Fluoxetine-d5 315 44 (Gros et al., 2012; Lamichhane and Garcia, 2014; Petrović et al., 2014)
Sertraline 306
159 (de Castro et al., 2008; Gros et al., 2012; Petrović et al., 2014; Zhang et al., 2011)
18
2.7 STATISTICAL ANALYSIS
Statistical analysis were conducted using Statistica 12.6 software from StatSoft, Inc®. The normality of data was determined using the Kolmogorov-Smirnov test and the homogeneity of variances was verified by the Levene’s test. The data from ecological (survival, sex ratio, length, reproduction and behaviour) and biochemical endpoints (CAT, SOD, LPO and AChE) were analysed by one-way analysis of variance (ANOVA) to verify if significant differences between exposed and control organisms, could be associated to sertraline exposure. Treatments that did not fulfil the assumption of ANOVA were previously transformed. In all analysis, after ANOVA, differences between groups were established using post hoc Fisher’s test at 0.05 of significance level. For GST, because ANOVA assumptions were not fulfilled, a Kruskal-Wallis ANOVA by ranks was performed using a level of significance of p=0.05.
19
3 RESULTS
3.1 ECOLOGICAL ENDPOINTS
The mean total survival obtained separately for males and females in each SER treatment after 48 days of exposure is presented in figure 4. Survival rate of control organisms was 80% and 67%, for males and females respectively. These control survival rates are within the normal expected values for long term bioassays with G. locusta (Neuparth et al., 2014a). Cannibalism most likely accounts for a significant portion of control mortality in laboratory tests with this species (Costa et al., 2005; MacNeil et al., 2003). The survival did not differ significantly between control and SER exposed groups. The males’ survival rate in SER treatments was within a range of 50-80% whereas the females’ survival rate was between 37-67%.
Figure 4: Percentage of survival of Gammarus locusta males and females after chronic exposure to sertraline. Error bars indicate the standard errors.
No significant differences were observed in sex-ratio among the SER treatments and control group figure 5. Variations occurred at 40, 200 and 1000 ng/L SER concentrations, leading to a prevalence of males’ survival in these treatments.
Figure 5: Sex ratio of Gammarus locusta after chronic exposure to sertraline. Error bars indicate the standard errors. 0 20 40 60 80 100 0 8 40 200 1000 % S u rv iv a l Treatments (ng/L) Males Females 0,0 1,5 3,0 4,5 6,0 0 8 40 200 1000 S e x r a tio Treatments (ng/L)
20 The analysis of individual growth was performed separately by gender.
Figure 6: Chronic effects of SER on Gammarus locusta growth after a chronic exposure in (A) females and (B) males. Error bars indicate the standard errors. Differences between results are identified by different letters.
In females, the average length at 8 ng/L was statistically higher than the two higher concentrations (200 and 1000 ng/L), but none of them differs from control group (figure 6-A). The males’ growth at 8 ng/L SER was statistically higher than the other concentrations (40, 200 and 1000 ng/L). The 40 ng/L SER concentration was significantly lower than the control group (p<0.03) and the lowest concentration tested (8 ng/L) (figure 6-B).
Reproductive performance was analysed through the cumulative number of newborns produced per female during the assay.
Figure 7: Cumulative number of newborns per female. Error bars indicate the standard errors.
a,b a a,b b b 0 4 8 12 16 0 8 40 200 1000 Fem a les ' len g th ( m m ) a,b a c b,c b,c 0 4 8 12 16 20 0 8 40 200 1000 M a les ' len g th ( m m ) Treatments (ng/L) 0 40 80 120 160 200 0 8 40 200 1000 C u m u lat iv e n u m b e r o f n e w b o rn p e r fe m a le Treatment (ng/L) B A
21 No significant differences were found, neither between the SER treatments nor when these were compared to the control group (figure 7).
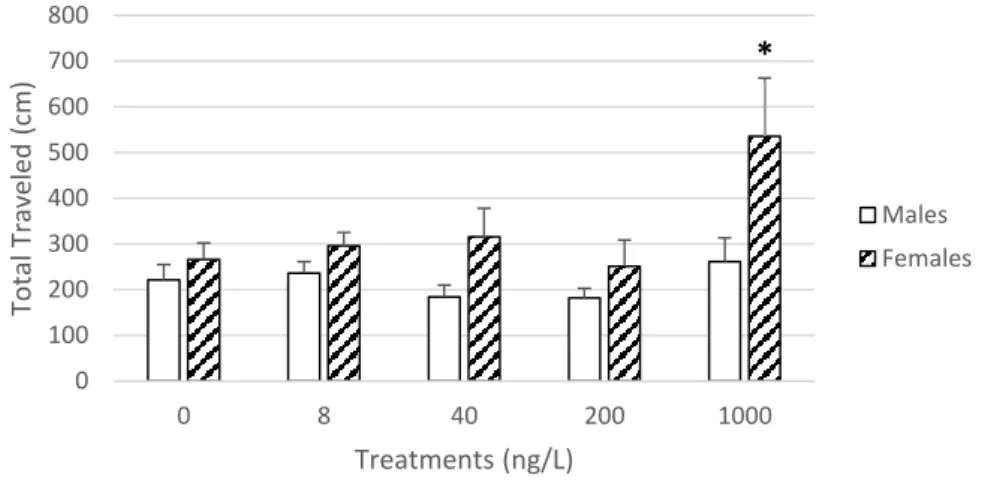
The distance travelled by the amphipods by gender is shown in figure 8. For males, no significant differences were found among treatments. Whereas for females, an increase in activity was observed with the increase of SER concentration. At 1000 ng/L, the females’ activity was significantly higher than all the other treatments (p<0.05).
Figure 8: Total distance travelled and average speed for Gammarus locusta males and females after a chronic exposure to sertraline. Error bars indicate the standard errors. Asterisks indicate significant differences from control group (p<0.05)
3.2 BIOCHEMICAL ENDPOINTS
3.2.1 ANTIOXIDANT BIOMARKERS
GST, CAT and SOD activities of the G. locusta exposed to SER are presented in figure 9. Significant differences between treatments were found in all biomarkers of oxidative stress except for GST.
Concerning CAT activity, a divergent response between genders occurs. No significant differences were found among treatments regarding males. Whereas for females, a higher activity was verified at 1000 ng/L of SER concentration when compared to the 8 ng/L. In males’ SOD activity, at 200 and 1000 ng/L concentrations, a significant activity’s reduction was found, when compared to the control group (p<0.01). In regard to females’ SOD activity, no significant differences were found.
The LPO levels in males rose significantly at the 200 ng/L concentration when compared with the highest concentration tested (1000 ng/L), not occurring any differences in relation to females (Figure 10).
*
0 100 200 300 400 500 600 700 800 0 8 40 200 1000 To ta l T ra ve le d (c m ) Treatments (ng/L) Males Females22 Figure 9: Levels of glutathione S transferase (GST), catalase (CAT) and superoxide dismutase (SOD) activities determined in Gammarus locusta males and females after a chronic exposure to sertraline. Error bars indicate the standard errors. Differences between treatments are identified by different letters
Figure 10: Lipid peroxidation (LPO) levels determined in Gammarus locusta males and females after a chronic exposure to sertraline. Error bars indicate the standard errors. Differences between treatments are identified by different letters. 0 5 10 15 20 0 8 40 200 1000 0 5 10 15 20 0 8 40 200 1000 0 5 10 15 20 25 30 0 8 40 200 1000 a,b a a,b a,b b 0 5 10 15 20 25 30 0 8 40 200 1000 a a, b a, b b b 0,0 0,2 0,4 0,6 0,8 1,0 1,2 1,4 0 8 40 200 1000 0,0 0,2 0,4 0,6 0,8 1,0 1,2 1,4 0 8 40 200 1000 a,b a,b a,b a b 0,00 0,01 0,02 0,03 0,04 0,05 0,06 0 8 40 200 1000 0,00 0,01 0,02 0,03 0,04 0,05 0,06 0 8 40 200 1000 SO D (SO D u n its /m g p ro t) G ST (n m o l/m in /m g p ro t) Male Female CAT (µm o l/ m in /m g p ro t) LPO (n m o l M DA/ m g p ro t) Treatments (ng/L) Treatments (ng/L) Male Female
23
3.2.2 NEUROTRANSMISSION BIOMARKER
There were no significant differences among experimental groups concerning AChE activity (figure 11).
Figure 11: Acetylcholinesterase (AChE) activity determined in Gammarus locusta males and females after a chronic exposure to sertraline. Error bars indicate the standard errors.
3.3 SERTRALINE QUANTIFICATION
Table 5 summarizes the concentrations of SER measured once in the chronic assay. No SER was detected in the control group. Results show that SER concentrations at the initial time (time 0) were lower than nominal concentrations. After 48 h, immediately before the water change, the concentrations of SER were lower than initial time, with the exception of 8 and 200 ng/L.
Table 6: Nominal and measured concentrations of sertraline in water samples collected in duplicate from each treatment. Data expressed as mean (ng/L) ± standard error
Time Control 8 ng/L 40 ng/L 200 ng/L 1000 ng/L Time 0 n.d. (a) 4.8±2.2 24.1±0.2 90.6±53.3 675.7±50.1
Time 48 n.d.(a) 8.2±0.4 13.1±10.0 115.0±0.6 275.6±52.1
(a) Not detected.
0 5 10 15 20 25 30 35 0 8 40 200 1000 0 5 10 15 20 25 30 35 0 8 40 200 1000 Treatments (ng/L) AC hE (n m o l/m in /m g p ro t) Male Female
24
4 DISCUSSION
Pharmaceuticals have been detected in aquatic ecosystems at concentrations that might represent a risk for natural populations. Among pharmaceuticals, antidepressants, such as SSRIs, represent a global concern to the aquatic environment since they are widely prescribed (Fong and Ford, 2014; Rodrigues et al., 2015). However, the available data referring to the effects of SSRIs in aquatic organisms is still very limited in order to project the ecological costs associated with long term exposure. Today, it is known that SSRIs interacts with the serotonin levels (Silva et al., 2014) inhibiting its reuptake at the presynaptic membrane. This inhibition leads to an increase of serotonin level in the synaptic space, making the serotonin more prone to bind with postsynaptic receptors, thus stimulating the
serotoninergic neurons (Campos et al., 2012; Conners et al., 2009; Lattimore et al., 2005; Park et al., 2012). The serotonin is a ubiquitous neurotransmitter found in vertebrates and invertebrates (Silva et al., 2015), but its function and the mechanism of action are not fully known for several species (Silva et al., 2015). Therefore, an effort has been made in order to address the lack of information about the effects of SSRIs in the environment. SSRIs are known for modifying the regulation of the serotonin neurotransmitter in both vertebrates and invertebrates. As such, it is probable that the cellular receptors for SSRI are evolutionarily conserved. Additionally, since serotonin adjusts hormonal and neurological mechanisms it is expected that non-target organisms may deal with identical responses or side effects as those observed in humans (Gonzalez-Rey and Bebianno, 2013; Schultz et al., 2011). Some side effects of SSRIs in aquatic organism are already documented in a few studies, such as changes in reproduction (Lamichhane and Garcia, 2014; Minagh et al., 2009) and in metabolism (Rodrigues et al., 2015; Xie et al., 2015).
Among SSRI, FLU is the most studied (Silva et al., 2015); however, SER has been reported as the most toxic for aquatic organisms (Lamichhane and Garcia, 2014). Little is known on the effects of SER on aquatic organisms (Rodrigues et al., 2015), mainly considering chronic effects. SER concentrations on surface water are reported commonly at trace levels concentrations, but studies carried out with environmentally relevant concentrations of SER are scarce (Bossus et al., 2014). Some studies, using both acute and chronic exposures, reported that such SER concentrations can have a significant impact on aquatic organisms, such as reducing the survival of fish (Schultz et al., 2011), decreasing the tadpoles’ growth (Conners et al., 2009) and changing the swimming behaviour in gammarids (Bossus et al., 2014; De Lange et al., 2009). However, the mechanisms by which this pharmaceutical may affect aquatic organisms are unknown.
A recent study of Bossus et al. (2014) reported significant changes in swimming behaviour of Echinogammarus marinus exposed to acute environmentally relevant
25 concentrations of SER (1 to 1000 ng/L). After 1 hour of exposure, the organisms showed higher activity at the concentration of 10 ng/L, but when the SER exposure lasted 8 days no significant differences were found, comparing to the control group. Taking into account the results of Bossus et al. (2014) showing that acute SER exposure at environmentally relevant concentrations exhibited effects in amphipod‘s behaviour, a long-term analysis of SER effects is fundamental as the aquatic organisms are exposed uninterruptedly, over their life cycles, to chronic low levels of SER. Thus, in the scope of this thesis, a chronic exposure during 48 days at environmentally relevant concentration of SER was performed with the amphipod G. locusta, in order to analyse the SER effects at various levels and to understand the its effects in the aquatic ecosystems.
In the present study, SER induced several chronic adverse effects in G. locusta, both at ecological and at biochemical endpoints. In some endpoints, non-monotonic curves were obtained. These type of curves have been observed in other studies with antidepressants in aquatic organisms, where an absence of a dose dependent response is usual (Ford and Fong, 2015; Schultz et al., 2011). Non-monotonic responses are characterized by the curve’s slope inversion over the tested concentrations (EFSA, 2012; Vandenberg et al., 2012). The non-monotonic curves may exhibit a biphasic shape (Conolly and Lutz, 2004), a U-shape or an inverted U-shape (EFSA, 2012; Vandenberg et al., 2012). Some authors suggest that non-monotonic responses might be related to receptor desensitization or due to these having reached the maximum response (Bossus et al., 2014; Guler and Ford, 2010). The occurrence of modifications in metabolizing enzymes is another plausible explanation for this type of responses, since these modifications lead to an adaptive response (EFSA, 2012).
4.1 ECOLOGICAL ENDPOINTS
In this study, the SER chronic bioassay has shown effects in individual-level endpoints, namely growth and behaviour. Despite no significant with effects being apparent on mortality nor in sex-ratio, an imbalance in sex ratio was visible, a higher prevalence of males in the highest tested concentrations (40, 200 and 1000 ng/L), being more pronounced at 40 ng/L SER concentration. This imbalance might be due to mortality, predation skewed towards females, and/or higher sensibility of females to SER exposure. A change in the normal sex-ratio (1:1), with a male prevalence, might lead to an alteration in the population’s structure.
In this study, SER induced changes in G. locusta growth. Significant growth differences among SER treatments and between males and females were observed. Our results suggest non-monotonic responses. A U-shaped response was observed in males’


![Table 5: Mass spectrometer settings [M+H + ] Compounds Parental](https://thumb-eu.123doks.com/thumbv2/123dok_br/15863161.1087100/30.892.139.784.872.1040/table-mass-spectrometer-settings-m-h-compounds-parental.webp)