Original Article rbafs.org.br
Copyright: This is an open-access article distributed under the terms of the Creative Commons Attribution License®, which permits unrestricted use, distribution, and reproduction in any medium, provided that the original author and source are credited.
Introduction
The health benefits of physical activity are well docu-mented1. Nevertheless, considering that a person can meet the recommendations of the physical activity but also can accumulate a lot of time in activities with few movement and at the sitting position, sedentary time came be understood as a behavior distinct of the lack of physical activity2. In this sense, some evidences have
been suggested, that independently of physical activity, persons with excessive time spent in sedentary beha-viors are more likely of morbidity and mortality2.
The independent associations of the physical activity and the sedentary time with different health outcomes have been analyzed also in adolescents. Although some studies indicate independent associations of the time in physical activities (inverse) and in sedentary time
Screen time, physical activity and cardiovascular
risk factors in adolescents
Tempo de tela, atividade física e fatores de risco cardiovasculares em adolescentes
AUTHOR’SGabriel Gustavo Bergmann¹ Rafael Miranda Tassitano² Mauren Lúcia de Araújo Bergmann¹ Maria Cecília Marinho Tenório² Jorge Mota³
1 Physical Education College, Federal University of Pampa, Uruguaiana, Rio Grande do Sul, Brazil. 2 Department of Physical Education, Rural Federal University of Pernambuco, Recife, Pernambuco, Brazil.
3 Research Centre in Physical Activity, Health and Leisure, Faculty of Sport, University of Porto, Porto, Portugal.
CORRESPONDING Gabriel Gustavo Bergmann
Federal University of Pampa Campus Uruguaiana.
BR 472, Km 592, Postal box 118, Uruguaiana, Rio Grande do Sul, Brazil. CEP: 97500-970.
DOI
10.12820/rbafs.23e0008
ABSTRACT
The aim of this study was to examine the independent and combined associations of physical activity and different types of screen time in cardiovascular disease risk factors in adolescents. The sample was comprised for 1,045 adolescents (51.7% female) aged 11-17 years old randomly selected. Screen time was considered by the self-related electronic devices such as time watching TV, using computer (PC) and playing videogame (VG). Physical activity was estimated by the number of steps per day (steps/ day) measured by pedometers. Cardiovascular risk factors were sum of triceps and subscapular skin-folds (∑SF), total cholesterol (TC) and blood pressure (BP). Predictors and outcome variables were dichotomized using standardized cut off points. Categories of steps/day and different types of screen time were cross tabulated to the combined analyses. A set of sociodemographic variables was used as confounders. To test the independent and combined associations Chi-square tests (unadjusted) and binary logistic regression (adjusted) were used. TV time was directly and independently associated to ∑SF in females and to TC in males. Steps/day was inversely and independently associated to TC and to BP (not in female). Overall, combined analyses showed that adolescents who did not meet recommendations of steps/day and exposure an excessive screen time are more likely to present car-diovascular risk factor. Public health programs to increase physical activity and reduce screen time, especially TV time, should be developed to improve and prevent cardiovascular health in adolescents.
Keywords: Obesity; Cholesterol; Hypertension; Health behavior; Adolescents.
RESUMO
O objetivo deste estudo foi identificar as associações independentes e combinadas da atividade física e de diferentes tipos de tempo de tela com fatores de risco para doenças cardiovasculares (DCV) em adolescentes. A amostra foi composta por 1.045 adolescentes (51,7% meninas) de 11 a 17 anos de idade selecionados aleato-riamente. O tempo de tela (TT) foi considerado a partir do autorrelato do tempo de médio diário assistindo TV, e usando computador (PV) e jogando videogame (VG). A atividade física foi estimada pelo número de passos (passos/dia) medido por pedômetros. Os fatores de risco para DCV foram o somatório de dobras cutâneas (∑DC), colesterol total (CT) e pressão arterial (PA). Preditores e desfechos foram dicotomizados usando pontos de corte padronizados. As categorias do passos/dia e TT foram combinadas. Diferentes variá-veis sociodemográficas foram utilizadas como variávariá-veis de ajuste. Para testar as associações independentes e combinadas foram utilizados teste qui-quadrado (brutas) e a regressão logística binária (ajustada). O tempo de TV se associou direta e independentemente com o ∑DC nas meninas e com o CT nos meninos. Os passos/ dia se associou inversa e independentemente com o CT e a PA (meninos). De maneira geral, as análises combinadas mostraram que adolescentes que não atendem as recomendações para passos/dia e TT apresen-tam probabilidade aumentada de estarem expostos a fatores de risco para doenças CDV. Programas de saúde pública para o aumento da atividade física e redução do tempo de tela, principalmente o tempo de TV, devem ser desenvolvidos para prevenção da saúde cardiovascular de adolescentes.
(direct) with health outcomes3-6, not all results are con-sistent. Some studies found independent association with health outcomes only to physical activity7-12 and others only to sedentary time13-15.
Most studies reported independent association or effect between one of the behavior and morbidity con-dition, just adjusting the analyses by the other behavior. A combination of two or more behavioral risk factors may present higher risk to different health outcomes. In this perspective, a recent and important meta analyzis including more than one million of men and women concluded that the risk of mortality from sedentary be-havior (sitting time and TV viewing) can be attenuated by physical activity and even eliminated (sitting time) with about 60 to 75 minutes per day of moderate phys-ical activity16. In adolescents, some studies also have analyzed the combined associations of these behaviors with different health outcomes4,10,15-17,18. Results sug-gest that physical activity presenting stronger associ-ations than sedentary time with health outcomes4,10,18. Nevertheless, Rendo-Urtegaet al.15 and Andersen et al.17 found that total screen time and television view-ing, respectively, was closely more related to skin folds and body mass index than physical activity.
Despite many studies already have analyzed the in-dependent and combined associations between physi-cal activity and sedentary time with health outcomes in adolescents, few of them included in the analyses different types of sedentary time. Among the differ-ent types, screen time seems to be the main of them6. Although many studies have used screen time in the analyses, most of them did not consider different types separately, analyzing just one type7,17 or the sum of different types of screen time4,8,13-15. Hence, the pur-pose of this study was to examine the independent and combined associations of physical activity and different types of screen time on cardiovascular disease risk fac-tors in adolescents.
Methods
This cross-sectional study is part of a macro-project entit-led “Associative Study of Cardiorespiratory Fitness, Phy-sical Activity, Anthropometric Indicators of Overweight and Obesity and Cardiovascular Disease Risk Factors in Adolescents”, that was conduct using data from stu-dents aged 11 to 17 years (it was considered from the sixth year of elementary to the third year of high school) from private and public (urban and rural area) schools of Uruguaiana/Brazil. For estimating the minimal sample
size were considered: i) population of 15,913 students in this age group according to 2011 census information on school population; ii) prevalence of 50% because of the macro-project´s characteristic of multiple outcomes; iii) confidence interval of 95% (95%CI); iv) sampling error of three percentage points; and v) increase of 15% to compensate possible losses and refusals. Considering all of these criteria it was estimated 1,151 adolescents.
To respect the proportion of students from public (urban and rural) and private schools in relation to the total number of students of the city, it was necessary selecting five schools: one private; one rural; and three urban public schools. For selecting the private and the rural public school a simple draw was made among all schools of this system (private) and this area (rural). As the number of students enrolled in urban public school represented the majority (86.8%) of the total number of students 11-17 years old enrolled in the city, the strategy for the selection of these schools was car-ried out dividing proportionally the urban area of the city into three geographic regions (northern, central and southern).All urban public schools in each of the three regions participated in the draw having the same chances to take part in the study according to the num-ber of students aged 11-17 years enrolled on final years of elementary school and/or high school. One public urban school of each region was drawn.
The total number of students in each of the five selected schools was identified. As the five selected schools had a high number of students in the age band of interest, even with the draw of classrooms the num-ber of students selected from each school was enough to represent the proportion of each system (private and public) and area (urban and rural) relatively to the total number of students enrolled in the city, without the need of drawing other schools. All students in the se-lected classrooms of the five sese-lected schools were in-vited to participate in the study. Being enrolled in the school system (public or private) of the municipality was considered as inclusion criterion for participation in the study. The following criteria were used as exclu-sion criteria: i) being outside the age band of interest; ii) having any physical and/or cognitive limitations that could compromise the results; iii) having stated that during the days of using of the pedometer they did not perform physical activities as usual due to an injury or illness; and, iv) to be using any medication that could influence the lipid profile or blood pressure.
Outcomes – Cardiovascular risk factors
The considered outcomes (cardiovascular risk factors) were sum of triceps and subscapular skin folds (ΣSF); total cholesterol (TC), and, blood pressure (BP).
Measures of skin folds from subscapular and triceps regions were collected using a scientific caliper (Cescorf, Brazil) according standardized procedures19. The values of these both skinf olds were summed (ΣSF). If there was a difference between the two measurements a third measurement was performed and the mean between the nearest values was considered. The classification of ΣSF values in “recommended” and “increased” was held from the cutoff points proposed by the Physical Best19. Skinfolds were measured in duplicate.
TC was measured with a portable monitor (Accu-trend Plus, Roche Diagnostics). It was not required that the schoolchildren were fasting since the TC shows no significant variation with the individual whether or not fasting20. According to the IV Brazilian Guideline for Dyslipidemia and Atherosclerosis Prevention21 TC values less than 150 mg/dl were considered “recom-mended”, between 150 and 170 mg/dl were considered “borderline” and values equal or greater than 170 mg/dl were considered “increased”. For the data analysis the categories “borderline” and “increased” were grouped and considered “increased”.
BP (systolic and diastolic) was measured with in-dividuals being at rest for at least ten minutes. The measurement was performed by using a validity22 dig-ital device for blood pressure checking (Omron HEM 742). Three measures were performed and the measure of intermediate value was used. BP classification was performed based on the indications from The Fourth Report on the Diagnosis, Evaluation, and Treatment of High Blood Pressure in Children and Adolescents23, indicating “recommended”, “pre-hypertension” and “hypertension”. For analyses of association the “pre-hy-pertension” and “hy“pre-hy-pertension” categories were grouped and considered as “increased”.
Physical activity was estimated from the number of steps/day recorded by pedometers (Yamax Digi-Walk-er CW 700). Each adolescent used a pedometDigi-Walk-er for three consecutive days of the week. They were instruct-ed about where placing it (waist) and how to use the equipment (attached by an elastic belt given by the as-sessment team), the functioning of memory, and not to use while performing activities involving water (such as swimming and bathing) and while they slept. Number of steps/day was considered from the mean of the
sec-ond and third day, excluding values under 1,000 steps/ day and over 30,000 steps/day means values24 and were categorized as “not recommended” or “recommended” according to the proposal of Tudor-Locke et al.25.
Screen time was self-reported by television watch-ing time (TV time), videogame use time (VG time) and computer use time (PC time) on a regular week day using a questionnaire. After receiving instruc-tions about the questionnaire, adolescents answered the fowling questions: a) On class days (Monday to Friday), how many hours a day do you watch TV?; b) On class days (Monday to Friday), how many hours a day do you use computer (not consider time to school activities)?; c) On class days (Monday to Friday), how many hours a day do you play video-game? Screen time was considered by each type of screen (TV, VG and PC) and by of the sum of all off three types (total screen time) and was dichotomized in less than two hours/day (recommended) or two or more hours/day (increased)26. Besides, the total screen time was also categorized in six categories: <1 hour/day; 1-2 hours/ day; > 2-3 hours/day; > 3-4 hours/day; > 4-5 hours/ day; and > 5 hours/day.
Sociodemographic indicators were used as ad-just variables. They included sex (male or female); age (completed years); living area (urban or rural); socioec-onomic status (terciles of the score of the Classification Economic Brazil27); and mother’s schooling (less than eight years or more than eight years). Socioeconomic status and mother’s schooling were informed by one of the adolescents’ parent or other responsible.
All analysis was run with all sample and stratified by sex, because physical activity and sedentary time seems to be different between sexes10 and thus the associa-tions with health outcomes may differ for boys and girls. Absolut and relative frequencies and confidence interval of 95% (CI95%) were used to describe all vari-ables. To verify the unadjusted associations between independent variables (steps/day, TV, VG, PC and to-tal screen time) with each outcome variables (ΣSF, TC and BP) we used chi-square (χ2) test for heterogeneity and for linear trend. To test the independent associ-ation (adjusted) of steps/day, TV, VG, PC and total screen time in each outcome variables we used the lo-gistic binary regression. All multivariable analyses were adjusted for sex (analysis with whole sample), age, liv-ing area, socioeconomic status and mother’s schoolliv-ing. To test the combined association of steps/day, TV, VG, PC and total screen time on each outcome variable,
steps/day and all types of screen time categories were cross-tabulated creating four new variables (steps/TV; steps/VG; steps/PC and steps/total screen time) de-fined in four categories each: “not recommend steps/ increased TV”, “not recommend steps/recommended TV”, “recommend steps/increased TV”, “recommend steps/recommended TV”; “not recommend steps/in-creased VG”, “not recommend steps/recommended VG”, “recommend steps/increased VG”, “recommend steps/recommended VG”; “not recommend steps/in-creased PC”, “not recommend steps/recommended PC”, “recommend steps/increased PC”, “recommend steps/recommended PC”; and, “not recommend steps/ increased total screen time”, “not recommend steps/ recommended total screen time”, “recommend steps/ increased total screen time”, “recommend steps/recom-mended total screen time”. Chi-square (χ2) test for lin-ear trend and binary logistic regression adjusted by sex (analysis with whole sample), age, living area, socio-economic status and mother’s schooling were used to test unadjusted and adjusted associations, respectively, between combined steps/day and all types of screen time categories and outcomes variables. All statistical analyses were performed in the Statistical Package for the Social Science (SPSS, SPSS Inc., IBM, Chicago, IL, EUA) for Windows18.0 version. Statistical signif-icance was set at 5%.
This research had its project reviewed and approved by the ethics committee on human research (protocol number 176.951). Written informed parental consent and child assent were obtained for all participants. All measurements were performed on school premises in class time by an assessment team (teachers and schol-arship/physical education students) who had under-gone training. The data collection occurred between April and October 2012.
Results
A total of 1,300 schoolchildren were selected from the five participating schools. By refusing to participate, not having their parents´ authorization, not atten-ding on the day of data collection or failing to bring the consent form signed on the date set, 236 students did not participate the data collection, totaling 1,064 schoolchildren. Of these, 19 were outside the age ran-ge considered for the study. Out of the 1,045 adoles-cents of the study sample, 990 had steps/day recorded appropriately and 974 of them self-reported all types of screen time. Others descriptive characteristics of the
sample (whole and by sex) are shown in table 1. Table 1 shows the overall characteristics of the sam-ple. The mean age of the sample was 14.05 (±1.96) years old with no difference between boys (13.93 ± 1.99) and girls (14.17 ± 1.92). The sample was well distributed between sexes and ages and there are no differences between sexes in all sociodemographic indicators. On the analyzed outcomes, only ΣSF showed difference (p < 0.05) between sexes. Overall, about one third of the adolescents met the recommendation for the number of steps/day. The results of different types of screen time indicated that 58.0% (CI95%: 53.9-62.1), 89.3% (CI95%: 87.2-91.3) and 44.5% (CI95%: 39.8-49.2) of the adolescents met the recommendation of up two hours/day of screen time for TV, VG and PC, respec-tively. Girls presented significantly more frequency than boys in increased TV and PC time, and boys pre-sented significantly more frequency in increased VG time than girls. More than half of the sample reported five or more hours/day of total screen time.
The associations of steps/day and screen time (dif-ferent types and total screen time) with all outcomes in whole sample and by sex are presented in tables 2 (unadjusted) and 3 (adjusted), respectively. Adolescents who did not meet recommendations of steps/day were more likely to present increased TC and BP (except for girls) independent of screen time (all types) and so-ciodemographic indicators. Among all types of screen time, only increased TV time presented significant as-sociation with some analyzed outcome. Adolescents who self-reported watch TV two or more hours per day were more likely to present increased ΣSF (except for boys) and CT (except for girls) independent of steps/day and sociodemographic indicators.
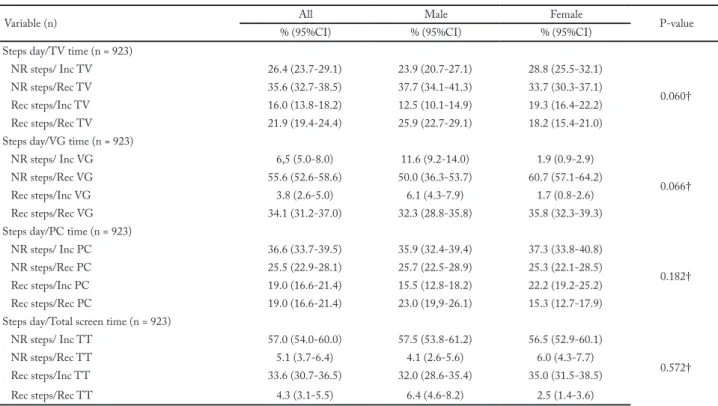
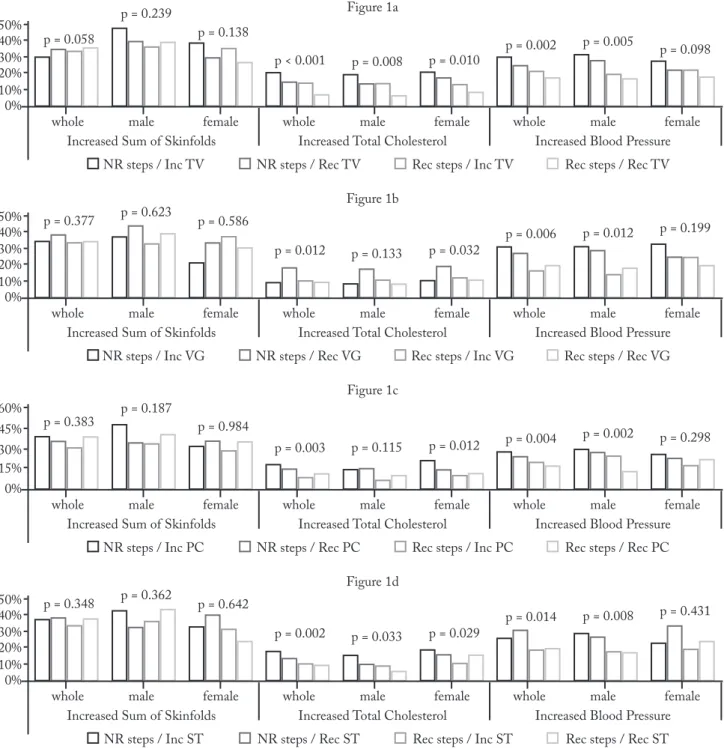
The associations of combined steps/day and differ-ent types of screen time with all outcomes in whole sample and by sex are presented in figure 1 (unadjust-ed) and table 4 (adjust(unadjust-ed), respectively. Overall, unad-justed analyses of combined steps/day and screen time (all types) with outcome variables indicated that ado-lescents who did not meet the recommendations for step/day and screen time had the highest prevalence of increased TC and BP, while those who met the rec-ommendations for steps/day and screen time had the lowest prevalence of increased TC and BP (figure 1). In general, these analyses also showed that for both, in-creased TC and BP, not recommended steps/day pre-sents a stronger association than increased screen time. Results from adjusted combined analyses support the
Table 1 – Descriptive characteristic of the sample. Uruguaiana, Brazil.
Variable (n) All Male Female P-value
% (95%CI) % (95%CI) % (95%CI)
Confounder – Sociodemographic indicators
Sex (n = 1,045) -- 48.3 (45.3-51.3) 51.7 (48.7-54.7) 0.279* 11 years 11.0 (9.1-12.9) 11.1 (8.4-13.8) 10.9 (8.3-13.5) 0.053† 12 years 17.6 (15.3-19.9) 21.6 (18.0-25.2) 13.9 (11.0-16.8) 13 years 14.0 (11.9-16.1) 13.7 (10.7-16.7) 14.3 (11.3-17.2) 14 years 11.9 (9.9-13.9) 11.5 (8.7-14.3) 12.2 (9.4-15.0) 15 years 17.5 (15.2-19.8) 15.6 (12.4-18.8) 19.4 (16.1-22.7) 16 years 13.9 (11.8-16.0) 11.9 (9.1-14.7) 15.7 (12.6-18.8) 17 years 14.1 (12.0-16.2) 14.6 (11.5-17.7) 13.6 (10.1-16.5) Living area (n = 1,045) Urban 91.6 (89.9-93.3) 90.9 (88.4-93.4) 92.2 (89.9-94.5) 0.439‡ Rural 8.4 (6.7-10.1) 9.1 (6.6-11.6) 7.8 (5.5-10.1) Socioeconomic status (n = 1,039) Tercile 1 37.2 (34.3-40.1) 35.1 (30.9-39.3) 39.1 (35.0-43.2) 0.565† Tercile 2 30.0 (27.2-32.8) 32,7 (28.6-36.8) 27.6 (23.8-31.4) Tercile 2 32.8 (29.9-35.6) 42,2 (37.9-46.5) 33.3 (29.3-37.3) Mother’s schooling (n = 1,040) ≤ 8 years 28.6 (25.9-31.3) 31.2 (27.1-35.2) 26.1 (29.3-37.3) 0.067‡ > 8 years 71.4 (68.1-74.7) 68.8 (65.4-72.2) 73.9 (70.7-77.1)
Outcomes – Cardiovascular risk factors Sum of skinfold (n = 1,033) Recommended 63.2 (60.3-66.1) 59.4 (55.8-63.0) 66.7 (63.3-70.1) 0.015‡ Increased 36.8 (33.9-39.7) 40.6 (37.0-44.2) 33.3 (29.9-36.7) Total cholesterol (n = 1,045) Recommended 85.6 (83.5-87.7) 86.9 (84.4-89.4) 84.4 (81.8-87.4) 0.252‡ Increased 14.4 (12.3-16.5) 13.1 (10.6-15.6) 15.6 (13.0-18.2) Blood pressure (n = 1,045) Recommended 75.7 (73.1-78.3) 73.9 (70.7-77.1) 77.4 (74.3-80.4) 0.182‡ Increased 24.3 (21.7-26.9) 26.1 (22.9-29.3) 22.6 (19.5-25.6) Predict variables
Number of steps per day (n = 990)
Recommended 37.2 (34.3-40.1) 36.7 (33.1-40.3) 37.6 (34.1-41.1) 0.761‡ Not recommended 62.8 (59.9-65.7) 63.3 (59.7-66.8) 62,4 (58.9-65.9) TV time (n = 973) ≤ 2 hours/day 58.0 (55.0-61.0) 63.7 (60.1-67.3) 52.8 (49.2-56.4) 0.001‡ > 2 hours/day 42.0 (39.0-45.0) 36.3 (32.7-39.9) 47.2 (43.6-50.8) VG time (n = 974) ≤ 2 hours/day 89.3 (87.4-91.1) 82.2 (79.4-85.0) 95.9 (94.5-97.3) <0.001‡ > 2 hours/day 10.7 (8.8-12.6) 17.8 (15.0-20.6) 4.1 (2,7-5.5) PC time (n = 974) ≤ 2 hours/day 44.5 (41.5-47.5) 48.3 (44.6-52.0) 40.9 (37.3-44.5) 0.021‡ > 2 hours/day 55.5 (52.3-58.5) 51.7 (48.055.4) 59.1 (55.5-62.7)
Total screen time (n = 973)
≤ 2 hours/day 9.7 (7.9-11.5) 10.5 (8.2-12.8) 8,9 (6.8-11.0)
0.376‡
> 2 hours/day 90.3 (88.5-92.0) 89.5 (87.2-91.8) 91.1 (89.0-93.2)
Total screen time (n = 973)
≤ 1 hours/day 2.3 (1.4-3.2) 2.4 (1.3-3.5) 2.2 (1.1-3.3) 0.553† > 1-2 hours day 7.4 (5.8-9.0) 8.2 (6.2-10.2) 6.7 (4.9-8.5) > 2-3 hours/day 10.2 (8.4-12.0) 9.5 (7.3-11.7) 10.8 (8.5-13.1) > 3-4 hours/day 12.8 (10.8-14.8) 13.1 (10.6-15.6) 12.6 (10.2-15.0) > 4-5 hours/day 11.8 (9.8-13.8) 12.7 (10.2-15.2) 11.0 (8.7-13.3) > 5 hours/day 55.5 (52.5-58.5) 54.2 (50.5-57.9) 56.7 (53.1-60.3) Continue…
Variable (n) All Male Female P-value
% (95%CI) % (95%CI) % (95%CI)
Steps day/TV time (n = 923)
NR steps/ Inc TV 26.4 (23.7-29.1) 23.9 (20.7-27.1) 28.8 (25.5-32.1)
0.060†
NR steps/Rec TV 35.6 (32.7-38.5) 37.7 (34.1-41.3) 33.7 (30.3-37.1)
Rec steps/Inc TV 16.0 (13.8-18.2) 12.5 (10.1-14.9) 19.3 (16.4-22.2)
Rec steps/Rec TV 21.9 (19.4-24.4) 25.9 (22.7-29.1) 18.2 (15.4-21.0)
Steps day/VG time (n = 923)
NR steps/ Inc VG 6,5 (5.0-8.0) 11.6 (9.2-14.0) 1.9 (0.9-2.9)
0.066†
NR steps/Rec VG 55.6 (52.6-58.6) 50.0 (36.3-53.7) 60.7 (57.1-64.2)
Rec steps/Inc VG 3.8 (2.6-5.0) 6.1 (4.3-7.9) 1.7 (0.8-2.6)
Rec steps/Rec VG 34.1 (31.2-37.0) 32.3 (28.8-35.8) 35.8 (32.3-39.3)
Steps day/PC time (n = 923)
NR steps/ Inc PC 36.6 (33.7-39.5) 35.9 (32.4-39.4) 37.3 (33.8-40.8)
0.182†
NR steps/Rec PC 25.5 (22.9-28.1) 25.7 (22.5-28.9) 25.3 (22.1-28.5)
Rec steps/Inc PC 19.0 (16.6-21.4) 15.5 (12.8-18.2) 22.2 (19.2-25.2)
Rec steps/Rec PC 19.0 (16.6-21.4) 23.0 (19,9-26.1) 15.3 (12.7-17.9)
Steps day/Total screen time (n = 923)
NR steps/ Inc TT 57.0 (54.0-60.0) 57.5 (53.8-61.2) 56.5 (52.9-60.1)
0.572†
NR steps/Rec TT 5.1 (3.7-6.4) 4.1 (2.6-5.6) 6.0 (4.3-7.7)
Rec steps/Inc TT 33.6 (30.7-36.5) 32.0 (28.6-35.4) 35.0 (31.5-38.5)
Rec steps/Rec TT 4.3 (3.1-5.5) 6.4 (4.6-8.2) 2.5 (1.4-3.6)
n: absolute frequency; %: relative frequency; 95%CI: confidence interval of 95%; *: one sample chi-square test; †: chi-square test for linear trend; ‡: chi-square test for heterogeneity; NR: not recommended; Rec: recommended; Inc: increased; p-values lower than 0.05 were high-lighted in bold.
Table 2 – Distribution of cardiovascular risk factors according steps per day and different types of screen time in whole sample and by sex. Uruguaiana, Brazil.
∑SF – increased (% - 95%CI) TC – increased (% - 95%CI) BP – increased (%- 95%CI)
All Male female All male female All male female
Steps per day‡ p = 0.191 p = 0.379 p = 0.345 p = 0.004 p = 0.046 p = 0.034 p = 0.003 p = 0.002 p = 0.243 Recommended (30.5-37.9)34.2 (32.7-43.7)38.2 (25.6-35.8)30.7 (7.2-13.4)10.3 (4.8-13.4)9.1 (6.9-15.9)11.4 (15.0-23.0)19.0 (11.4-24.0)17.7 (14.5-25.9)20.2 Not recommended (33.4-43.4)38.4 (34.9-49.7)42.3 (28.1-41.5)34.8 (14.0-20.0)17.0 (11.5-19.7)15.6 (14.2-22.6)18.4 (24.0-31.0)27.5 (25.6-35.4)30.5 (20.0-29.4)24.7 TV time‡ p = 0.084 p = 0.496 p = 0.032 p = 0.023 p = 0.051 p = 0.250 p = 0.273 p = 0.640 p = 0.227 ≤ 2 hours/day (30.7-38.6)34.7 (34.3-45.5)39.9 (23.7-34.5)29.1 (9.9-15.3)12.6 (7.3-14.3)10.8 (10.4-18.8)14.6 (19.4-26.4)22.9 (19.8-29.6)24.7 (16.0-25.8)20.9 > 2 hours/day (35.3-44.9)40.1 (35.6-50.6)43.1 (31.9-44.2)38.1 (14.1-21.5)17.8 (11.5-22.9)17.2 (13.4-23.2)18.3 (21.6-30.2)25.9 (19.9-33.3)26.6 (19.9-30.9)25.4 VG time‡ p = 0.751 p = 0.449 p = 0.636 p = 0.191 p = 0.278 p = 0.795 p = 0.663 p = 0.957 p = 0.438 ≤ 2 hours/day (34.0-40.4)37.2 (36.9-46.9)41.9 (29.3-37.7)33.5 (13.0-17.8)15.4 (10.6-17.6)14.1 (13.1-19.7)16.4 (21.2-26.8)24.0 (21.2-30.0)25.6 (19.1-26.5)22.8 > 2 hours/day (26.4-44.8)35.6 (26.9-47.7)37.3 (13.3-53.4)28.6 (4.7-16.5)10.6 (3.3-15.9)9.6 (0.3-28.3)14.3 (17.6-34.4)26.0 (15.9-34.7)25.3 (2.9-47.9)28.6 PC time‡ p = 0.897 p = 0.190 p = 0.371 p = 0.531 p = 0.771 p = 0.331 p = 0.180 p = 0.044 p = 0.984 ≤ 2 hours/day (32.2-41.4)36.8 (31.5-44.3)37.9 (29.1-42.1)35.6 (10.8-17.4)14.1 (9.3-18.3)13.8 (9.6-19.2)14.4 (18.3-26.1)22.2 (15.9-26.7)21.3 (17.4-28.8)23.1 > 2 hours/day (32.7-41.7)37.2 (37.6-50.2)43.9 (26.5-37.1)31.8 (12.5-18.5)15.5 (8.7-17.1)12.9 (13.4-22.0)17.7 (18.7-25.7)25.9 (16.1-26.5)29.5 (18.3-27.9)23.0 Total screen time‡ p = 0.994 p = 0.686 p = 0.740 p = 0.559 p = 0.277 p = 0.784 p = 0.742 p = 0.619 p = 0.328
≤ 2 hours/day (27.1-46.9)37.0 (24.4-52.2)38.3 (21.6-46.6)35.6 (6.0-19.6)12.8 (0.5-15.9)8.2 (6.6-29.0)17.8 (16.7-34.3)25.5 (10.7-34.1)22.4 (15.7-42.1)28.9 > 2 hours/day (33.8-40.2)37.0 (36.6-46.2)41.4 (28.8-37.4)33.1 (12.6-17.4)15.0 (10.4-17.0)13.7 (12.8-19.6)16.2 (21.2-26.8)24.0 (21.5-29.9)25.7 (18.7-26.3)22.5
Continue… … continue
∑SF – increased (% - 95%CI) TC – increased (% - 95%CI) BP – increased (%- 95%CI)
All Male female All male female All male female
Total screen time† p = 0.368 p = 0.152 p = 0.910 p = 0.482 p = 0.055 p = 0.833 p = 0.343 p = 0.253 p = 0.828 ≤ 2 hours/day (27.2-46.7)37.0 (24.7-51.9)38.3 (21,6-49.6)35.6 (6.0-19.6)12.8 (0.5-15.9)8.2 (6.6-29.0)17.8 (16.7-34.3)25.5 (10.7-34.1)22.4 (15.7-42.1)28.9 > 2-3 hours/day (24.4-43.0)33.7 (16.6-43.8)30.2 (23.7-49.1)36.4 (6.4-19.8)13.1 (0.1-13.5)6.8 (8.0-28.4)18.2 (11.4-30.0)19.2 (12.2-37.8)25.0 (5.2-23.8)14.5 > 3-4 hours/day (23.4-39.6)31.5 (26.1-50.5)38.3 (14.4-35.6)25.0 (5.0-15.8)10.4 (2.3-17.3)9.8 (3.3-18.5)10.9 (14.4-28.8)21.6 (11.0-31.6)21.3 (11.8-32.0)21.9 > 4-5 hours/day (32.2-50.2)41.2 (30.5-55.7)43.1 (26.5-52.1)39.3 (9.0-22.4)15.7 (7.3-26.5)16.9 (5.1-23.5)14.3 (15.0-30.2)22.6 (8.7-28.5)18.6 (15.2-38.4)26.8 > 5 hours/day (33.9-42.1)38.0 (37.5-49.7)43.6 (29.4-37.1)33.3 (13.2-19.4)16.3 (10.7-19.5)15.1 (13.0-21.8)17.4 (22.0-29.4)25.7 (23.0-34.2)28.6 (18.4-34.2)23.3
%: relative frequency; ‡: chi-square test for heterogeneity; †: chi-square test for linear trend; NR: not recommended; Rec: recommended; Inc: increased; ∑SF: sum of triceps and subscapular skinfolds; TC: total cholesterol; BP: blood pressure; p: p-value; p-values lower than 0.05 were highlighted in bold.
Table 3 – Adjusted associations of steps per day and different types of screen time with cardiovascular risk factors in whole sample and by sex. Uruguaiana, Brazil.
Increased ∑SF Increased TC Increased BP
All male female All male female All male female
OR
(95%CI) (95%CI)OR (95%CI)OR (95%CI)OR (95%CI)OR (95%CI)OR (95%CI)OR (95%CI)OR (95%CI)OR Steps per day p = 0.305 p = 0.340 p = 0.649 p = 0.004 p = 0.048 p = 0.040 p = 0.012 p = 0.026 p = 0.309
Recommended 1 1 1 1 1 1 1 1 1 Not recommended (0.87;1.54)1.16 (0.81;1.85)1.22 (0.73;1.64)1.10 (1.20;2.71)1.80 (1.01;3.54)1.89 (1.03;3.06)1.77 (1.10;2.11)1.52 (1.07;2.82)1.74 (0.80;1.99)1.27 TV time p = 0.010 p = 0.301 p = 0.014 p = 0.018 p = 0.037 p = 0.167 p = 0.062 p = 0.433 p = 0.054 ≤ 2 hours/day 1 1 1 1 1 1 1 1 1 > 2 hours/day (1.10;1.97)1.47 1.25 (0.82-1.91) (1.11;2.53)1.68 (1.09;2.37)1.60 (1.04;3.36)1.87 (0.86;2.43)1.44 (0.98;1.89)1.36 (0.75;1.94)1.21 (0.99;2.50)1.58 VG time p = 0.157 p = 0.111 p = 0.583 p = 0.200 p = 0.199 p = 0.542 p = 0.770 p = 0.827 p = 0.547 ≤ 2 hours/day 1 1 1 1 1 1 1 1 1 > 2 hours/day (0.44;1.14)0.71 (0.38;1.11)0.65 (0.25;2.17)0.74 (0.31;1.28)0.63 (0.26;1.33)0.58 (0.13;2.86)0.62 (0.65;1.80)1.08 (0.59;1.94)1.07 (0.47;4.10)0.14 PC time p = 0.741 p = 0.400 p = 0.188 p = 0.961 p = 0.324 p = 0.313 p = 0.267 p = 0.218 p = 0.703 ≤ 2 hours/day 1 1 1 1 1 1 1 1 1 > 2 hours/day (0.71;1.28)0.95 (0.78;1.84)1.20 (0.50;1.15)0.75 (0.66;1.47)0.99 (0.41;1.34)0.74 (0.76;2.33)1.33 (0.86;1.70)1.21 (0.84;2.19)1.35 (0.68;1.77)1.10 Total screen time p = 0.490 p = 0.801 p = 0.497 p = 0.946 p = 0.552 p = 0.397 p = 0.127 p = 0.621 p = 0.062
≤ 2 hours/day 1 1 1 1 1 1 1 1 1
> 2 hours/day (0.50;1.39)0.83 (0.45;1.86)0.91 (0.36;1.64)0.77 (0.47;2.04)0.97 (0.45;4.53)1.42 (0.24;1.75)0.65 (0.36;1.13)0.64 (0.35;1.86)0.81 (0.20;1.04)0.46 Total screen time p = 0.703 p = 0.848 p = 0.623 p = 0.806 p = 0.187 p = 0.681 p = 0.646 p = 0.870 p = 0.291
≤ 2 hours/day 1 1 1 1 1 1 1 1 1
> 2-3 hours/day (0.42;1.45)0.78 (0.27;1.70)0.68 (0.37;2.10)0.88 (0.35;2.10)0.85 (0.08;2.63)0.45 (0.31;2.82)0.93 (0.28;1.20)0.58 (0.31;2.45)0.88 (0.12;0.95)0.33 > 3-4 hours/day (0.41;1.36)0.74 (0.40;2.15)0.93 (0.23;1.39)0.56 (0.36;2.08)0.86 (0.35;5.29)1.36 (0.15;1.65)0.49 (0.34;1.32)0.67 (0.32;2.31)0.86 (0.19;1.28)0.49 > 4-5 hours/day (0.56;1.99)1.06 (0.47;2.62)1.11 (0.37;2.57)0.99 (0.50;2.89)1.20 (0.63;8.67)2.34 (0.14;1.78)0.50 (0.33;1.35)0.67 (0.22;1.73)0.62 (0.241.82)0.66 > 5 hours/day (0.47;1.70)0.89 (0.45;2.63)1.09 (0.28;1.93)0.73 (0.53;3.21)1.31 (0.74;11.0)2.85 (0.13;1.67)0.47 (0.33;1.37)0.67 (0.33;2.51)0.92 (0.18;1.44)0.51
∑SF: sum of triceps and subscapular skinfolds; TC: total cholesterol; BP: blood pressure; OR: odds ratio; CI: confidence interval; p: p-value; Ref: reference category; p-values lower than 0.05 were highlighted in bold.
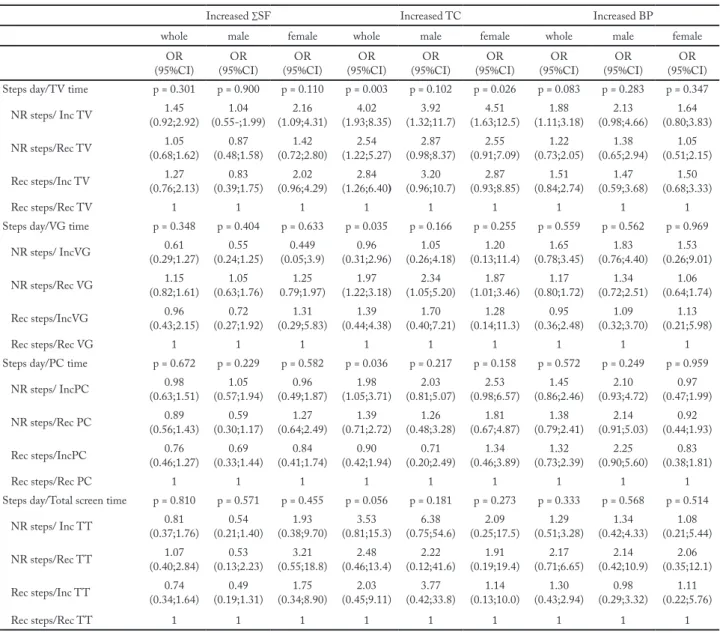
results from the unadjusted analyses, although some associations have lost significance. Overall, adolescents with not recommended step/day and increased screen time were more likely to present increased cardiovas-cular risk factors than those who did not meet the rec-ommendations for steps/day and screen time (table 4).
Discussion
This study examined the independent and combined as-sociations between steps/day and different types of screen time with cardiovascular risk factors in adolescents. The main findings were: i) in the independent analyses, TV time ( > 2 hours/day) was the only variable that was asso-Figure 1 – Distribution of cardiovascular risk factors according categories of combined steps per day/different types of screen in whole sample and by sex. Uruguaiana, Brazil.
Figure 1a - Categories of combined steps/day and TV time; Figure 1b - Categories of combined steps/day and VG time; Figure 1c - Cat-egories of combined steps/day and PC time; Figure 1d - CatCat-egories of combined steps/day and total screen time; P; p-value; NR steps: not recommended steps/day; Rec Steps: recommended steps/day; Rec TV: recommended TV time; Inc TV: increased TV time; Rec VG: recom-mended VG time; Inc VG: increased VG time; Rec PC: recomrecom-mended PC time; Inc PC: increased PC time; Rec ST: recomrecom-mended total screen time; Inc ST: increased total screen time.
ciated to increased ΣSF (not for male); ii) steps/day (not recommended) was independently associated to increased TC and BP (not for female); iii) overall, in the combined analyses, adolescents with not recommended steps/day and increased screen time ( > 2 hours/day), mainly in TV time, were more likely to present increased TC and BP.
The found results of the independent analyses showed that among all analyzed types of screen only TV time ( > 2 hours/day) was associated with cardio-vascular risk factor, being the only one among all the
analyzed predictor variables that was associated with increased ΣSF. Similar results were found in a study7 conducted with adolescents from three different areas of Europe. TV watching time was directly associated to adiposity (sum of four skinf olds) independently to physical activity (accelerometer) and of others con-founder variables. Another study15, analyzing adoles-cents from Spain, also found association between in-creased ( > 2 hours/day) screen time (sum of TV, PC and VG time) and adiposity (sum of four skinf olds) Table 4 – Adjusted associations of combined steps per day and different types of screen with cardiovascular risk factors in whole sample and by sex. Uruguaiana, Brazil.
Increased ∑SF Increased TC Increased BP
whole male female whole male female whole male female
OR
(95%CI) (95%CI)OR (95%CI)OR (95%CI)OR (95%CI)OR (95%CI)OR (95%CI)OR (95%CI)OR (95%CI)OR Steps day/TV time p = 0.301 p = 0.900 p = 0.110 p = 0.003 p = 0.102 p = 0.026 p = 0.083 p = 0.283 p = 0.347 NR steps/ Inc TV (0.92;2.92)1.45 (0.55-;1.99)1.04 (1.09;4.31)2.16 (1.93;8.35)4.02 (1.32;11.7)3.92 (1.63;12.5)4.51 (1.11;3.18)1.88 (0.98;4.66)2.13 (0.80;3.83)1.64 NR steps/Rec TV (0.68;1.62)1.05 (0.48;1.58)0.87 (0.72;2.80)1.42 (1.22;5.27)2.54 (0.98;8.37)2.87 (0.91;7.09)2.55 (0.73;2.05)1.22 (0.65;2.94)1.38 (0.51;2.15)1.05 Rec steps/Inc TV (0.76;2.13)1.27 (0.39;1.75)0.83 (0.96;4.29)2.02 (1.26;6.40)2.84 (0.96;10.7)3.20 (0.93;8.85)2.87 (0.84;2.74)1.51 (0.59;3.68)1.47 (0.68;3.33)1.50
Rec steps/Rec TV 1 1 1 1 1 1 1 1 1
Steps day/VG time p = 0.348 p = 0.404 p = 0.633 p = 0.035 p = 0.166 p = 0.255 p = 0.559 p = 0.562 p = 0.969 NR steps/ IncVG (0.29;1.27)0.61 (0.24;1.25)0.55 (0.05;3.9)0.449 (0.31;2.96)0.96 (0.26;4.18)1.05 (0.13;11.4)1.20 (0.78;3.45)1.65 (0.76;4.40)1.83 (0.26;9.01)1.53 NR steps/Rec VG (0.82;1.61)1.15 (0.63;1.76)1.05 0.79;1.97)1.25 (1.22;3.18)1.97 (1.05;5.20)2.34 (1.01;3.46)1.87 (0.80;1.72)1.17 (0.72;2.51)1.34 (0.64;1.74)1.06 Rec steps/IncVG (0.43;2.15)0.96 (0.27;1.92)0.72 (0.29;5.83)1.31 (0.44;4.38)1.39 (0.40;7.21)1.70 (0.14;11.3)1.28 (0.36;2.48)0.95 (0.32;3.70)1.09 (0.21;5.98)1.13
Rec steps/Rec VG 1 1 1 1 1 1 1 1 1
Steps day/PC time p = 0.672 p = 0.229 p = 0.582 p = 0.036 p = 0.217 p = 0.158 p = 0.572 p = 0.249 p = 0.959 NR steps/ IncPC (0.63;1.51)0.98 (0.57;1.94)1.05 (0.49;1.87)0.96 (1.05;3.71)1.98 (0.81;5.07)2.03 (0.98;6.57)2.53 (0.86;2.46)1.45 (0.93;4.72)2.10 (0.47;1.99)0.97 NR steps/Rec PC (0.56;1.43)0.89 (0.30;1.17)0.59 (0.64;2.49)1.27 (0.71;2.72)1.39 (0.48;3.28)1.26 (0.67;4.87)1.81 (0.79;2.41)1.38 (0.91;5.03)2.14 (0.44;1.93)0.92 Rec steps/IncPC (0.46;1.27)0.76 (0.33;1.44)0.69 (0.41;1.74)0.84 (0.42;1.94)0.90 (0.20;2.49)0.71 (0.46;3.89)1.34 (0.73;2.39)1.32 (0.90;5.60)2.25 (0.38;1.81)0.83
Rec steps/Rec PC 1 1 1 1 1 1 1 1 1
Steps day/Total screen time p = 0.810 p = 0.571 p = 0.455 p = 0.056 p = 0.181 p = 0.273 p = 0.333 p = 0.568 p = 0.514 NR steps/ Inc TT (0.37;1.76)0.81 (0.21;1.40)0.54 (0.38;9.70)1.93 (0.81;15.3)3.53 (0.75;54.6)6.38 (0.25;17.5)2.09 (0.51;3.28)1.29 (0.42;4.33)1.34 (0.21;5.44)1.08 NR steps/Rec TT (0.40;2.84)1.07 (0.13;2.23)0.53 (0.55;18.8)3.21 (0.46;13.4)2.48 (0.12;41.6)2.22 (0.19;19.4)1.91 (0.71;6.65)2.17 (0.42;10.9)2.14 (0.35;12.1)2.06 Rec steps/Inc TT (0.34;1.64)0.74 (0.19;1.31)0.49 (0.34;8.90)1.75 (0.45;9.11)2.03 (0.42;33.8)3.77 (0.13;10.0)1.14 (0.43;2.94)1.30 (0.29;3.32)0.98 (0.22;5.76)1.11
Rec steps/Rec TT 1 1 1 1 1 1 1 1 1
∑SF: sum of tríceps and subscapular skinfolds; TC: total cholesterol; BP: blood pressure; OR: odds ratio; CI: confidence interval; P: P-value; Ref: reference category; NR steps: not recommended steps/day; Rec Steps: recommended steps/day; Rec TV: recommended TV time; Inc TV: increased TV time; Rec VG: recommended VG time; Inc VG: increased VG time; Rec PC: recommended PC time; Inc PC: increased PC time; Rec ST: recommended total screen time; Inc ST: increased total screen time; p-values lower than 0.05 were highlighted in bold; predict variables in which the p-value of the analysis was greater than 0.05, but some category had odds ratio values in which the 95% confi-dence interval did not involve “1”were highlighted in bold.
independently of physical activity (accelerometer and self-reported) and of others confounder variables. As found in the present study, these both studies7,15 did not find associations between physical activity and the an-alyzed adiposity indicators. These results could suggest that sedentary time, measured by screen time, is more strongly associated to adiposity indicators than physical activity in adolescents. Nevertheless, other studies8-11 found associations only between physical activity and adiposity indicators independently of sedentary time.
The heterogeneity of the presented results in the in-dependent associations of the physical activity and sed-entary time with health outcomes in adolescents should be interpreted considering the differences in method-ological approaches from studies. The different ways to measuring physical activity and sedentary time (objec-tively and self-reported); whether or not to consider the context in which these behaviors occur; the different ways to considering the outcome (numeric or catego-rized); the different research design (cross-sectional or longitudinal); and the difference in statistics approaches; all of them may contribute to the different found results. In this perspective, the results from the present study add important information to this knowledge area, because sedentary time was considered from different types of screen time (individually and clustered) and this form to analyze the screen time is not frequently used3,5. Considering that TV time was the only of the different analyzed types of screen time to associate with cardio-vascular risk factors (ΣSF and TC), it suggest that be-sides analyzing the associations of sedentary time with health outcomes, it is important considering the types and context of the sedentary time. While increased time in some types of sedentary time, as TV watching, can be related to worse profile in health outcomes, others types, as reading, writing and drawing, cannot be related5.
Regardless sedentary time in the present study has been assessed by self-reporting, not providing ob-jective information about this behavior, it allowed to analyses separately the associations of different types of screen time with cardiovascular risk factors in ad-olescents. This characteristic can be considered one of the strengths of the study. The reasons for TV time being the only type of screen time to associate with cardiovascular risk factors is not established, but some hypothesis can be discussed. Watching TV while is eating (meals or snacking) are common behavior in adolescents7,11. These behavior can contribute to in-crease the energy intake and consequently to inin-crease
body weight, adiposity and blood lipids in adolescents. Although adolescents also may eat while using PC or playing VG, it is probably less frequent, because the way of involvement with these types of screen is dif-ferent. Using PC and playing VG are activities that require more involvement, reducing the opportunities to eat while the adolescent is performing the task. In addition, playing VG can even contribute to increase physical activity and consequently others health out-comes. A study with adolescents from the city of Pelo-tas/Brazil28 identified a direct association between the time playing VG and the meeting of the recommen-dation of physical activity. Authors suggested that ad-olescents could be encouraged to reproduce the actions of the games in physical activities. As soccer and fights are common games, it could help to explain the asso-ciation between playing VG and physical activity28. In addition, although it has not been considered to the extent of VG time in the present study, exergames may be part of the VG playing time of some adolescents and may contribute to increase physical activity and consequently others health outcomes as well.
In relation to the independent associations between steps/day and the analyzed cardiovascular risk factors, adolescents with not recommended steps/day were more likely to present increased TC and BP than those who met the recommendation. These finds are consis-tent with results of previous studies7-12,18 and reinforce that physical activity is associated to better profile of cardiovascular risk factors independently of sedentary time. Different from the others studies that mostly used accelerometers to estimate physical activity, in the present study pedometers were used. This feature may be considered other strength of the present study, be-cause the results suggest that steps/day are an overall measured of physical activity that is associated with cardiovascular risk factors being a practical and low cost way to measure physical activity in adolescents. In addition, steps/day is an objective measure of physical activity easily interpreted in free-living environments.
The mechanisms regulating influence of physical activity to a better profile of cardiovascular risk factors in adolescents are not fully explained. However, physi-cal activity seems to improve endothelial function29 and reducing arterial stiffness and intima media thickness of the carotid artery in adolescents30.This set of fea-tures is related to a better lipid metabolism and vas-cular health, helping to explain the found associations between steps/day, TC and BP.
Combined analyses of steps/day and different types of screen time showed that, overall, adolescents whose did not meet the recommendations for steps/day and screen time were more likely to present cardiovascular risk fac-tors than those who met the recommendations. Further, the results of these analyses indicate that steps/day are more important than different types of screen time in relation to cardiovascular risk factors. These findings cor-roborate the results from others studies that examined the combined associations between physical activity and sedentary time with cardiovascular risk factors4,10,18.
Although the results of combined analyses have suggested that steps/day were more important than different types of screen time in relation to cardio-vascular risk factors, the practical application of these results should consider both, the increase of physical activity and the decrease of screen time, mainly TV time. For this, the elaboration of strategies of increas-ing physical activity and decreasincreas-ing screen time in ad-olescents should bring together the public power and different society sectors, especially school and families.
Despite the contributions of the study, some lim-itations and its possible repercussions on the results should be discussed. Because this is a cross-section-al study, reverse causcross-section-ality is of concern. Although the analyses have been adjusted to a set of confounders, others important variables, as sleep time, diet and bi-ological maturation, that could influence the associa-tions of the steps/day and the different types of screen time with the analyzed cardiovascular risk factors were not included. In addition, the measured of steps/day and self-related screen time do not allow interpreting associations of the cardiovascular risk factors with in-tensity of the physical activity and with the total sed-entary time, respectively. This information could be analyzed if accelerometers have been used. Neverthe-less, some features strengthen the study and should be highlighted. The utilization of different types of screen time (separately and clustered) and the use of pedome-ter to measure physical activity are strengths previously discussed. Other strength of the study was using three important cardiovascular health outcomes. In addition, the sample size and its select procedure give it precision and representativeness. Such features increase the pow-er of the analyses and the intpow-ernal validity of the study. In summary, TV time is the only type of screen time independently of step/day associated with cardiovascular risk factors in adolescents. Steps/day is independently of screen time associated with cardiovascular risk factors in
adolescents. When screen time and steps/day are com-bined, steps/day is more important than different types of screen time in relation to cardiovascular risk factors in adolescents. Public health programs to improve and prevent cardiovascular health in adolescent should con-sider different strategies that offering opportunities for adolescents to increase their of physical activity practice and reduce their time in screen, especially TV time.
Conflict of interest
The authors declare no conflict of interest.
Authors’ contribution
Bergmann GG and Bergmann MLA helped in all steps of the study. Tassitano RM and Tenório MCM were involved in de-cisions about methodology and reviewed all steps of the study. Jorge M supervised and reviewed all steps of the study.
Acknowledgments
This work was supported by a grant (public notice recently doctor – FAPERGS 001/2011) from Fundação de Amparo à Pesquisa do Estado do Rio Grande do Sul, Brazil (FAPERGS).
References
1. Lee IM, Shiroma EJ, Lobelo F, Puska P, Blair SN, Katzmarzyk PT, et al. Effect of physical inactivity on major non-communicable diseases worldwide: an analysis of burden of disease and life expectancy. Lancet. 2012;380(9838):219-29.
2. Young DR, Hivert MF, Alhassan S, Camhi SM, Ferguson JF, Katzmarzyk PT, et al. Sedentary behavior and cardiovascular morbidity and mortality: a science advisory from the american heart association. Circulation. 2016;134(13):e262-79.
3. Rey-López JP, Bel-Serrat S, Santaliestra-Pasías A, Moraes AC, Vicente-Rodríguez G, Ruiz JR, et al. Sedentary behavior and clustered metabolic risk in adolescents: the HELENA study. Nutr Metab Cardiovasc Dis. 2013(10):1017-24.
4. Chaput JP, Saunders TJ, Mathieu MÈ, Henderson M, Tremblay MS, O’Loughlin J, et al. Combined associations between moderate to vigorous physical activity and sedentary behavior with cardiometabolic risk factors in children. Appl Physiol Nutr Metab. 2013;38(5):477-83.
5. Väistö J, Eloranta AM, Viitasalo A, Tompuri T, Lintu N, Karjalainen P, et al. Physical activity and sedentary behavior in relation to cardiometabolic risk in children: cross-sectional findings from the Physical Activity and Nutrition in Children (PANIC) Study.Int J Behav Nutr Phys Act. 2014;11:55.
6. Carson V, Tremblay MS, Chaput JP, Chastin SF. Carson et al. Associations between sleep duration, sedentary time, physical activity, and health indicators among Canadian children and youth using composition al analyses. Appl Physiol Nutr Metab. 2016;41(6 Suppl 3):S294-302.
7. Ekelund U, Brage S, Froberg K, Harro M, Anderssen SA, Sardinha LB, Riddoch C, Andersen LB. TV viewing and physical activity are independently associated with metabolic risk in children: the European Youth Heart Study. PLoS Med. 2006;3(12):e488.
Quote this article as:
Bergmann GG, Tassitano RM, Bergmann MLA, Tenório MCM, Mota J. Screen time, physical activity and cardiovascular risk factors in adoles-cents. Rev Bras Ati Fis Saúde. 2018;23:e0008. DOI: 10.12820/rbafs.23e0008
8. Steele RM, van Sluijs EM, Cassidy A, Griffin SJ, Ekelund U. Targeting sedentary time or moderate- and vigorous intensity activity: independent relations with adiposity in a population-based sample of 10-y-old British children. Am J Clin Nutr. 2009;90(5):1185-92.
9. Chaput JP, Lambert M, Mathieu ME, Tremblay MS, O’ Loughlin J, Tremblay A. Physical activity vs. sedentary time: independent associations with adiposity in children. Pediatr Obes. 2012;7(3):251-8.
10. Ekelund U, Luan J, Sherar LB, Esliger DW, Griew P, Cooper A. Moderate to vigorous physical activity and sedentary time and cardiometabolic risk factors in children and adolescents. JAMA. 2012;307(7):704-12.
11. Ferrari GLM, Oliveira LC, Araujo TL, Matsudo V, Barreira TV, Tudor-Locke C, Katzmarzyk P. Moderate-to-vigorous physical activity and sedentary behavior: independent associations with body composition variables in brazilian children. Pediatr Exerc Sci. 2015;27(3):380-9.
12. Skrede T, Stavnsbo M, Aadland E, Aadland KN, Anderssen SA, Resaland GK, et al. Moderate-to-vigorous physical activity, but not sedentary time, predicts changes in cardiometabolic risk factors in 10-y –old children: the Active Smarter Kids Study. Am J Clin Nutr. 2017;105(6):1391-98.
13. Mark AE, Janssen I. Relationship between screen time and metabolic syndrome in adolescents. J Public Health (Oxf). 2008;30(2):153-60.
14. Danielsen YS, Júlíusson PB, Nordhus IH, Kleiven M, Meltzer HM, Olsson SJ, et al. The relationship between life-style and cardio-metabolic risk indicators in children: the importance of screen time. Acta Paediatr. 2011;100(2):253-9.
15. Rendo-Urteaga T, Moraes AC, Collese TS, Manios Y, Hagströmer M, Sjöström M, et al. The combined effect of physical activity and sedentary behaviors on a clustered cardio-metabolic risks core: The Helena study. Int J Cardiol. 2015;186:186-95.
16. Ekelund U, Steene-Johannessen J, Brown WJ, Fagerland MW, Owen N, Powell KE, et al. Does physical activity attenuate, or even eliminate, the detrimental association of sitting time with mortality? A harmonized meta-analysis of data from more than 1 million men and women. Lancet. 2016;388(10051):1302-10.
17. Andersen RE, Crespo CJ, Bartlett SJ, Cheskin LJ, Pratt M. Relationship of physical activity and television watching with body weight and level of fatness among children: results from the Third National Health and Nutrition Examination Survey. JAMA. 1998;279(12):938-42.
18. Porter AK, Matthews KJ, Salvo D, Kohl HW 3rd. Associations of physical activity, sedentary time, and screen time with cardiovascular fitness in United States Adolescents: results from the NHANES National Youth Fitness Survey. J Phys Act Health. 2017;14(7):506-12.
19. Going S. Physical Best—Body composition in the assessment of youth fitness. J Phys Educ Recreat Dance. 1988;59(7):32-36.
20. Martinez TLR, Santos RD, Armaganijan D, Torres KP, Loures-Vale A, Magalhães ME, et al. National alert campaign about increased cholesterol: determination of cholesterol levels in 81,262 Brazilians. Arq Bras Cardiol. 2003;80(6):635-38.
21. Sposito AC, Caramelli B, Fonseca FA, Bertolami MC, Afiune NA, Souza AD, et al. IV Brazilian guideline for dyslipidemia and atherosclerosis prevention: Department of Atherosclerosis of Brazilian Society of Cardiology. Arq Bras Cardiol. 2007;88(Suppl 1):2-19.
22. Christofaro DGD, Fernandes RA, Gerage AM, Alves M J, Polito MD, Oliveira AR. Validação do monitor de medida de pressão arterial Omron HEM 742 em adolescentes. Arqui Bras Cardiol. 2009;92(1):10-15.
23. Falkner B, Daniels SR. Summary of the fourth report on the diagnosis, evaluation, and treatment of high blood pressure in children and adolescents. Hypertension. 2004;44(4):387-88.
24. Duncan JS, Schofield G, Duncan EK. Pedometer-determined physical activity and body composition in New Zealand children. Med Sci Sports Exerc. 2006:38(8):1402-09.
25. Tudor-Locke C, Pangrazi RP, Corbin CB, Rutherford WJ, Vincent SD, Raustorp A, Cuddihy TF. BMI-referenced standards for recommended pedometer-determined steps/ day in children. Prev Med. 2004;38:857-864.
26. Tremblay MS, LeBlanc AG, Kho ME, Saunders TJ, Larouche R, Colley RC, Goldfield G, Connor Gorber S. Systematic review of sedentary behaviour and health indicators in school-aged children and youth. Int J Behav Nutr Phys Act. 2011;8:98.
27. ABEP-Associação Brasileira de Empresas de Pesquisa. 2012. Disponível em: http://www.abep.org.
28. Hallal PC, Bertoldi AD, Gonçalves H, Victora CG. Prevalência de sedentarismo e fatores associados em adolescentes de 10-12 anos de idade. Cad. Saúde Pública. 2006;22(6): 1277-87.
29. Torrance B, McGuire KA, Lewanczuk R, McGavock J. Overweight, physical activity and high blood pressure in children: a review of the literature. Vasc Health Risk Manag. 2007:3(1)139-49.
30. Farpour-Lambert NJ, Aggoun Y, Marchand LM, Martin XE, Herrmann FR, Beghetti M. Physical activity reduces systemic blood pressure and improves early markers of atherosclerosis in pre-pubertal obese children. J Am Coll Cardiol. 2009;54(25):2396-406.
Recebido: 03/07/2017 Aprovado: 25/09/2017