UNIVERSIDADE DA BEIRA INTERIOR
Ciências da Saúde
Modulation of Microglial Activity by GDNF
Diogo Alexandre da Silva Tomé
Dissertação para obtenção do Grau de Mestre em
Ciências Biomédicas
(2º ciclo de estudos)
Orientador: Prof. Doutora Graça Baltazar
Co-orientador: Mestre Julieta Oliveira
ii
Agradecimentos
Em primeiro lugar quero agradecer à minha família, em especial aos meus pais e ao meu irmão por todo o amor e carinho, pelo apoio incondicional e por acreditarem sempre em mim. À Professora Doutora Graça Baltazar pela oportunidade de desenvolver este projecto, por todos os conhecimentos transmitidos, pela disponibilidade e apoio constante e pela qualidade de orientação deste trabalho.
Às minhas colegas de laboratório, Rita, Filipa, Daniela e Julieta por todo o apoio e amizade, por estarem sempre prontas a ajudar e pelos bons momentos passados dentro e fora do laboratório. Um especial obrigado à minha co-orientadora Julieta Oliveira por todos os conhecimentos transmitidos, pela disponibilidade constante e por todos os conselhos e sugestões que foram essenciais para o desenvolvimento desta tese.
Às minhas colegas de casa e grandes amigas, Rita e Filipa, por todos os bons momentos passados na cidade da Covilhã, por toda a amizade e pelo apoio nos momentos mais difíceis e por tornarem a minha estadia na Covilhã a melhor possível.
Ao meu colega e amigo Bruno pela sua amizade ao longo destes cinco anos, por toda a ajuda durante este percurso académico, por todos os bons momentos passados, pelo seu apoio e compreensão nos momentos mais difíceis.
iii
Resumo Alargado
A doença de Parkinson é a segunda doença neurodegenerativa mais comum depois da doença de Alzheimer. É uma doença associada ao envelhecimento que afecta cerca de 0,3% da população nos países desenvolvidos. A sua principal característica patológica é a perda dos neurónios dopaminérgicos da substantia nigra pars compacta, ao nível do mesencéfalo, o que resulta numa diminuição de dopamina no estriado. Esta diminuição traduz-se principalmente em sintomas motores como tremor, bradicinesia, rigidez muscular e instabilidade postural. No entanto, sintomas não motores como depressão, distúrbios no sono, alterações sensoriais e cognitivas são também característicos desta patologia. Apesar de a sua etiologia não ser conhecida, várias evidências indicam que a neuroinflamação, mediada pela microglia, pode ser um factor de risco para o início e progressão desta doença. A microglia activada desempenha várias funções essenciais à sobrevivência neuronal como a libertação de factores neurotróficos e anti-inflamatórios, imunidade inata e remoção de restos celulares tóxicos, mas, em certas situações, pode-se tornar nociva para os neurónios vizinhos devido à libertação em excesso de citocinas pro-inflamatórias e espécies reactivas de oxigénio e azoto. Por isso torna-se crucial tentar perceber quais os mecanismos capazes de regular a reactividade microglial. O factor neurotrófico derivado de uma linha de células da glia (GDNF), um potente factor protector para os neurónios dopaminérgicos, é capaz de inibir o aumento da libertação de espécies reactivas de oxigénio e a fagocitose induzido por um agente inflamatório em culturas de microglia do mesencéfalo ventral, mas os mecanismos moleculares subjacentes à sua acção permanecem desconhecidos. Sabe-se que este controlo da actividade microglial exercido pelo GDNF depende do GFRα1, no entanto a sinalização celular mediada por este co-receptor pode estar acoplada ao receptor transmembranar tirosina cinase RET ou à molécula de adesão celular NCAM. O complexo GDNF-GFRα1 pode interagir com o RET, levando à sua dimerização e subsequente transfosforilação do seu domínio tirosina cinase intracelular ou pode interagir com a molécula NCAM o que leva à fosforilação das cinases intracelulares Fyn e FAK. Para determinar qual a via de sinalização envolvida no controlo da actividade microglial pelo GDNF avaliou-se o efeito do GDNF na actividade do receptor RET e da proteína FAK e o efeito da inibição da FAK, logo da via do NCAM, na acção do GDNF. Para a realização das experiências, usaram-se culturas primárias de microglia do mesencéfalo ventral. O GDNF foi capaz de prevenir o aumento do número de células fagocíticas induzido pelo lipopolissacarídeo (LPS), quando a FAK estava inibida. Em concordância como estes resultados, o GDNF não teve qualquer efeito nos níveis de fosforilação da FAK, mas parece impedir a diminuição dos níveis de fosforilação do RET induzida pelo LPS o que indica que estabeleceu ligação com este receptor levando-o a sua fosforilação. Para verificar se existem alterações nos níveis de GDNF, ou nas proteínas envolvidas na sua via de sinalização, na doença de Parkinson recorreu-se a um modelo animal em que a degeneração dopaminérgica é induzida por injeção intranigral de LPS. Os resultados
iv
obtidos apontam para uma diminuição dos níveis de GFRα-1 na substantia nigra dos animais expostos ao LPS. Juntos, estes resultados indicam que o controlo da actividade microglial exercido pelo GDNF envolve o receptor RET e não a molécula de adesão celular NCAM. Os ensaios in vivo parecem sugerir um possível comprometimento da via de sinalização do GDNF na doença de Parkinson devido aos baixos níveis de GFRα-1 encontrados na substantia nigra dos animais injectados com LPS.
Palavras-chave
v
Abstract
Parkinson’s disease (PD) is an age-related disease characterized by the degeneration of dopaminergic neurons in the substantia nigra pars compacta (SNpc). Increasing evidence suggests that inflammation and oxidative stress mediated by activated microglia, the resident immune cells of the central nervous system (CNS), play a critical role in dopaminergic neuronal loss and in the pathophysiology of PD. For this reason, it is crucial to understand the mechanisms capable of controlling microglial reactivity. Glial cell line-derived neurotrophic factor (GDNF), a potent neuroprotective factor for dopaminergic neurons, is able to inhibit the increase in the production of reactive oxygen species (ROS) and in the phagocytosis triggered by an inflammatory agent in midbrain microglial cells, but the mechanisms by which GDNF exerts its effects on microglia are still not completely understood. The control of microglia activation exerted by GDNF depends on GFRα1. However, the signalling mechanism mediated by this co-receptor can be coupled to the transmembrane RET tyrosine kinase or to the cell adhesion molecule NCAM. To elucidate which are the signalling pathways involved in the modulation of microglial activity by GDNF, the effect of GDNF on the activity of RET and of the NCAM target, the focal adhesion kinase (FAK), and the effect of FAK inhibition in GDNF action were evaluated. For these experiments, LPS-stimulated midbrain microglia cultures were used. GDNF was able to inhibit the increase in the number of phagocytic cells triggered by LPS in midbrain microglia cultures when FAK was inhibited. Furthermore, GDNF had no effect on FAK phosphorylation levels but it seems to prevent the decrease in RET phosphorylation levels induced by LPS. In order to determine possible changes in GDNF levels, or in the proteins associated with GDNF signal transduction in PD, an animal model of PD based on the intranigral injection of LPS was used. The results showed that exposure to LPS induces a significant reduction in the GFRα-1 levels in the injected SN. Taken together, these results suggest that the modulation of microglial activity by GDNF involves the receptor RET and not the cell adhesion molecule NCAM. Furthermore, the GDNF signalling may be impaired in PD due to low levels of GDNF co-receptor GFRα-1 in the SN of LPS-exposed animals.
Keywords
Parkinson’s disease, Neuroinflammation, Oxidative stress, Microglia, GDNF, GFRα1, RET, NCAM
vi
Index
1 Introduction 1
1.1 Parkinson’s Disease 1
1.1.1 Pathophysiology of Parkinson’s disease 1.1.2 Mechanisms of Neurodegeneration
1.1.2.1 Mitochondrial Dysfunction and Oxidative Stress 1.1.2.2 Excitotoxicity
1.1.2.3 Proteasomal and Lysosomal Dysfunction 1.2 Neuroinflammation
1.2.1 Microglia
1.2.2 The role of Microglia in Dopaminergic Degeneration 1.3 Modulation of Microglial Activity
1.3.1 Glial cell line-derived neurotrophic factor 2 Materials and Methods
2.1 Animals
2.2 Stereotaxic Surgery 2.3 Cell Cultures
2.3.1 Postnatal Ventral Midbrain Microglia Cultures 2.3.2 N9 Microglia Cell Line
2.4 Stimulation of Microglia 2.5 Nitric Oxide Assay 2.6 Phagocytosis Assay 2.7 Western Blot
2.8 Data Analysis and Statistics 3 Results
3.1 GDNF does not inhibit LPS-mediated NO production in N9 microglia cell line
3.2 Modulation of LPS-induced NO production by GDNF: is the NCAM pathway involved?
3.3 Blockade of the NCAM pathway does not impede inhibition of LPS mediated phagocytosis by GDNF
3.4 GDNF modulation of RET and FAK activity in LPS-exposed midbrain microglia cultures
3.5 Is there an impairment of GDNF signalling in an animal model of Parkinson’s disease? 4 Discussion/Conclusions 2 3 3 5 5 7 8 10 11 12 15 15 15 15 15 16 16 16 17 17 18 19 19 21 22 23 26 28
vii
5 Future Perspectives 6 Bibliography
30 31
viii
List of Figures
Figure 1 –Key molecular mechanisms currently accepted to participate in the degeneration
of dopaminergic neurons in the substantia nigra in Parkinson disease... 6
Figure 2 – Classically M1 and alternatively M2 activated microglial cell phenotypes... 9
Figure 3 - Microglial activation promotes progressive neurotoxicity... 11
Figure 4 - Intracellular signalling pathways mediated by GDNF... 13
Figure 5 - Effect of GDNF on LPS-mediated NO production in N9 microglia cell line... 20
Figure 6 - Effect of FAK inhibition in GDNF modulation of LPS-mediated NO production in midbrain microglia cultures... 21
Figure 7 - Effect of FAK inhibition in GDNF modulation of LPS-mediated phagocytosis in midbrain microglia cultures... 23
Figure 8 - Analysis of GDNF-mediated activation of NCAM signalling in midbrain microglia cultures... 24
Figure 9 - Analysis of GDNF-mediated activation of RET signalling in midbrain microglia cultures... 25
Figure 10 - Analysis of GDNF, GFRα-1, NCAM, TH and Iba-1 levels in the substantia nigra of Fischer rats injected with LPS... 27
ix
List of Acronyms
BDNF Brain-Derived Neurotrophic Factor BG CCL2 CNS CSF1 CX3CR1 DAMPs FAK FRS2 GDNF GFLs GFRα Gpe GPi HMGB1 Iba-1 IFNγ LBs LPS MAPK MCP-1 MMP3 NCAM NOS NTFs PAMPs PD PI3K PLCγ PRRs RAGE RNS ROS SN SNpc STN TGFβ TH TLR TNFα UPS Basal ganglia CC-chemokine ligand 2 Central nervous system Colony-stimulating factor 1 CX3C chemokine receptor 1
Damage-associated molecular patterns Focal adhesion kinase
Fibroblast growth factor receptor substrate 2 Glial cell line-derived neurotrophic factor GDNF family of ligands
GDNF-family receptor-α
External segment of the Globus Pallidus Internal segment of the Globus Pallidus High-mobility group box 1
Ionized calcium-binding adaptor molecule-1 Interferon-gamma
Lewy bodies Lipopolysaccharide
Mitogen-activated protein kinases Monocyte chemotactic protein-1 Matrix metalloproteinase 3 Neural cell adhesion molecule Nitric oxide synthase
Neurotrophic factors
Pathogen-associated molecular patterns Parkinson’s Disease
Phosphatidylinositol-3 kinase Phospholipase Cγ
Pattern-recognition receptors
Receptor for advanced glycation end-products Reactive nitrogen species
Reactive oxygen species Substantia nigra
Substantia nigra pars compacta Subthalamic Nucleus
Transforming Growth Factor-β Tyrosine Hydroxylase
Toll-like receptor
Tumour necrosis factor α Ubiquitin–proteasomal system
1
Chapter 1: Introduction
1.1. Parkinson’s Disease
Parkinson’s Disease (PD) is the second most common neurodegenerative disorder after Alzheimer disease (Long-Smith et al. 2009), being first described in 1817 by Dr. James Parkinson in “An Essay on the Shaking Palsy” (Parkinson, 1817). It is an age-related disease that affects approximately 0.3% of the population in industrialized countries. The prevalence of this disease increases to 1% in people over the age of 60 years and 4% over the age of 80 (de Lau & Breteler 2006). In 90-95 % of cases, PD occurs in an idiopathic manner, whilst in the remaining 5-10% of cases, a genetic mutation is present (Toulouse & Sullivan 2008). The main pathological feature of PD is the degeneration of dopaminergic neurons of the substantia nigra pars compacta (SNpc) in the midbrain, resulting in the loss of their ascending projections to the striatum (composed by the caudate and putamen), the input zone of the basal ganglia (BG) complex (Long-Smith et al. 2009). This decrease in dopaminergic tone leads to the majority of the classical motor symptoms of PD. Initially it manifests clinically as a slight rhythmic tremor, usually of a limb (Wolters 2008). With the progression of the disease others symptoms like bradykinesia, tremor at rest, gait disturbances, postural instability and rigidity start to develop. Loss of facial expression, speech and swallowing difficulties and micrographia are also common. The symptoms usually start on one side of the body and later become bilateral (Jankovic 2008; Wolters 2008). Morerecently, PD has become recognized as a more complex illness covering both motor and nonmotor symptoms like depression, sleep disturbance, sensory abnormalities, autonomic dysfunction, constipation and cognitive decline (Wolters 2008). In addition to the loss of dopaminergic neurons, PD is also characterized by the presence of round intracytoplasmic insoluble protein inclusions called Lewy bodies (LBs) in the remaining neurons. The main component of LBs is a misfolded α-synuclein,a small protein of 140 amino acids, but others proteins such as ubiquitin where also found in these cytoplasmic inclusions (Licker et al. 2009; Gundersen 2010). Importantly, many nondopaminergic nuclei are affected in PD, including the locus coeruleus, reticular formation of the brain stem, raphe nucleus, dorsal motor nucleus of the vagus, basal nucleus of the Meynert, amygdala, and hippocampus (Jellinger 2012). These entire nuclei degenerate with Lewy Body pathology, suggesting a pathogenic process in common with that occurring in the SNpc and it is this degeneration that can explain some of the nonmotor symptoms associated with PD (Dexter & Jenner 2013). The therapies currently available for PD are not effective in the long-term and cannot put an end to the ongoing neurodegeneration. The most commonly used treatment is the drug levodopa or L-DOPA, which is a dopamine precursor that replaces dopamine in the denervated striatum and relieves motor symptoms. Surgical methods, such as deep brain stimulation, have also been used with good success, but are not widely available
2
or applicable for all patients (Sullivan & Toulouse 2011). In conclusion, none of the current treatments provide safe and long-lasting relief from the symptoms and none of them can stop the progression of the disease, therefore it is crucial to understand the mechanisms that lead to the neurodegenerative process, in order to develop new therapies to improve the quality of life of PD patients.
1.1.1 Pathophysiology of Parkinson’s disease
The degeneration of part of the dopaminergic neurons in the SNpc results in a specific disorganization of the complicated BG circuits. The BG are a group of nucleus situated at the base of the forebrain and are strongly connected with the cerebral cortex, thalamus and other brain areas. They play a role in the initiation of voluntary movements, facilitation of some motor programs, suppression of others and they are also involved in various emotional and cognitive functions (Bartels & Leenders 2009). The motor circuit within the BG complex arises from the striatum, especially from the putamen, that in addition to the dopaminergic projections also receive inputs from cortical areas. There are two distinct pathways originating in the striatum: the releasing Direct Pathway and the movement-inhibiting Indirect Pathway (Graybiel 2005). From the putamen, neurons in the direct pathway project to the internal segment of the Globus Pallidus (GPi) and the Substantia Nigra pars Reticulata (SNpr), the output nuclei of the BG. As these neurons are GABAergic they provide a direct inhibitory effect on GPi/SNpr neurons (also GABAergic), hereby reducing the inhibitory effect of these nuclei on the ventral anterior and ventral lateral nuclei of the dorsal thalamus which in turn project directly to the motor areas of the cerebral cortex. This disinhibition of the thalamic neurons allows the transmission of signals to the motor cortex and thus the initiation of movements (Bartels & Leenders 2009; Jellinger 2012). The indirect pathway connects the putamen with the external segment of the Globus Pallidus (GPe) which sends GABAergic projections to the Subthalamic Nucleus (STN). Stimulation of striatal projection neurons in the indirect pathway leads to inhibition of the GPe, disinhibition of the STN and excitation of the GPi/SNpr, because STN send excitatory glutamatergic axons to the GPi/SNpr nuclei, enhancing the inhibitory effect on the thalamus and then suppressing movements (Bartels & Leenders 2009; Jellinger 2012). In this neuronal circuit, dopamine exerts a dual effect on striatal neurons, due to the differential expression of two types of dopamine receptors (types D1 and D2) in these cells. Striatal neurons in the direct pathway express dopamine D1 receptors that stimulate the production of cAMP through G-proteins mechanisms while neurons in the “indirect pathway” express dopamine D2 receptors that act through different G-proteins, inhibiting cAMP production. So dopaminergic neurons from the SNpc can provide excitatory inputs to the striatal cells in the “direct pathway” and inhibitory inputs in the “indirect pathway”, thus facilitating movement. According to this model, dopamine deficiency leads to reduced inhibition of the indirect pathway and reduced excitation of the direct pathway which results in an excessive activation of the GPi and SNpr and consequently
3
inhibition of thalamocortical and brainstem motor systems, leading to the motor symptoms that characterize PD (Bartels & Leenders 2009; Gerfen 2004).
1.1.2 Mechanisms of Neurodegeneration
The etiopathogenesis of PD is still not fully understood. As mentioned above, in most cases the disease is sporadic, it occurs in an idiopathic manner while in the remaining cases is familial as a result of genetic inheritance.Nevertheless, old age continues to be the main risk factor in the development of this disease because during the normal process of aging, our cells display a greater degree of dysfunction which can lead to cell stress (including decreased capacity to cope with oxidative stress) and greater energy demand (Perfeito et al. 2013; Schapira & Jenner 2011). Besides aging, some environmental toxins have been associated with an increased risk of developing PD. Proof of this was the discovery that a side product produced in the synthesis of the narcotic drug meperidine, namely N-methyl-4-phenyl-1,2,3,6-tetrahydropyridine (MPTP), caused parkinsonism in rodents, primates and humans. This neurotoxin, more specifically, its metabolite 1-methyl-4-phenylpyridinium (MPP+) can induce the degeneration of the nigrostriatal pathways, by inhibiting mitochondrial complex I of the respiratory chain, increasing oxidative stress levels in dopaminergic neurons (Perfeito et al. 2013). Other toxin that acts as an inhibitor of the mitochondrial respiratory chain complex I is the pesticide rotenone, commonly used by gardeners, which can cause typical features of PD in rodents (Sherer et al. 2003). A large number of environmental situations and agents such as farming, gardening and rural life, industrial chemicals, metals and pesticide exposure have been associated with PD, however, no conclusive relationships between individual studies have been made (Di Monte 2003). Other factor that has to be mentioned is genetic mutations. So far 17 autosomal dominant and autosomal recessive gene mutations have been associated with familial forms of PD. These include α-synuclein mutations and triplication (PARK1 and PARK4), parkin (PARK2), ubiquitin carboxyl-terminal hydrolase L1 (UCH-L1) (PARK5), DJ-1 (PARK7), phosphatase and tensin homolog-inducible kinase 1 (PINK1) (PARK6), leucine-rich repeat kinase 2 (LRRK2) (PARK8), and glucocerebrosidase (GBA) (Spatola & Wider 2014). It is noteworthy that common polymorphisms within two of these genes (α-synuclein genes and LRRK2) are associated with risk factors for sporadic PD (Spatola & Wider 2014). At last, there are several molecular mechanisms that are widely accepted to participate in the neurodegenerative process in PD, including mitochondrial dysfunction, oxidative stress, proteasomal and lysosomal dysfunction, excitotoxicity and neuroinflammation (Dexter & Jenner 2013).
1.1.2.1 Mitochondrial Dysfunction and Oxidative Stress
As described above, some toxins like MPTP and rotenone that can act as complex I inhibitors cause Parkinsonism and most of the genes known to cause familial PD are also involved in some aspects of mitochondrial function. Such evidences suggest an involvement of mitochondria in the pathogenesis of PD. Some studies have shown a decrease in complex I
4
activity and expression in the SN and frontal cortex of PD patients (Schapira et al. 1990; Navarro et al. 2009). Oxidized, functionally impaired and misassembled complex I subunits have also been reported in PD as well an impaired activity of the electron transport chain (Keeney et al. 2006). A key Krebs cycle enzyme, α-ketoglutarate dehydrogenase, was also shown to be impaired (Dexter & Jenner 2013). Genetic investigations in familial PD have shown that mutations in α-synuclein, parkin, PINK1, DJ-1 and LRRK2 genes lead to altered protein localization in mitochondria, abnormalities in its structure and function and a decrease in complex I assembly and activity. For example, loss of function of DJ-1, parkin and PINK1 decreases mitochondrial protection against oxidative stress and reduces the cells’ ability to remove damaged mitochondria by autophagy (mitophagy) when the function of parkin and PINK1 are affected (Schapira & Jenner 2011; Dexter & Jenner 2013). This impairment in mitochondrial function not only leads to a deficit in energy supply, but also increases oxidative stress as a consequence of complex I dysfunction. Complex I is the major site of superoxide (O2-) production in the electron transport chain and its dysfunction leads to increased levels of this radical (Navarro & Boveris 2009).
Analysis of biochemical markers for oxidative damage in tissue samples from patients or in post-mortem brains suggests a role of oxidative stress in the pathogenesis of PD. In fact, increased levels of lipid peroxidation, suggested by decreased levels of polyunsaturated fatty acids and increased levels of its end-products like malondialdehyde and 4-hydroxynonenal, were observed in the SNpc of patients with PD. The nucleic acid oxidation product 8-hydroxyguanosine and oxidized protein carbonyls are also elevated in the SNpc (Dexter & Jenner 2013). Together with this increase in oxidative damage, several studies also reported a decrease in reduced glutathione levels in the SNpc of PD patients (Sian et al. 1994). In addition to the mitochondria another specific factor that contributes to the production of free radicals is iron which is present in large amounts in PD SNpc. By the Fenton-Haber Weiss reaction, iron can convert hydrogen peroxide (H2O2), generated during normal metabolism or during electron transport chair, into the extremely toxic hydroxyl radical (.OH) which in turn may elicit cellular damage, lipid peroxidation and apoptosis (Perfeito et al. 2013; Antony et al. 2013). Nitric oxide (.NO) can also lead to oxidative damage in the SN which is particularly vulnerable to its toxic effects due to the presence of 6-hydroxydopamine (6-OHDA). This compound readily reacts with .NO generating dopamine semiquinones that can covalently modify protein structures (Hastings 2009). .NO can also react with O
2- to form the highly toxic peroxynitrite (ONOO-) which induces cellular damage through protein nitration, lipid peroxidation and DND fragmentation. .NO and ONOO- can also inhibit mitochondria complex I which leads to the increase of O2- production (Navarro & Boveris 2009). Dopamine itself can also contribute to the oxidative damage in the SNpc of PD patients. When dopamine exists outside the synaptic vesicles in a damaged neuron, it can be easily metabolised by monoamine oxidase (MAO) into dihydroxyphenylacetic acid (DOPAC) and H2O2. In addition, the autoxidation of dopamine, a process that results in the formation of the pigment
5
neuromelanin, generates O2- and H2O2 but also produces the electron-deficient dopamine quinones or semiquinones that can modify protein structures and alter their function (Hastings 2009; Navarro & Boveris 2009). Subsequently H2O2 may react with iron by the Haber-Weiss Fenton reaction, producing .OH and O
2- which in turn may interact with NO forming ONOO-. Mitochondrial dysfunction and increased oxidative stress were also predicted to overload the ubiquitin–proteasomal system (UPS) of protein degradation which can lead to accumulation of misfolded or damaged proteins (Jenner Peter 2003). Thus, the combination of mitochondrial dysfunction, oxidative stress and dopamine oxidation probably increases the vulnerability of dopaminergic neurons to degeneration in PD.
1.1.2.2 Excitotoxicity
There are several lines of evidence suggesting that excitotoxicity, a process resulting from the overstimulation of glutamate receptors, can play a role in the degeneration of dopaminergic neurons. Such evidences suggest a protective effect of the glutamate receptor N-methyl-D-aspartate (NMDA) antagonists in the MPP+ mediated neurotoxicity (Dexter & Jenner 2013). The major contributor for this phenomenon is the overactivity of the STN which releases glutamate to the SNpc and to the GPi (Steigerwald et al. 2008). In fact, pharmacologic blockade of STN neurotransmission to the SNpc ameliorates parkinsonian symptoms. Mitochondrial dysfunction can also lead to excitotoxicity in PD because it causes an impairment of energy metabolism which leads to an increase of glutamate release, exacerbating NMDA receptor activation (Perfeito et al. 2013). This toxic effect is caused by a massive influx of extracellular calcium resulting from the overactivation of the NMDA receptor. Once inside the cell, calcium activates several calcium-dependent enzymes involved in the degradation of proteins, phospholipids and nucleic acids. One of these intracellular enzymes is neuronal nitric oxide synthase (nNOS), leading to the formation of NO which readily reacts with the O2- to form ONOO- (Rego & Oliveira 2003). Activation of these pathways may also lead to necrotic cell death, mitochondrial dysfunction, membrane breakdown, cytoskeletal alterations, and apoptosis (Perfeito et al. 2013).
1.1.2.3 Proteasomal and Lysosomal Dysfunction
The presence of several proteins in Lewy bodies, especially α-synuclein, led to the idea that the mechanisms responsible for removing damaged or mutated proteins might be disrupted in PD. So researchers focused their attention in the roles of the ubiquitin–proteasome system (UPS) and lysosomes in the pathogenesis of PD. The involvement of the UPS in PD was supported by the discovery that mutations in parkin, which function as an ubiquitin-protein ligase, and UCH-L1, which is a deubiquitin enzyme, cause familial forms of PD (Gundersen 2010). In fact, changes in the catalytic activity and composition of the 26S proteasome were observed in the SNpc in PD (McNaught & Jenner 2001). The protein Skp1, which is an ubiquitin ligase, is reduced in the SNpc of PD patients and its silencing induced intraneuronal protein accumulations and death of dopaminergic neurons in culture (Fishman-Jacob et al. 2009).
6
Moreover, studies with experimental animals revealed that administration of proteasome inhibitors induces parkinsonism and a selective degeneration of dopaminergic neurons (McNaught et al. 2004). However these findings are controversial because they could not be reproduced by others groups (Kordower et al. 2006; Manning-Boǧ et al. 2006). So researchers start to investigate lysosomes and autophagy (macro-autophagy, micro-autophagy, and chaperone-mediated autophagy) in PD. There is an increase in the number of autophagosomes in the SNpc in PD and Lewy bodies contain autophagy-related proteins. The expression of chaperone proteins associated with autophagy such as lysosome-associated membrane protein type 2A (LAMP2A) and heat shock protein 70 is reduced in SNpc and amygdala of PD brains and decrease levels of LAMP2A in dopaminergic cell lines reduced chaperone-mediated autophagy activity and increased the half-life of α-synuclein (Alvarez-Erviti et al. 2010). In addition, MPTP-treated mice show a depletion of lysosomes in dopaminergic cells due to abnormal permeabilization of lysosomal membranes caused by increased oxidative stress (Dehay et al. 2010). Another proof that links lysosomal dysfunction to PD comes from mutations in the GBA gene that leads to a deficiency of the lysosomal enzyme GCase. Recently, a GCase deficiency was reported in the SNpc of patients with sporadic PD (Gegg et al. 2012). This deficiency leads to α-synuclein accumulation both in vitro and in vivo (Xu et al. 2011).
Finally, neuroinflammation is also recognized as a major factor in PD pathogenesis and increasing evidence suggest that microglia, the resident immune cells of the central nervous system (CNS), is the main source of inflammation contributing to the dopaminergic degeneration. This subject will be discussed in more detail in the next sections. An overview of all the molecular mechanisms currently accepted to participate in the pathogenesis of PD is described in Figure 1.
7
Figure.1. Key molecular mechanisms currently accepted to participate in the degeneration of dopaminergic neurons in the substantia nigra in Parkinson disease. Mutations in DJ-1, PINK1 and
Parkin decreases mitochondrial protection against oxidative stress and loss of function of Parkin and PINK1 also reduce the cells ability to remove damaged mitochondria. Impairment in mitochondrial function leads to a deficit in energy supply, increases oxidative stress and may also overload the ubiquitin-proteasomal system (UPS) which can lead to accumulation of misfolded or damaged proteins. Mutations in Parkin and UCH-L1 lead to a dysfunction of the UPS and are responsible for familial forms of PD. Excitotoxicity causes a massive influx of extracellular calcium resulting from the overactivation of the NMDA receptor by glutamate. Once inside the cell, calcium can lead to necrotic cell death, mitochondrial dysfunction, membrane breakdown, apoptosis and oxidative stress. Activated microglia release pro-inflammatory cytokines, NO and ROS that can damaged dopaminergic neurons (adapted from Dexter & Jenner 2013).
1.2. Neuroinflammation
Several lines of evidence from epidemiological, clinical and animal studies have demonstrated the involvement of a neuroinflammatory response in the pathology of PD. A particularly high number of activated microglia have been found in the brains of post-mortem PD patients, predominantly in the SNpc, in the surrounding area of the degenerating dopaminergic neurons. In addition, high levels of pro-inflammatory cytokines such as IL-1β, TNF-α, IL-2, IL-4 and IL-6, have also been found in the post-mortem brains as well as in the serum and cerebrospinal fluid of PD patients. Moreover, several enzymes associated with inflammation such as inducible nitric oxide synthase (iNOS) and cyclooxygenase 2 (COX2) were found in the post-mortem PD brains (Long-Smith et al. 2009). Recently, a microarray study of the lateral tier of the SN, which degenerates earlier and more severely in PD, showed increased expression of genes encoding pro-inflammatory cytokines and decreased expression of glutathione-related genes when compared with the more medial region (Duke et al. 2007). Data from epidemiological studies revealed that the incidence of sporadic PD in chronic users of non-steroidal anti-inflammatory drugs, was lower than that of age matched non-users (Chen et al. 2005). These studies have also suggested a link between brain injuries and PD. Traumatic brain injury, exposures to viruses and infectious agents have all been proposed as risk factors for developing PD (Tansey & Goldberg 2010). Finally, toxin-based mouse models of PD, including MPTP, LPS and 6-OHDA models, display features of neuroinflammation like an increase in reactive microglia and in the expression of pro-inflammatory cytokines and chemokines (Taylor et al. 2013).
8
1.2.1 Microglia
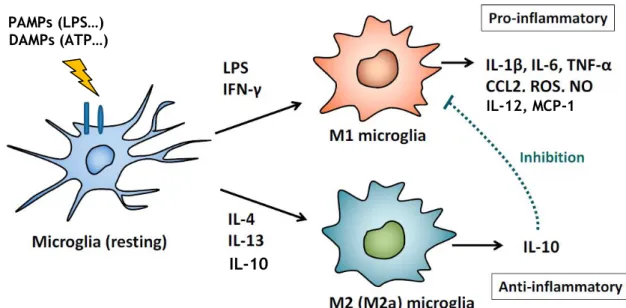
Microglia, the resident immune cells of the CNS, were first described by Pio del Rio Hortega who estimated that they make up approximately 12% of the cells in the brain. Their density varies by brain region, with the highest concentrations being found in the hippocampus, olfactory telencephalon, BG and SN (Block et al. 2007). Microglial cells are classified as macrophages, and they express several macrophage-associated markers, such as CD11b, CD14, CX3C chemokine receptor 1 (CX3CR1) and ionized calcium-binding adaptor molecule-1 (Iba-1). Unlike neurons and astrocytes, microglia are derived from primitive progenitors in the yolk sac that migrate into the CNS during early embryogenesis (Saijo & Glass 2011). In the adult brain, microglia typically exist in a resting state characterized by extensively ramified processes that perform continuous surveillance of their surroundings. However, under stresses such as pathogen invasion, brain injury or toxin protein accumulation, microglia become activated and undergo morphological changes from a resting, ramified shape to an amoeboid shape to facilitate proliferation, migration and phagocytosis (Long-Smith et al. 2009). In their activated state, microglial cells have several beneficial functions essential to neuronal survival, which include innate immunity and cellular maintenance through the release of neurotrophic (Brain-Derived Neurotrophic Factor (BDNF), Insulin-like Growth Factor-1 (IGF-1), Transforming Growth Factor-β (TGFβ) and Nerve Growth Factor (NGF)) and anti-inflammatory factors (IL-10) and by removing toxic cellular debris (Block et al. 2007; Saijo & Glass 2011). Microglia also play a major role in synaptic pruning during brain postnatal development in mice (Paolicelli et al. 2011). Importantly, it has been suggested that microglia can support neurogenesis through their phagocytic functions. The majority of neuroblasts formed in the subgranular zone of the dentate gyrus in the hippocampus undergo death by apoptosis and these apoptotic cells are rapidly cleared out through phagocytosis by resting microglia present in this zone (Sierra et al. 2010). However, under other circumstances, microglia become overactivated and can induce neurotoxic effects by the excess production of pro-inflammatory cytokines and reactive oxygen and nitrogen species (ROS/RNS). This is particularly relevant to PD and others neurodegenerative diseases, where activated microglia have been shown to be present in large numbers (Block et al. 2007). It is now recognized that there are different phenotypes of activated microglia. Macrophages are typically categorized into ‘classically’ activated macrophages (M1 type) or ‘alternatively’ activated macrophages (M2 type) and it is suggested that microglia may also exhibit these phenotypes (Figure 2). Toll-like receptor (TLR) agonists, especially the TLR4 ligand lipopolysaccharide (LPS), and interferon-gamma (IFNγ) induce the M1 phenotype which is relevant to responses to bacterial and viral infection because M1 cells produce several pro-inflammatory cytokines (IL-12, IL-1β, IL-6, TNFα), chemokines (such as CC-chemokine ligand 2 (CCL2) and monocyte chemotactic protein-1 (MCP-1)), antimicrobial peptides (such as cathelicidin-related antimicrobial peptide), and oxidative metabolites (ROS and NO). In contrast, IL-4, IL-10 and IL-13 activate M2 cells, which downregulate pro-inflammatory cytokines, increase expression of anti-inflammatory molecules such as IL-10 and facilitate wound healing and repair through the
9
release of extracellular matrix protecting proteins like YM1, ornithine and polyamines (Mosser & Edwards 2008; Doorn et al. 2012; Cherry et al. 2014). Like macrophages, microglia express many receptors that recognize pathogen-associated molecular patterns (PAMPs) found on bacteria and viruses. These receptors, collectively named pattern-recognition receptors (PRRs), include the TLRs, the nucleotide-binding oligomerization domain-like receptors (NLRs), Scavenger receptors and the macrophage antigen complex 1 (MAC1) also known as complement receptor 3 (CR3) (Block et al. 2007; Saijo & Glass 2011). In addition to PAMPs, microglial cells also recognize endogenous damage-associated molecular patterns (DAMPs) released from injured or dead cells, which include high-mobility group box 1 (HMGB1) proteins, heat shock proteins, modified or misfolded proteins, histones, oxidized lipids, DNA and ATP (Saijo & Glass 2011; Kono & Rock 2008). TLRs can recognize some of these danger signals but microglial cells also express purinergic receptors and the receptor for advanced glycation end-products (RAGE) that are important for the recognition of DAMPs in the CNS. For example, ATP activates P2X receptors and induces the transcription of pro-inflammatory mediators and UDP triggers P2Y6 receptors and induces phagocytosis of the damaged neurons by microglia (Inoue 2008; Koizumi et al. 2007). The nuclear protein HMGB1, released during necrotic cell death, binds to RAGE and activates the transcription of pro-inflammatory genes (Sims et al. 2010).
Figure 2. Classically M1 and alternatively M2 activated microglial cell phenotypes. M1 microglial cells
are polarized by IFN-γ and LPS and then produce pro-inflammatory cytokines and oxidative metabolites. Alternatively, the presence of IL-4, IL-10 and IL-13 leads to the activation of the M2 phenotype which down-regulates M1 functions by releasing the anti-inflammatory cytokine IL-10 (adapted from Nakagawa & Chiba 2014).
IL-10
IL-12, MCP-1 PAMPs (LPS…)
10
1.2.2 The Role of Microglia in Dopaminergic Degeneration
Midbrain dopaminergic neurons seem to be particularly vulnerable to inflammatory insults. They reside in a region reported to have a high density of microglial cells when compared with other brain regions and are more responsive to cytokines such as TNF than other neurons (Kim et al. 2000; Pieper et al. 2008). Besides, microglial cells are a major source of ROS and RNS and dopaminergic neurons are highly susceptible to oxidative damage due to the high content of dopamine in these neurons, the low levels of reduced glutathione and the high levels of iron in the SNpc. Furthermore, aging, the greatest risk factor for PD, leads microglia to a ‘primed’ state. Microglia can respond differently to the same stimulus, for example, if another type of stimulus has preceded its activation and thereby ‘primed’ microglia, their response to the next stimulus will be exacerbated. So aging increases the reactivity and the susceptibility of microglial cells to secondary stimulus, causing exaggerated neuroinflammatory responses (Kanaan et al. 2010; Doorn et al. 2012). Microglia can induce neuronal damaged through two mechanisms. First, microglial cells can become overactivated by direct contact with inflammatory stimuli, such as LPS or endogenous proteins, leading to the release of neurotoxic factors such as pro-inflammatory cytokines and oxidative mediators. In fact, LPS is only neurotoxic in the presence of microglia revealing that microglia can initiate neuronal damage (Gao et al. 2002). Several studies using in vitro and in vivo models demonstrate that LPS activates microglia and causes a progressive and cumulative loss of dopaminergic neurons over time (Gao et al. 2002; Ling et al. 2006). Second, microglia can become overactivated in response to neuronal damaged. The neurotoxin MPTP cannot directly activate microglia, but reactive microglia were present in the SN of monkeys after the administration of this neurotoxin, which indicates that damaged dopaminergic neurons can activate microglia. Furthermore, the addition of microglia to neuronal cultures enhances MPP+ neurotoxicity (McGeer et al. 2003; Gao et al. 2003). So damaged dopaminergic neurons release several factors that activate microglia, which in turn can damage the neighbouring neurons, thus creating a self-perpetuating cycle of neuronal death (Figure 3) (Block et al. 2007). One of these factors is α-synuclein, the main component of Lewy Bodies, that is able to damage dopaminergic neurons in the presence of microglia (Zhang et al. 2005). Matrix metalloproteinase 3 (MMP3), which degrades extracellular matrix, is released during dopaminergic degeneration and it is also able to activate microglia (Kim et al. 2005). ATP, as previously mentioned, is released from damaged neurons and activates microglia by binding to purinergic receptors (Davalos et al. 2005). Finally, the neuronal pigment neuromelanin which is present at high concentrations in the human SN is another factor that activates microglia after being released from dying dopaminergic neurons (Wilms et al. 2003). Emerging evidence suggests that astrocytes may also play a role in this cycle of neuronal death. The pro-inflammatory cytokines IL-1β and TNF-α released by activated microglia can result in potent induction of pro-inflammatory gene expression and in the production of toxic mediators such as NO and ROS by astrocytes. In fact, co-cultures of microglia and astrocytes stimulated with LPS produce significantly more neurotoxic factors than either cell type alone
11
(Saijo et al. 2009). Furthermore, activated astrocytes release cytokines, such as colony-stimulating factor 1 (CSF1) and TNF-α, that further induce the activation and proliferation of microglial cells (Figure 3) (Saijo & Glass 2011).
Figure 3. Microglial activation promotes progressive neurotoxicity. When microglial cells become
activated in response to an inflammatory stimulus, such as LPS, produce several factors including pro-inflammatory cytokines and oxidative mediators that can induce neuronal damaged/death. On the other hand, damaged dopaminergic neurons release a number of molecules that can activate microglia, which is then toxic to neighbouring neurons, creating a perpetuating cycle of neuron death. Pro-inflammatory mediators produced by activated microglia activate astrocytes that can cause neuronal damaged by releasing nitric oxide and reactive oxygen species. Activated astrocytes also release cytokines that further induce the activation of microglia (adapted from Block et al. 2007; Saijo & Glass 2011).
1.3. Modulation of Microglial activity
As mentioned above, microglial activation is capable of both initiating neuronal loss and amplifying ongoing neuronal damaged, so it is crucial to understand the mechanisms that regulate microglial activity. It has been suggested that healthy neurons supress the activation of microglia through cell-cell contact, as well as secreted factors. The CX3C-chemokine ligand 1(CX3CL1) released by neurons binds to CX3CR1 on microglia and prevents microglia activation. Indeed, mice deficient for CX3CR1 have hyperactive microglia and exaggerated neuronal loss in MPTP model of PD (Cardona et al. 2006). CD200, a cell-surface transmembrane glycoprotein, expressed on neurons binds to its receptor CD200R on the microglial surface and helps maintain microglia in their resting phenotype (Hoek et al. 2000). Interaction between the microglia receptors CD172 and CD45 and the neuronal cell-surface
12
proteins CD47 and CD22, respectively, also inhibits microglial cell activity. Several factors, including anti-inflammatory cytokines (TGFβ and IL-10), cannabinoids, oestrogens and glucocorticoids have also been reported to inhibit microglial overactivation (Saijo & Glass 2011). A previous study from our group revealed that glial cell line-derived neurotrophic factor (GDNF) is able to completely inhibit the increase in ROS production and phagocytosis triggered by an inflammatory agent in midbrain microglial cells (Rocha et al. 2012), but the mechanisms by which GDNF exerts its effects on microglia still not completely understood.
1.3.1 Glial cell line-derived neurotrophic factor
Neurotrophic factors (NTFs) are secreted proteins that play critical roles in the development, maintenance, function and plasticity of the vertebrate nervous system. They can support and protect mature neuronal populations and are the most potent mediators of neuronal survival identified to date. The NTFs family is composed by four major classes of molecules: the neurotrophin family, the GDNF family of ligands (GFLs), the neurotrophic cytokines (neurokines) and the new family of cerebral dopamine neurotrophic factor (CDNF) and mesencephalic astrocyte-derived neurotrophic factor (MANF) (Aron & Klein 2011; Sullivan & Toulouse 2011). GDNF, the founding member of GFLs, was originally described as a potent neurotrophic factor for the survival of midbrain dopaminergic neurons (Lin et al. 1993), but has also a potent survival effect in others subtypes of neurons such as spinal motor neurons (Henderson et al. 1994) and central noradrenergic neurons (Arenas et al. 1995). It is also essential for proliferation, migration and differentiation of neuronal cells (Paratcha & Ledda 2008). Outside the nervous system, GDNF regulates kidney development and the differentiation of spermatogonia (Sariola & Saarma 2003). The GFLs also comprise neurturin (NRTN), artemin (ARTN) and persephin (PSPN). This family of NTFs are distant relatives of the TGFβ superfamily because they have a conserved pattern of cysteine residues in the primary sequence and are structurally similar with other members in the superfamily (Wang 2013). Signal transduction by GFLs involves an initial interaction with a class of proteins, known as GDNF-family receptor-α (GFRα) receptors, which are usually bound to the plasma membrane but can also exist in a soluble form (Paratcha et al. 2001). Four different GFRα receptors have been characterized (GFRα1-4). GDNF preferentially binds to GFRα1, NRTN to GFRα2, ARTN to GFRα3 and PSPN to GFRα4 (Wang 2013). According to the original model, a dimeric GDNF binds to GFRα1 receptors which form homodimers upon GDNF binding and then the GDNF-GFRα1 complex recruits the RET receptor tyrosine kinase. This interaction between RET and GDNF-GFRα1 complex promotes RET dimerization and transphosphorylation of specific tyrosine residues in their intracellular tyrosine kinase domain (Figure 4). It is assumed that the other GFL members interact with their specific GFRα receptors and then activate RET in a manner similar to GDNF (Airaksinen & Saarma 2002). Once phosphorylated, the tyrosine residues in the intracellular domain of RET serve as high-affinity binding sites for several intracellular signalling proteins such as FRS2 (fibroblast growth factor receptor substrate 2) and Shc (Src-homologous and collagen-like protein) that initiate several signalling pathways.
13
The activated RET triggers different pathways, including the Ras-MAPK (mitogen-activated protein kinases), the phosphatidylinositol-3 kinase (PI3k)-Akt, the phospholipase Cγ (PLC-γ) and the Src signalling pathways, which regulate diverse processes (Sariola & Saarma 2003). The MAPK pathway is crucial for neuritogenesis but it also contributes to neuronal survival. The PI3K pathway is essential for both neuronal survival and neurite outgrowth and some evidence indicates that the PI3K and PLC-γ pathways are involved in the enhancement of neurotransmission. PLC-γ is also important in the regulation of intracellular level of Ca2+. The Src kinase also contributes to neurite outgrowth and neuronal survival (Airaksinen & Saarma 2002; Sariola & Saarma 2003). It is important to mentioned that the stimulation of RET affects different downstream targets inside and outside lipid rafts. These rafts serve as essential signalling compartments in the cell membrane. When the activation of RET occurs outside the lipid rafts via soluble GFRα1 it preferentially binds to the soluble adaptor Shc that triggers the PI3K/AKT pathway. On the other hand, when RET stimulation occurs inside the lipid rafts, via anchored GFRα1, it interacts with the lipid-anchored adaptor protein FRS2 that triggers the Ras/MAPK pathway and also promotes the activation of Src kinase (Figure 4) (Airaksinen & Saarma 2002). A second signalling mode for GDNF is via the alternative receptor, the neural cell adhesion molecule (NCAM). GDNF can directly bind to NCAM but the presence of GFRα1 is required to establish a high-affinity binding and to activate downstream pathways. The formation of the GDNF-GFRα1-NCAM complex leads to the activation of the focal adhesion kinase (FAK) and Fyn kinase in the cytoplasm (Figure 4) (Paratcha et al. 2003). By binding to NCAM, GDNF stimulates neurite outgrowth of cultured hippocampal and cortical neurons, regulates Schwann cells migration and function and promotes presynaptic maturation and synapse formation of hippocampal and cortical neurons both in vitro and in vivo (Paratcha & Ledda 2008).
Figure 4. Intracellular signalling pathways mediated by GDNF. a) A dimer of GDNF brings together two
molecules of GFRα1 bounded to the cell membrane. The GDNF-GFRα1 complex recruits RET into lipid rafts, promotes its dimerization and transphosphorylation of RET intracellular tyrosine kinase domain. The activated RET protein inside the rafts interacts with the lipid-anchored adaptor protein FRS2 that
14
triggers the Ras/MAPK pathway and promotes the activation of Src kinase. b) An alternative mode for activation of RET is via soluble GFRα1 (sGFRα1), which binds GDNF and activates RET initially outside the lipid rafts. This leads to the recruitment of soluble adaptors molecules such as Shc that triggers the PI3K/Akt pathway. c) NCAM is an alternative signalling receptor for GDNF. Although GDNF can directly bind NCAM, initial interaction with GFRα1 enhances its affinity for NCAM which results in the activation of FAK and Fyn in the cytoplasm (adapted from Aron & Klein 2011).
GDNF may also regulate certain functions of microglia, since both RET and GFRα1 are expressed in rat primary microglial cultures from the cerebral cortex (Honda et al. 1999). Moreover, primary microglia are capable of secreting GDNF, thereby, being a source of reasonable amounts of this NTF (Matsushita et al. 2008). An in vivo study suggests that NTFs secretion (in particular BDNF and GDNF) by activated macrophages and microglia induces the dopaminergic sprouting that accompanies striatal injury (Batchelor et al. 1999). Evidences suggest that GDNF has the capacity to regulate microglial activation. A study on Alzheimer disease revealed that GDNF has the ability to prevent microglia activation induced by β-amyloid in rabbit hippocampus (Ghribi et al. 2004). More recently, a study using organotypic cultures showed that GDNF protected dopaminergic neurons from LPS-induced neurotoxicity, which was paralleled by the suppression of microglia activation and NO production (Xing et al. 2010). Furthermore, it was shown that the anticonvulsant and mood stabilizer valproate and other histone deacetylase inhibitors, which increase the expression of GDNF and BDNF in astrocytes, are able to reduce microglial activation (Peng et al. 2005; Wu et al. 2008). As mentioned above, our group also showed that astrocyte-derived GDNF plays a major role in controlling midbrain microglial activation and its effects are mediated by GFRα-1 (Rocha et al. 2012), however it is still unclear which signalling pathways are activated upon GDNF binding. So the main objective of this study is to elucidate which are the GFRα-1-associated pathways involved in the modulation of midbrain microglial reactivity by GDNF and also to determine if there are any changes in GDNF levels, or in the proteins associated with GDNF signal transduction in an animal model of PD that may interfere with the ability of GDNF to decrease neuroinflammation.
15
Chapter 2: Materials and Methods
2.1. Animals
Animals were handled in accordance with the national ethical requirements for animal research, and with the European Convention for the Protection of Vertebrate Animals Used for Experimental and Other Scientific Purposes (Directive number 2010-63-EU).
2.2. Stereotaxic Surgery
Male Fischer rats with about 3 months of age and a weight between 225 to 250g were housed in appropriate cages under controlled conditions (12h light/12 dark cycle, room temperature 22ºC and free access to food and water). Under anaesthesia, the animals were placed on a stereotactic frame. A single injection of LPS (5μg dissolved in 5μl of PBS) or LPS vehicle (2μl of PBS) was made using the following stereotaxic coordinates, measured from bregma: 5.3 mm posterior, 2.3 mm lateral and 7.7 mm ventral to the surface of the dura mater. LPS or LPS vehicle was injected into the right side of SN over a period of 5 minutes. After 8 days all animals were sacrificed and their brains surgically removed to perform the Western Blot assay.
2.3. Cell Cultures
2.3.1 Postnatal Ventral Midbrain Microglia Cultures
The brain of postnatal day 2 or 3 Wistar rat pups was removed and placed into cold phosphate buffered saline (PBS) solution (1.4 M Nacl, 27 mM KCl, 15 mM KH2PO4 and 81 mM Na2HPO4, pH 7.4). The ventral midbrain was dissected, carefully stripped of the meninges and put in cold PBS. The tissue was then enzymatically dissociated with a papain solution (Cysteine water (1.9 mM CaCl2, 1.3 mM Cysteine), 4 mg/ml papain, H&B (116 mM NaCl, 5.4 mM KCl, 26 mM NaHCO3, 12 mM NaH2PO4.H2O, 1mM MgSo4.7H2O, 0.5 mM EDTA, 25 mM glicose, pH 7.3) and 0.5% Phenol Red) for 4 min at 37ºC. To stop the enzymatic digestion, the tissue was washed tree times with M10C-G culture medium (Minimum Essential Medium Eagle (MEM, Sigma) supplemented with 2.2g/L NaHCO3, 0.75% Glycose 45%, 0.12% antibiotic (penicillin and streptomycin, Sigma), 0.02% insulin (Sigma) and 10% Fetal Bovine Serum (FBS, Biochrom AG) and then it was mechanically dissociated using micropipettes. The resulting cells were passed through a 70 μm mesh, pelleted by centrifugation at 1500 rpm for 3 minutes (3K18C Bioblock Scientific: Sigma Laboratory Centrifuges) and suspended in M10C-G. The number of viable cells was determined by the Trypan Blue exclusion test. Afterwards, the cells were plated
16
into 6 or 12 wells plates coated with poly-D-lysine (Sigma) at a density of 0.264 x10⁶ cells/3.5 cm2. The cultures were kept at 37ºC in a 5% CO
2, 95% air atmosphere. After 8 to 10 days in culture, astrocytes were removed, leaving microglia in the adherent layer, using a trypsin solution (0.5 g/L Trypsin and 0.2 g/L EDTA dissolved in PBS) diluted in MEM (1:3). Finally, microglial cells were kept in M10C-G at 37ºC in a 5% CO2, 95% air atmosphere for 5 days in order to allow microglia to recover its resting state.
2.3.2 N9 Microglia Cell Line
The N9 microglia cell line was plated into 75 cm2 culture flasks (BD Falcon) in RPMI-1640 (Sigma) culture medium supplemented with 2g/L NaHCO3, 5% heat-inactivated FBS (Biochrom AG) and 1% penicillin/streptomycin (Sigma). The culture was kept at 37ºC in a 5% CO2, 95% air atmosphere. After reaching about 70% of confluence, the cells were detached by adding a trypsin solution (0.5 g/L Trypsin and 0.2 g/L EDTA dissolved in PBS) for 3 minutes. Then, fresh medium was added to stop the reaction and cells were pelleted by centrifugation at 150g for 5 minutes (3K18C Bioblock Scientific: Sigma Laboratory Centrifuges). Afterwards, the cells were suspended in RPMI-1640 and the number of viable cells determined by the Trypan Blue exclusion test. Cells were then plated into 24 wells plates at a density of 2x10⁴ cells/wellto perform the experiments and into 75 cm2 culture flasks to propagate cells for future experiments.
2.4. Stimulation of Microglia
On culture day 5 primary microglial cells were treated with the FAK inhibitor PF 573228 (3μM, Sigma) and one hour later, GDNF (100 pg/ml, Santa Cruz Biotechnology) was added to the culture. Twenty-four hours later, LPS (Sigma), at a concentration of 2μg/ml, was added to the culture and allowed to exert its effects for an additional period of twenty-four hours. After that time culture medium was collected to perform the NO assay and cells were used to evaluate the phagocytic activity. For the Western Blot experiments, primary microglial cells were treated with GDNF, at a concentration of 200 pg/ml, and fifteen minutes later LPS (2μg/ml) was added to the medium. The cell extracts were collected one hour after the addition of LPS. In the case of microglia cell lines, GDNF (100 pg/ml, 1 ng/ml, 5ng/ml and 10ng/ml) was added on culture day 2 and twenty-four hours later cells were treated with LPS (0.1μg/ml and 1μg/ml). The NO assay was performed twenty-four hours after stimulation with LPS.
2.5. Nitric Oxide Assay
The production of NO from activated microglia was determined by analysis of nitrite levels. Nitrite is a stable reaction product of NO and can be detected by a colorimetric reaction with sulphanilamide and N-1-naphthylethylenediamine dihydrochloride (NED). To perform this assay, medium conditioned by microglial cells was mixed with the same volume of 1%
17
sulphanilamide, prepared in 5% phosphoric acid, and incubated for ten minutes at room temperature, and after this period the same volume of 0.1% NED in H2O was added and also incubated for further ten minutes, at room temperature. Finally, the absorbance at 550 nm was determined using xMark Microplate Absorbance Spectrophotometer (Bio-Rad Laboratories). Sodium nitrite diluted in culture medium was used to generate a standard curve.
2.6. Phagocytosis Assay
To evaluate microglia phagocytic activity, cell cultures were incubated for 75 minutes with 0.01% fluorescent polystyrene microspheres (Sigma), and then washed two times with PBS to remove non-engulfed microspheres. Afterwards, cells were fixed in 4% paraformaldehyde (PFA) for 15 min. Finally, to stain the nucleus, cells were incubated for 10 minutes with 2μM Hoescht 33342(Invitrogen) prepared in PBS with 0.1% Tween. For quantification of phagocytic cells, 20 different fields per slide were analysed on an inverted fluorescent microscope (Axiobserver Z1, Zeiss) under a 63x magnification.
2.7. Western Blot
Ventral midbrain microglia cultures and brain tissue samples were lysed on ice using a lysis buffer containing 1% Triton X-100, 50 mM Tris-HCl pH 7.5, 10mM EGTA, 150 mM NaCl, 4% protease inhibitors (Protease Inhibitor Cocktail Tablets, Roche) and phosphatase inhibitor (2 mM Na3VO4). Protein concentration was determined using the Bradford method and bovine serum albumin as standard (Bio-Rad Protein Assay, Bio-Rad Laboratories). Both samples were denatured by adding sample buffer (62.5 mM Tris-HCl pH 6.8, 2% Sodium Dodecyl Sulfate (SDS), 10% glycerol, 140 mM β-mercaptoethanol and 0.1% bromophenol blue) and by heating at 100ºC for 5 minutes. Then, cell extracts (15 μg total protein per well) or tissue samples (30μg total protein per well) were loaded in a stacking gel containing 4% acrylamide, 0.5 M Tris-HCl pH 6.8, 10% SDS, 0.05% ammonium persulphate (PSA) and 0.1% tetramethylethylenediamine (TEMED) and proteins were separated in a resolving gel containing 10% acrylamide for cell extracts or 12% acrylamide for tissue samples, 1.5 M Tris-HCl pH 8.8, 10% SDS, 0.05% PSA, 0.05% TEMED. Electrophoresis was run at 160 V for one hour, at room temperature. Afterwards, proteins were transferred to polyvinylidene difluoride membranes (GE Healthcare) using Trans-Blot TurboTM Transfer System (Bio-Rad Laboratories) at 25 V, 1 A, for 30 minutes. The membranes were then blocked with 5% non-fat milk (Paáturages) in TBS-T (0.1% Tween-20 in a 20 mM Tris and 137 mM NaCl solution) for 1h at room temperature. Incubation with anti-pFAK (1:200), anti-FAK (1:200), anti-pRET (1:250), anti-RET (1:250), anti-GDNF (1:1000), anti-NCAM (1:500), anti-GFRα (1:500), anti-Iba1 (1:400) and anti-TH (1:5000) diluted in TBS-T was done overnight at 4ºC. All primary antibodies were obtained from Santa Cruz Biotechnology. After being rinsed three times with TBS-T, the membranes were incubated for 1h at room temperature with rabbit (1:20000) or
anti-18
mouse (1:20000) antibodies (Santa Cruz Biotechnology) diluted in TBS-T, both conjugated to horseradish peroxidase (HRP). Incubation with an antibody against β-Actin (1:20000, Sigma) or against Tubulin (1:5000, Santa Cruz Biotechnology) was performed to obtain loading controls. Lastly, the membranes were incubated with the HRP substrate (LuminataTM Crescendo Western HRP substrate, EMD Millipore) for 5 minutes and then protein bands were detected using ChemiDocTM MP System (Bio-Rad Laboratories). The protein bands were quantified by densitometry analysis using the Image Lab Software (Bio-Rad Laboratories).
2.6. Data Analysis and Statistics
Data are expressed as percentages of values obtained in control conditions or as percentages of the total number of cells, and are presented as mean ± SEM of four animals or three independent experiments, performed in triplicate. Statistical analysis was performed using one-way ANOVA followed by Bonferroni’s Multiple Comparison Test or Student’s t-test. Values of p<0.05 were considered significant. All statistical procedures were performed using GraphPad Prism 5 (GraphPad Software Inc.).
19
Chapter 3: Results
3.1. GDNF does not inhibit LPS-mediated NO
production in N9 microglia cell line
Recent studies have described a neuroprotective effect of GDNF in PD models that are characterised by the presence of an inflammatory response. GDNF was able to suppress LPS-induced microglia activation and NO production in organotypic cultures (Xing et al. 2010) and to inhibit the increase in ROS production and phagocytosis triggered by Zymosan A in midbrain microglia cultures (Rocha et al. 2012). However, most of these studies have been performed in rat-derived cells. A recent study, developed in mouse microglia, reported that GDNF is not able to inhibit LPS-mediated upregulation and release of the pro-inflammatory cytokines IL6 and TNFα (Zlotnik & Spittau 2014), suggesting that GDNF may not be capable of prevent microglia activation in mouse derived cells. In order to elucidate which are the signalling pathways involved in the modulation of microglia reactivity by GDNF, first it must be investigated if GDNF is able to prevent LPS-mediated microglia activation in N9 mouse-derived cell line. Thus, N9 microglia cultures were treated with GDNF (100pg/ml) and twenty-four hours later, LPS at a concentration of 0.1μg/ml or 1μg/ml was added to the culture. To evaluate microglia activation, the NO assay was performed 24 hours after the stimulation with LPS (Figure 5a). As shown in Figure 5a, the increase of NO release induced by LPS exposure (0.1μg/ml and 1μg/ml) was not altered by the presence of GDNF, suggesting that GDNF is incapable of prevent LPS-mediated NO production in N9 microglia cell line. To ensure that the GDNF incapability to prevent LPS-mediated NO production is not due to low levels of this NTF in the culture medium, GDNF at a concentration of 1ng/ml, 5ng/ml and 10ng/ml was added to the culture before the treatment with LPS. However, none of the GDNF concentrations used accomplished to prevent the release of NO induced by LPS-activated microglia (Figure 5b). Together, these data demonstrate that GDNF had no significant effects on LPS-mediated NO production in N9 microglia cell line.
20
Figure 5. Effect of GDNF on LPS-mediated NO production in N9 microglia cell line. NO levels were
determined in microglial cells pre-treated for 24 h with 100 pg/ml of GDNF (a) or with different concentrations of GDNF (b) diluted in RPMI and then stimulated with LPS for 24h. Data shown represent the mean ± SEM of four (a) and two (b) independent experiments performed in triplicate. Statistical analysis was performed using one-way ANOVA followed by Bonferroni’s Multiple Comparison Test (*p<0.05 and ***p<0.05 as compared with control).
a)
21
3.2. Modulation of LPS-induced NO production by
GDNF: is the NCAM pathway involved?
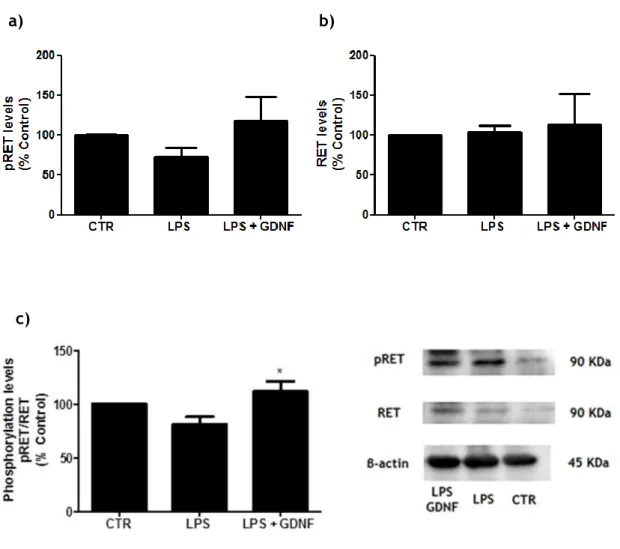
Previous results from our group showed that the control of midbrain microglial cells activation exerted by GDNF depends on GFRα1 (Rocha et al. 2012). However, signalling mediated by GFRα1 can be coupled to the transmembrane RET tyrosine kinase receptor or the cell adhesion molecule NCAM (Aron & Klein 2011). NCAM signalling involves the activation of Fyn kinase and FAK in the cytoplasm of the target cell (Paratcha et al. 2003). Thus, in order to determine if NCAM is involved in the modulation of microglial activity by GDNF, midbrain microglia cultures were treated with a FAK inhibitor PF573228 (3μM) one hour before the incubation with GDNF. After 24 hours, LPS (2μg/ml) was added to the culture and allowed to exert its effects for an extra period of 24 hours. The results showed that LPS promoted an increase in NO levels and GDNF was incapable of prevent this increase (Figure 6). Interestingly, FAK inhibitor together with GDNF was able to significantly decrease NO levels in the presence of LPS. As expected FAK inhibitor alone did not promote an increase in NO levels, which were very similar to control levels. These findings suggested that the NCAM pathway or at least the protein FAK may be involved in LPS-induced NO production.
Figure 6. Effect of FAK inhibition in GDNF modulation of LPS-mediated NO production in midbrain microglia cultures. Microglial cells were incubated with GDNF (100pg/ml) after one hour treatment
with the FAK inhibitor PF 573228 (3μM, FAK Inb), and 24 hours later LPS (2μg/ml) was added to the culture. Data shown represent the mean ± SEM of three independent experiments performed in triplicate. Statistical analysis was performed using one-way ANOVA followed by Bonferroni’s Multiple Comparison Test (***p<0.05 as compared with control and +++p<0.05 as compared with LPS).
22
3.3. Blockade of the NCAM pathway does not
impede inhibition of LPS-mediated phagocytosis
by GDNF
As mentioned above, our group showed that GDNF was able to inhibit the increase in phagocytosis triggered by an inflammatory agent in midbrain microglial cells (Rocha et al. 2012). To determine if this effect mediated by GDNF involves the participation of the NCAM signalling pathway, microglial cells were treated with FAK inhibitor (3μM) for one hour before the incubation with GDNF (100pg/ml). Twenty-four hours later LPS was added to the culture and after 24 hours the cells were incubated with fluorescent microspheres for 75 minutes. Cells that incorporated these microspheres were considered phagocytic cells (Figure 7a). These results showed that LPS treatment increased the number of phagocytic cells but when microglial cells were pre-incubated with GDNF this increase did not occur. Even in the presence of FAK inhibitor, GDNF was able to inhibit the increase in the number of phagocytic cells triggered by LPS (Figure 7b). No significant differences were observed between the cells treated only with FAK inhibitor and the control cells. These findings suggest that the inhibition of phagocytosis promoted by GDNF does not require the NCAM signalling pathway.