Analysis of conservation priorities of
Iberoamerican cattle based on autosomal
microsatellite markers
Ginja et al.
Ginjaet al. Genetics Selection Evolution 2013, 45:35 http://www.gsejournal.org/content/45/1/35
R E S E A R C H
Open Access
Analysis of conservation priorities of
Iberoamerican cattle based on autosomal
microsatellite markers
Catarina Ginja
1*, Luís T Gama
2, Óscar Cortes
3, Juan Vicente Delgado
4, Susana Dunner
3, David García
3,
Vincenzo Landi
4, Inmaculada Martín-Burriel
5, Amparo Martínez-Martínez
4, M Cecília T Penedo
6,
Clementina Rodellar
5, Pilar Zaragoza
5, Javier Cañon
3and BioBovis Consortium
Abstract
Background: Determining the value of livestock breeds is essential to define conservation priorities, manage genetic diversity and allocate funds. Within- and between-breed genetic diversity need to be assessed to preserve the highest intra-specific variability. Information on genetic diversity and risk status is still lacking for many Creole cattle breeds from the Americas, despite their distinct evolutionary trajectories and adaptation to extreme environmental conditions.
Methods: A comprehensive genetic analysis of 67 Iberoamerican cattle breeds was carried out with 19 FAO-recommended microsatellites to assess conservation priorities. Contributions to global diversity were investigated using alternative methods, with different weights given to the within- and between-breed components of genetic diversity. Information on Iberoamerican plus 15 worldwide cattle breeds was used to investigate the contribution of geographical breed groups to global genetic diversity.
Results: Overall, Creole cattle breeds showed a high level of genetic diversity with the highest level found in breeds admixed with zebu cattle, which were clearly differentiated from all other breeds. Within-breed kinships revealed seven highly inbred Creole breeds for which measures are needed to avoid further genetic erosion. However, if contribution to heterozygosity was the only criterion considered, some of these breeds had the lowest priority for conservation decisions. The Weitzman approach prioritized highly differentiated breeds, such as Guabalá, Romosinuano, Cr. Patagonico, Siboney and Caracú, while kinship-based methods prioritized mainly zebu-related breeds. With the combined approaches, breed ranking depended on the weights given to the within- and between-breed components of diversity. Overall, the Creole groups of breeds were generally assigned a higher priority for conservation than the European groups of breeds.
Conclusions: Conservation priorities differed significantly according to the weight given to within- and between-breed genetic diversity. Thus, when establishing conservation programs, it is necessary to also take into account other features. Creole cattle and local isolated breeds retain a high level of genetic diversity. The development of sustainable breeding and crossbreeding programs for Creole breeds, and the added value resulting from their products should be taken into consideration to ensure their long-term survival.
* Correspondence: [email protected]
1
Centro de Biologia Ambiental, Faculdade de Ciências, Universidade de Lisboa, Lisboa, Portugal
Full list of author information is available at the end of the article
© 2013 Ginja et al.; licensee BioMed Central Ltd. This is an Open Access article distributed under the terms of the Creative Commons Attribution License (http://creativecommons.org/licenses/by/2.0), which permits unrestricted use, distribution, and reproduction in any medium, provided the original work is properly cited.
Background
Today, it is estimated that throughout the world, there is one cow for every five people. The most recent report of the Food and Agriculture Organization (FAO) on farm animal genetic resources [1] illustrates the importance of cattle as a domestic species. Overall, cattle breeds repre-sent about 22% of the documented mammalian livestock breeds, but among these, 16% are extinct, 16% are threatened and for 30% information on population sizes and number of breeding animals is lacking. This erosion in cattle diversity occurred mainly during the last cen-tury for different reasons i.e. commercial breeds were preferred to native populations, crossbreeding led to di-lution, and the widespread use of artificial insemination resulted in a sharp decline in sex ratio [2,3].
The risk status of each breed is defined on the basis of both demographic and cultural aspects [4]. For example, the FAO has developed a public database [5] as a warn-ing system for worldwide domestic animal genetic resources (AnGR), in which breeds with less than ~1000 breeding females and/or less than ~20 breeding males are classified as threatened [6]. As a preservation mea-sure, the European Union provides financial support to livestock producers of native breeds that are considered in risk of abandonment [2]. Nonetheless, there is general agreement that assessment and preservation of genetic diversity in livestock species are fundamental to meet future breeding needs, to investigate the genetic basis of phenotypic variation and to reconstruct the history of farm animals [7,8]. Autosomal microsatellites have been the most used genetic markers to estimate diversity parameters, to investigate breed relationships and to
de-fine conservation priorities [8]. Preservation of ‘neutral’
genetic diversity is expected to contribute to maintaining specific breed traits due to natural and artificial selec-tion. Indeed, microsatellites can be present in genes associated with important traits, including adaptation [9,10].
Determining the conservation value of breeds is essen-tial to define priorities, including allocation of funds, and to manage extant genetic diversity. Several methods based on the establishment of conservation priorities have been developed to maintain high levels of neutral genetic variation [11,12]. The Weitzman approach [13] has been widely used in conservation analyses of domes-tic animal populations (for a review see [12]), including cattle [14-18]. This method uses a matrix of genetic dis-tances as a measure of between-breed diversity and thus puts conservation priorities on the breeds that are more differentiated, i.e. that cause the greatest reduction in branch lengths of a phylogenetic tree when they are removed from the metapopulation. Weitzman [13] intro-duced the concept of marginal diversity to account for the change in expected diversity of a metapopulation
(for a given period of time) when the extinction proba-bility of a sub-population increases [12]. Thus, in the Weitzman approach genetic diversity is maximized if gen-etically distant breeds (i.e. more unique) are preserved. However, this method has been strongly criticized because it ignores within-breed diversity [11,17,19-23]. Moreover, breed uniqueness inferred from genetic distances may result from prevalence of rare alleles due to inbreeding, founder effects or strict genetic isolation, instead of a dis-tinct evolutionary history [10,17].
Notwithstanding these limitations, it is important to consider that the genetic diversity of a livestock species results from the genetic variation both within- and between-breeds in order to preserve the highest intra-specific variability [8,12,24]. Within-breed diversity is routinely quantified by Nei’s [25] expected heterozygos-ity, but alternative methods based on allelic diversity can also be used [26,27]. Strategies that maximize heterozy-gosity keep the levels of allelic diversity as high as strat-egies that maximize allelic diversity, while they minimize the levels of inbreeding [11]. Thus, when prioritizing breeds for conservation, deciding whether genetic or al-lelic diversity should be considered depends on whether the focus is on short-term (e.g. avoiding inbreeding in highly threatened breeds) or long-term (e.g. future adap-tation to changing environments) goals, or on an opti-mal combination of both (for a discussion see [27]). In practice, the contribution of each breed to global di-versity could be simply estimated as the percentage of gene and/or allelic diversity lost or gained by its removal (as in an extinction scenario) from the metapopulation considered [28]. However, this would fail to give proper weight to the between-breed component, including the possibility of calculating negative estimates for certain breeds.
Given the limitations of the above methods, alternative approaches have been proposed for breed prioritization, which aim at minimizing global molecular coancestry (i.e. inbreeding) considering both within- and between-breed kinship coefficients [20,23,29,30]. For native European cattle breeds, methods based on molecular kinships have been used to assess their value for conservation decisions [9,16-18,31,32]. Although genealogical inbreeding is a good predictor of molecular inbreeding, the opposite might not be true and depends highly on the number of genetic markers used to estimate heterozygosity [11]. Thus, the ideal situation would be to use a combination of pedigree and molecular approaches, but in many cases reliable genealogical data is unavailable. For management purposes, extensions of these methods have been pro-posed in which acceptable rates of inbreeding and exchange between breeds are defined [27,33].
Assuming that both within- and between-breed contri-butions to genetic diversity should be taken into account
to define conservation priorities, various weights applied to each component have been proposed [20,34-37]. For example, Ollivier and Foulley [37] used the Weitzman estimate of between-breed diversity weighted by the overall degree of population differentiation, i.e. Wright’s
fixation index FST [38], combined with the within-breed
diversity (measured as the proportional loss in global
heterozygosity when a breed is‘lost’) weighted by 1-FST.
It has been argued that higher weights should be given to the between-breed dimension [34] or that the total genetic variance of a hypothetical trait should be consid-ered [36], but no consensus has been reached on a single method. Cañon et al. [39] carried out a comparative ana-lysis to assess conservation priorities in a comprehensive study of Iberian native cattle, using several of the above-mentioned methods. While their study did not make any definite recommendation, it provided a wide perspective on how genetic variation is distributed among peripheral and more variable breeds, which can be helpful for decision-makers to carry out conservation programs.
Several studies have aimed at characterizing the gen-etic diversity of worldwide cattle (for a review see [7]). However, in many cases different marker panels were used and the number of breeds was limited, thus a large-scale comparison of the results, both in terms of genetic diversity and conservation priorities, was diffi-cult. Europe and the Americas, including both North and Latin America, hold about 47% of the worldwide cattle population [1]. In Europe, local breeds are recog-nized as important AnGR and information on their genetic diversity and risk status is generally available. However, for many populations of Creole cattle from Latin America, such information essential for conser-vation purposes is lacking, in spite of their distinct evolutionary trajectories and adaptation to extreme envi-ronmental conditions. Previously, we reported data on the genetic diversity and breed structure of Creole cattle using FAO-recommended microsatellite markers [40], based on a large dataset of Iberoamerican cattle and other European and Indicine breeds. In the present study, we conducted a comprehensive analysis of conservation priorities of Creole cattle, with the aim of assessing their value for con-servation decisions and management of animal genetic resources. Overall, data on more than 80 worldwide bovine breeds was used to investigate the contribution of different geographical breed groups to the global genetic diversity of cattle.
Methods
Sampling
We analyzed 3383 animals belonging to 82 populations of Iberoamerican cattle that included British, Continen-tal European and Indicine breeds from 12 countries. Animals were sampled within the framework of the
BIOBOVIS consortium [41] according to recommended procedures for the collection of biological specimens (blood, semen or hair roots) from cattle. Details on the sampling procedures and breed distributions are repor-ted elsewhere [40,42-44]. International and country regulations regarding experimental research on animals were strictly followed.
Based on previous results [40,43,44], relationships between cattle breeds were used to establish 13 major breed groups [for details see Additional file 1: Table S1]. Conservation analyses based on geographical distribu-tions and distinct breed types (e.g. taurine, indicine and crossbred) were performed. Specifically, Creole cattle of the Americas (907 animals; 27 breeds) were distributed into six major groups: Creole1 (175 animals; 4 breeds), cattle from the southern region of South America that are related to Iberian breeds and partly to African cattle; Creole2 (121; 4), cattle populations from Colombia and Paraguay admixed with British breeds; Creole3 (50; 2), Colombian cattle related to Iberian breeds; Creole4 (61; 2), cattle from Panama, possibly with some in-fluence from African zebu; Creole5 (212; 6), mostly Mexican cattle admixed with Continental European breeds and also with zebu; and Creole6 (288; 9), cattle from central America extensively admixed with zebu. Iberian breeds were separated into four groups: Iberian1 (609; 12), most of the Portuguese breeds; Iberian2 (452; 10), Spanish and Portuguese breeds that are known to have been admixed with commercial European breeds; Iberian3 (100; 2), breeds from the Canary Islands; and Iberian4 (763; 16), most of the Spanish breeds. For comparison purposes, we also analyzed other breeds that are known to have influenced the Creole cattle of the Americas and that were classified into three groups: British (200; 5), includes mainly commercial breeds of British origin; Continental Europe (184; 4), commercial breeds that originate from Continental Europe; and Indicine (Bos indicus, 168; 6), widely spread zebu breeds.
Microsatellite genotyping
We used a microsatellite dataset previously generated by the BIOBOVIS research consortium [40], which is available to the scientific community from a public database [45]. All animals were genotyped with a panel of 19 microsatel-lite loci: BM1818, BM1824, BM2113, CSRM060, CSSM066, ETH003, ETH010, ETH185, ETH225, HAUT027, HEL009, ILSTS006, INRA032, INRA063, MM12E6, SPS115, TGL A053, TGLA122, and TGLA227. These loci are distributed across 17 cattle autosomes and are recommended by the International Society for Animal Genetics (ISAG) / Food and Agriculture Organization of the United Nations (FAO) Advisory Committee for genetic diversity studies. The genotyping and allele standardization procedures have been validated and are described in detail in [40].
Statistical analyses
Estimates of within-breed genetic diversity were
obtained with GENETIX 4.05.2 software [46], namely
observed (Ho) and unbiased expected (He)
heterozy-gosities, mean number of alleles (MNA) per breed and geographical breed group. This software was also used to estimate F statistics according to Weir and Cockerham [38]. Allelic richness (Rt) over all loci per breed was
calcu-lated with FSTAT v. 2.9.3 software [47].
Analysis of conservation priorities depends on how the metapopulation is defined to investigate partial contribu-tions to global genetic diversity. Also, breed prioritiza-tion will vary considerably according to the relative importance of the within- and between-breed com-ponents of genetic diversity in each breed and to the genetic relationships among breeds. Given the extensive collection of cattle specimens available for this study and for the sake of simplicity, we took into consideration two dimensions that were analyzed separately i.e., (1) the 27 Creole cattle populations and (2) the 13 major geo-graphical breed groups defined above. From the pers-pective of practical applications, we chose to consider geographical breed groups with their specificities, rather than the complete worldwide distribution of cattle inclu-ded in a single metapopulation.
For the conservation analyses, we followed the methods described by Cañon et al. [39] and outlined below. For a better understanding of the statistical procedures involved, we categorized the different approaches as follows: methods that aim at minimizing the overall kinship coeffi-cient of the metapopulation (kinship-based methods), a method that reflects only the between-breed diversity component (Weitzman approach) and combined approa-ches that take into consideration both the within- and between-breed components of global genetic diversity.
Kinship-based methods
We applied the Core Set methods of Eding et al. [21] to investigate the population contributions to global diver-sity that account for within- and between-breed kinship coefficients by minimizing the overall kinship coefficient of the metapopulation considered and eliminating the genetic overlap between breeds in the core set [12]. Esti-mation of possible negative contributions by a given population is avoided through an iterative process that gives the lowest value a zero and recalculates the contri-butions after removal of the population.
In the absence of genealogical data, kinships were estimated from molecular data with different methods: (1) marker-estimated kinships (MEK) obtained from individ-ual genotypes, as described by Eding and Meuwissen [29]; (2) a variation of the MEK method based on log-linear re-gressions [30] obtained with the weighted log-linear model (WLM); (3) same as (2) but the log-linear regressions were
obtained with the mixed model (WLMM); and (4) average
molecular coancestries (fm) based on allele frequencies
[20]. MEK were estimated with a macro function in Excel [39], whereas the solutions for WLM and WLMM were obtained with matrices built with the MATLAB® software (The MathWorks, Inc., USA). Average coancestry coeffi-cients within (fii) and between (fij) each Creole breed and
geographical breed group were calculated with the MOLKIN3 software [48]. Analyses of conservation prior-ities based on these similarity matrices (MEK, WLM,
WLMM and fm) were carried-out with a FORTRAN
program developed and kindly shared by Eding and Meuwissen.
We derived pairwise kinship distances from the MEK coefficients following Eding et al. [21] as: d(i, j) = fii+
fjj− 2fij. Kinship genetic distances were used to construct
the neighbor-net phylogenies of the Creole breeds and geographical breed groups with the SPLITS TREE4 4.12.6 software [49]. Genetic relationships were used to classify the Creole breeds and groups of breeds- and then to build
contour plots of kinship coefficients (MEK and fm) with
the MATLAB® software (The MathWorks, Inc., USA). In order to assess within-breed genetic diversity dir-ectly, the partial contributions of each Creole breed and each geographical breed group were also calculated as the proportional variation in expected heterozygosity of the metapopulation after removal of each breed or breed group (PCHe).
Weitzman approach
We calculated the partial contributions (PCWeitz) of each
Creole breed and each geographical breed group to the total genetic diversity using the Weitzman method [13]. Here, Reynolds genetic distances [50] were used as a measure of between-breed diversity, while within-breed diversity was ignored. This approach estimates the reduction in length of the branches in a maximum likeli-hood phylogeny after removal of a population [20].
PCWeitz were calculated with the FORTRAN program
developed by Garcia et al. [22]. An alternative appro-ximation algorithm developed by Garcia et al. [22] was also used to analyze the 13 geographical breed groups. Thresholds ranging from 0.550 to 0.001 were tested to verify the coherence of the results. Pairwise Reynolds genetic distances were calculated with the POPULA-TIONS 1.2.32 software [51] and used to obtain neighbor-net phylogenies of the Creole breeds and geo-graphical breed groups built with the SPLITS TREE4 4.12.6 software [49].
Combined approaches
Ideally, analyses of conservation priorities should take into account both within- and between-population genetic variability in order to make more accurate management
decisions. We used three approaches to calculate con-tributions that combine these two levels of the global diversity of the metapopulation: (1) aggregate diversity
(PCFst) [37], which uses Wright’s FST to weight the
between- and (1-FST) to weigh the within-population
components of diversity i.e., PCFst= PCWEITZ*FST+ PCHe*
(1-FST); (2) the approach of Piyasatian and Kinghorn [34],
which gives a weight five times higher to the
between-population component (PC5:1), such that PC5:1 =
PCWEITZ*0.833 + PCHe*(1–0.833); and (3) the method
proposed by Caballero and Toro [20] and Fabuel et al. [35], which gives equal weights to within-population coancestries and genetic distances. In this case, Nei’s minimum distances [52] were used and calculations were done with MOLKIN3 software [48].
Results
Results are organized according to the two dimensions defined above i.e., the 27 Creole cattle populations and the 13 geographical breed groups [see Additional file 1: Table S1].
Within-breed diversity and breed relationships
Summary statistics that describe the genetic diversity within the Creole cattle breeds and the geographical breed groups are in Tables 1 and 2, respectively. With a few exceptions, Creole breeds had a high level of genetic
diversity (on average, Ho= 0.719±0.053, He= 0.739±0.049,
MNA = 6.95±1.52 and Rt= 4.71±1.1). Among the Creole
cattle, the Creole1 and Creole3 groups of breeds that are related to Iberian or British breeds and also to
Table 1 Within-breed genetic diversity of Creole (Cr) cattle breeds
Group Country Breed name Acron FAO risk status N Ho±SD He±SD MNA±SD Rt±SD
Cr 1 Argentina Cr Argentino CRA Unknown 50 0.673±0.110 0.678±0.101 6.26±1.66 4.00±0.80
Cr 1 Argentina Cr Patagonico PAT Unknown 35 0.629±0.124 0.670±0.108 5.32±1.57 3.84±0.84
Cr 1 Brazil Caracú CAR Not at risk 47 0.733±0.101 0.711±0.095 6.74±1.73 4.32±0.81
Cr 1 Uruguay Cr Uruguayo CRU Endangered maintained 43 0.668±0.107 0.674±0.085 5.63±1.67 3.97±0.78
Cr 2 Colombia Blanco Orejinegro BON Not at risk 25 0.737±0.127 0.697±0.100 5.74±1.76 4.10±0.82
Cr 2 Colombia Hartón del Valle HVA Not at risk 22 0.783±0.130 0.783±0.070 7.74±1.73 5.24±0.92
Cr 2 Colombia Lucerna LUC Not at risk 24 0.673±0.152 0.717±0.108 6.63±2.06 4.69±1.11
Cr 2 Paraguay Pampa Chaqueño PCH Endangered 50 0.750±0.091 0.771±0.074 8.11±1.79 5.05±0.92
Cr 3 Colombia Costeño con Cuernos CCC Endangered maintained 25 0.692±0.168 0.671±0.135 5.26±1.37 3.94±0.95
Cr 3 Colombia Romosinuaño RMS Not at risk 25 0.651±0.140 0.669±0.132 5.11±1.59 3.94±1.00
Cr 4 Panama Guabalá GUA Not reported 25 0.629±0.218 0.660±0.196 5.79±1.96 4.10±1.30
Cr 4 Panama Guaymí GYM Not reported 36 0.735±0.082 0.756±0.075 7.79±1.65 4.93±0.91
Cr 5 Colombia Sanmartinero SMA Not at risk 25 0.692±0.124 0.721±0.079 6.37±1.16 4.39±0.73
Cr 5 Mexico Cr Baja California CBC Not at risk 21 0.742±0.158 0.760±0.082 7.05±1.58 4.98±0.98
Cr 5 Mexico Cr Chihuahua CHU Unknown 19 0.719±0.168 0.777±0.080 6.68±1.49 5.14±0.95
Cr 5 Mexico Cr Nayarit CNY Not at risk 24 0.749±0.121 0.788±0.077 7.74±1.94 5.25±0.89
Cr 5 Mexico Cr Poblano CPO Unknown 43 0.693±0.108 0.774±0.076 8.37±2.01 5.07±1.01
Cr 5 USA Texas Longhorn TLH Not at risk 80 0.707±0.117 0.740±0.111 8.05±2.46 4.78±1.13
Cr 6 Colombia Caqueteño CAQ Critical 25 0.780±0.147 0.787±0.075 7.58±1.57 5.22±0.97
Cr 6 Colombia Chino Santandereano CHS Unknown 25 0.726±0.091 0.776±0.055 7.32±1.73 5.03±0.80
Cr 6 Colombia Cr Casanareño CAS Not at risk 35 0.739±0.414 0.766±0.078 8.00±1.65 n
Cr 6 Colombia Velasquez VEL Unknown 25 0.730±0.122 0.769±0.069 6.79±1.44 4.92±0.87
Cr 6 Cuba Cr Cubano CUB Not at risk 50 0.793±0.123 0.761±0.080 7.58±2.36 4.92±1.17
Cr 6 Cuba Siboney SIB Unknown 50 0.746±0.172 0.762±0.116 8.05±2.30 5.05±1.08
Cr 6 Ecuador Cr Ecuatoriano ECU Not at risk 12 0.732±0.174 0.772±0.100 6.63±2.11 5.23±1.22
Cr 6 Mexico Cr Chiapas CHI Unknown 30 0.741±0.145 0.782±0.091 7.84±1.57 5.23±0.89
Cr 6 Paraguay Pilcomayo PIL Unknown 36 0.764±0.125 0.769±0.096 7.53±1.74 5.07±1.02
Total 15 27 907 0.719±0.053 0.739±0.049 6.95±1.52 4.71±1.1
Summary statistics of the genetic diversity of 27 Creole breeds; geographical breed group, country of origin, breed names and acronyms (acron), FAO risk status, sample sizes (N), observed (Ho) and unbiased expected (He) heterozygosities, mean number of alleles (MNA), and allelic richness corrected for sample size (Rt) are
African cattle, showed intermediate to high levels of
genetic diversity (on average, Ho > 0.671±0.123 and
He > 0.708±0.116), while the Creole breeds admixed
with zebu cattle (Creole5 and Creole6) had high values across all estimates (on average, Ho> 0.712±0.091,
He> 0.777±0.079, MNA > 10.84±2.34 and Rt> 4.92±1.17).
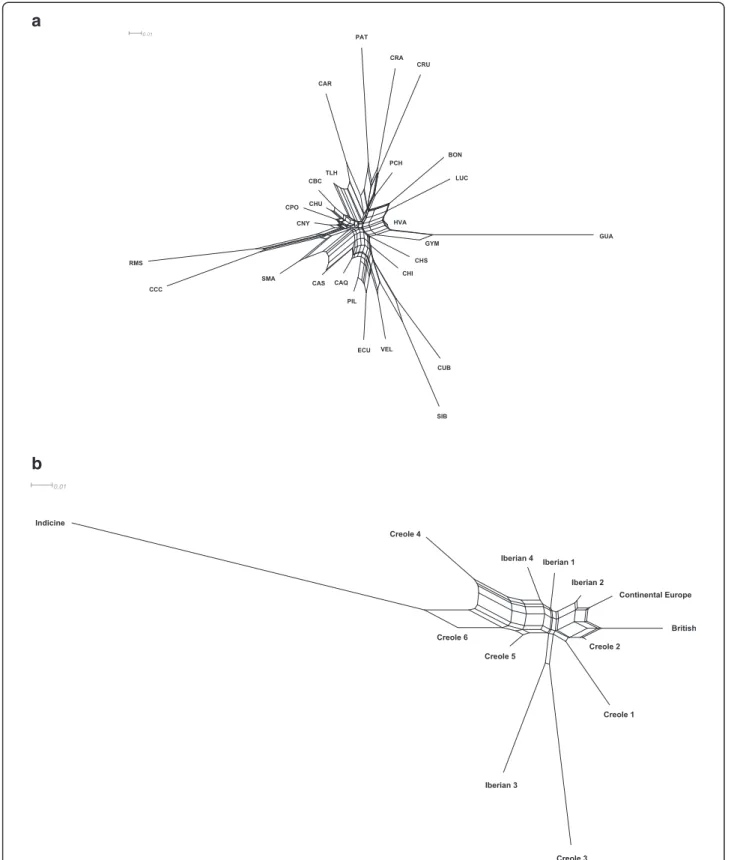
The neighbor-net phylogeny of kinship distances (Figure 1a) shows the relationships among the Creole breeds. Interestingly, this phylogeny was similar to that derived from more traditional genetic distances (e.g. Reynolds distances [44]). Creole cattle from the southern regions of South America (Cr. Patagonico, Cr. Argentino and Cr. Uruguayo) were clustered together with long branch lengths, like the Colombian breeds Romosinuano and Costeño con Cuernos on one side, and Guabalá and Guaymí from Panama on the other. These breeds all share ancestral signatures of Iberian and African cattle [40]. The Caracú breed from Brazil and the Texas Longhorn breed from the United States were also clus-tered together in agreement with their common Iberian ancestry. Clearly, the Creole breeds Siboney, Cr. Cubano, Velasquez, Cr. Ecuatoriano, Cr. Pilcomayo, Caqueteño, Cr. Chiapas, Chino Santandereano, Cr. Casanareño, and Sanmartinero that clustered together share some com-mon ancestry with zebu; they are known to have been crossed with indicine cattle. The majority of the Creole breeds from Mexico clustered together, whereas three breeds from Colombia (Blanco Orejinegro, Lucerna and Hartón del Valle) that have been crossed with commer-cial British cattle formed another cluster.
The neighbor-net graph of geographical breed clusters in Figure 1b that was derived from kinship distances illustrates these distinct admixture patterns found in
Creole cattle. For example, Creole3, which includes the Costeño con Cuernos and Romosinuano breeds (from Colombia), clustered with cattle from the Canary islands of Iberian ancestry, whereas Creole2 was closely associ-ated with commercial breeds of British origin.
The levels of within-breed diversity can also be assessed using kinship coefficients with either the MEK obtained from individual genotypes or average coances-tries (fm) estimated from allele frequencies. Because of the
poor quality of the extracted DNA, possibly due to inap-propriate hair collection (e.g. insufficient hair roots and/or inadequate preservation), no results were obtained for BM2113, ETH003, ETH185 and ETH225 loci in the 35 Cr. Casanareño specimens. Therefore, this breed was ex-cluded from the calculation of allelic richness and from average coancestry analyses because absence of genotyp-ing data for one breed prevents the MOLKIN software from generating complete results for the other breeds (namely between-breed coancestries of Cr. Casanareño and the other Creole populations). In order to visualize both within- and between-breed kinships, contour plots were drawn in which populations were sorted according to their genetic proximity defined in the phylogenetic neighbor-net graph (Figure 2a and [see Additional file 2: Figure S1a]). Red areas represent highly inbred Creole
breeds i.e. Guabalá (MEK = 0.221 and fm= 0.354); Blanco
Orejinegro (MEK = 0.191 and fm= 0.319); Cr. Patagonico
(MEK = 0.215 and fm = 0.339); Cr. Uruguayo (MEK =
0.205 and fm = 0.335); Cr. Argentino (MEK = 0.209 and
fm= 0.330); Romosinuano (MEK = 0.206 and fm= 0.344);
and Costeño con Cuernos (MEK = 0.210 and fm= 0.344),
while yellow areas represent breeds with intermediate kinship values i.e. Caracú (MEK = 0.163 and fm = 0.300),
Table 2 Within-group genetic diversity of the geographical breed groups
Geographical breed groups Nb of breeds N Ho±SD He±SD MNA±SD Rt±SD
Creole1 4 175 0.679±0.078 0.748±0.070 8.84±2.63 7.34±1.87 Creole2 4 121 0.740±0.078 0.777±0.071 9.89±2.26 8.61±1.93 Creole3 2 50 0.671±0.123 0.708±0.116 6.42±1.46 6.34±1.45 Creole4 2 61 0.692±0.120 0.745±0.096 8.37±1.67 7.88±1.52 Creole5 6 212 0.712±0.091 0.777±0.079 10.84±2.34 8.76±1.96 Creole6 9 288 0.756±0.080 0.819±0.064 12.47±3.39 10.03±2.46 Iberian1 12 609 0.674±0.106 0.748±0.110 10.79±3.54 8.09±2.15 Iberian2 10 452 0.697±0.081 0.756±0.081 11.16±2.75 8.32±1.96 Iberian3 2 100 0.681±0.124 0.732±0.093 8.42±2.29 7.40±1.82 Iberian4 16 763 0.670±0.086 0.769±0.086 11.63±3.29 8.70±2.11 British 5 200 0.653±0.079 0.754±0.067 8.89±2.21 7.21±1.76 Continental Europe 4 184 0.720±0.078 0.760±0.085 9.89±3.45 8.23±2.52 Indicine 6 168 0.654±0.111 0.735±0.112 11.32±3.16 9.14±2.49 Total 82 3383 0.692±0.032 0.756±0.027 9.92±1.67 8.28±2.22
Summary statistics of the genetic diversity of 13 geographical breed groups; group names, number of breeds (Nb of breeds), sample sizes (N), observed (Ho) and
a
b
Figure 1 Neighbor-net graph of kinship genetic distances. The genetic relationships among 27 Creole cattle breeds (a) and 13 geographical breed groups (b) are shown; breed acronyms are defined as follows: CRA, Cr.Argentino; PAT, Cr. Patagonico; CAR, Caracú; CRU, Cr. Uruguayo; BON, Blanco Orejinegro; HVA, Hartón del Valle; LUC, Lucerna; PCH, Pampa Chaqueño; CCC, Costeño con Cuernos; RMS, Romosinuano; GUA, Guabalá; GUY, Guaymí; SMA, Sanmartinero; CBC, Cr. Baja California; CHU, Cr. Chihuahua; CNY, Cr. Nayarit; CPO, Cr. Poblano; TLH, Texas Longhorn; CAQ, Caqueteño; CHS, Chino Santandereano; CAS, Cr. Casanareño; VEL, Velasquez; CUB, Cr. Cubano; SIB, Siboney; ECU, Cr. Ecuatoriano; CHI, Cr. Chiapas; PIL, Cr. Pilcomayo.
Lucerna (MEK = 0.162 and fm = 0.302) and Sanmartinero (MEK = 0.152 and fm = 0.300).
These contour plots also reveal breed relationships with related breeds clustered in different yellow and green areas, i.e. Guabalá and Guaymí; Blanco Orejinegro, Lucerna and Texas Longhorn; Blanco Orejinegro, Cr. Patagonico, Cr. Uruguayo and Cr. Argentino; Blanco
Orejinegro and Sanmartinero; and Romosinuano, Costeño con Cuernos and Sanmartinero. Finally, zebu-influenced breeds in dark blue areas (Caqueteño, Velasquez, Cr. Cubano, Siboney, Cr. Ecuatoriano and Cr. Pilcomayo) are clearly separated from all others.
The geographical breed clusters with the highest within-group kinship values (red areas in Figure 2b and [see
Figure 2 Contour plots of marker-estimated kinships (MEK). Creole cattle breeds (a) and geographical breed groups (b) were classified according to their respective kinship phylogenies; breed acronyms are defined as follows: CRA, Cr.Argentino; PAT, Cr. Patagonico; CAR, Caracú; CRU, Cr. Uruguayo; BON, Blanco Orejinegro; HVA, Hartón del Valle; LUC, Lucerna; PCH, Pampa Chaqueño; CCC, Costeño con Cuernos; RMS, Romosinuano; GUA, Guabalá; GUY, Guaymí; SMA, Sanmartinero; CBC, Cr. Baja California; CHU, Cr. Chihuahua; CNY, Cr. Nayarit; CPO, Cr. Poblano; TLH, Texas Longhorn; CAQ, Caqueteño; CHS, Chino Santandereano; CAS, Cr. Casanareño; VEL, Velasquez; CUB, Cr. Cubano; SIB, Siboney; ECU, Cr. Ecuatoriano; CHI, Cr. Chiapas; PIL, Cr. Pilcomayo.
Additional file 2: Figure S1b]) were Creole3 (MEK = 0.200
and fm= 0.297), which includes the threatened Colombian
breeds Costeño con Cuernos and Romosinuano, and
Iber-ian3 (MEK = 0.172 and fm = 0.271), which includes two
isolated breeds from the Canary Islands. Interestingly, the group of Indicine breeds, mainly composed of widely spread commercial zebu cattle, also had high kinship
coef-ficients (MEK = 0.167 and fm= 0.272), which suggests the
existence of a substructure within this group.
Fairly high kinship coefficients were observed between Iberian1 (mostly Portuguese breeds) and Iberian2 (mostly Spanish breeds), between the Continental European group and Iberian2, and between Iberian3 (Canary Islands) and Creole3 (Colombia), as shown by the yellow areas in Figure 2b. Overall, the separation was greatest between the group of Zebu-influenced breeds in dark blue areas
and the remaining groups followed by the separation between Creole6 and Creole4 with a higher degree of zebu admixture in light blue areas.
Analyses of conservation priorities of Creole cattle
The results of the analyses of conservation priorities of Creole breeds are in Tables 3 and 4. The kinship-based
methods, namely MEKs, fm and WLM, resulted in a
considerable number of Creole breeds with a null con-tribution to the overall genetic diversity (15, 14 and 17 breeds, respectively, out of 27). Consequently, only highly prioritized breeds can be easily identified i.e. Siboney, Cr. Cubano, Pampa Chaqueño and Cr. Poblano (0.109 < MEKs < 0.215, 0.100 < fm < 0.251 and 0.052 <
WLM <0.214) and the results were similar with the three methods applied. These may reflect the high
Table 3 Analyses of conservation priorities of Creole cattle breeds
Group Breed MEKs fm WLM WLMM PCHe PCWeitz
1 PCFst PC5:1 Creole1 CRA 0 0 0 0.012 −0.320 4.97 0.141 4.087 Creole1 PAT 0 0 0 0.011 −0.359 5.95 0.190 4.896 Creole1 CAR 0.046 0.067 0 0.042 −0.145 5.39 0.337 4.466 Creole1 CRU 0 0 0 0.014 −0.338 5.28 0.151 4.342 Creole2 BON 0 0 0 0 −0.222 3.67 0.116 3.020 Creole2 HVA 0 0 0 0.028 0.226 1.19 0.310 1.029 Creole2 LUC 0 0 0 0.026 −0.117 3.40 0.189 2.813 Creole2 PCH 0.109 0.105 0.116 0.048 0.165 2.35 0.355 1.985 Creole3 CCC 0 0 0 0.019 −0.357 5.38 0.143 4.422 Creole3 RMS 0.033 0.054 0.009 0.034 −0.366 6.18 0.203 5.087 Creole4 GUA 0.011 0.039 0.003 0.034 −0.411 9.88 0.484 8.161 Creole4 GYM 0 0 0 0.025 0.085 2.67 0.310 2.238 Creole5 SMA 0 0 0 0.011 −0.093 3.38 0.209 2.800 Creole5 CBC 0 0 0 0.028 0.110 1.98 0.272 1.668 Creole5 CHU 0 0 0.005 0.037 0.196 1.09 0.273 0.941 Creole5 CNY 0.063 0.066 0 0.045 0.252 1.78 0.385 1.525 Creole5 CPO 0.167 0.100 0.052 0.038 0.180 1.52 0.297 1.296 Creole5 TLH 0 0 0 0.015 0.002 1.70 0.150 1.416 Creole6 CAQ 0.046 0 0 0.034 0.249 1.29 0.340 1.116 Creole6 CAS 0 n. 0.431 0.107 0.138 1.88 0.290 1.589 Creole6 CHS 0.028 0.016 0 0.035 0.192 2.32 0.378 1.965 Creole6 VEL 0.063 0.069 0.016 0.056 0.157 3.08 0.411 2.592 Creole6 CUB 0.124 0.114 0.123 0.076 0.113 3.96 0.448 3.318 Creole6 SIB 0.215 0.251 0.214 0.092 0.120 5.40 0.579 4.518 Creole6 ECU 0.096 0.084 0.032 0.056 0.168 2.51 0.372 2.119 Creole6 CHI 0 0.033 0 0.042 0.222 1.91 0.369 1.628 Creole6 PIL 0 0 0 0.037 0.152 1.69 0.286 1.433
Contributions of 27 breeds to overall genetic diversity of Creole cattle according to: marker-estimated kinships (MEK), average coancestries (fm), weighted
log-linear model (WLM), weighted log-log-linear mixed model (WLMM), Weitzman formula (PCWeitz), proportional variation of expected heterozygosity (PCHe), aggregate
diversity (PCFst), and the Piyasatian and Kinghorn formula (PC5:1); values for the five breeds with the highest contributions are shown in bold; geographical breed
within-breed genetic diversity of these breeds, possibly due to past crossbreeding. The WLMM method, which allows only one null contribution (in this case the Creole Blanco Orejinegro), separated breeds more effectively and prioritized for conservation the Casanareño, Siboney, Cr. Cubano, Velasquez and Cr. Ecuatoriano breeds (0.56 < WLMM < 0.107). Nevertheless, the contrasting results for
the Casanareño breed (MEK = 0, no data for fmand high
WLM and WLMM) must be interpreted with caution, because of the lack of results for four loci in this breed, as explained above. The breeds Pampa Chaqueño, Cr. Nayarit, Caracú, and Cr. Chiapas had intermediate conser-vation values (0.042 < WLMM < 0.048).
The proportional contribution of each breed to the aver-age heterozygosity of the metapopulation, resulted in many negative values (10 breeds), which, if these breeds
were removed, would lead to a ‘gain’ in diversity. In
accordance with their inbred status (high within-breed kinship coefficients), the breeds Guabalá, Romosinuano, Cr. Patagonico and Costeño con Cuernos had the most
negative PCHe values (between −0.411 and −0.357). This
method ranked breeds with greater He values at a higher
level, such as Cr. Nayarit, Caqueteño, Hartón del Valle,
Cr. Chiapas and Cr. Chihuahua (0.196 < PCHe < 0.252).
The breeds Chino Santandereano, Cr. Poblano, Cr. Ecuatoriano, Pampa Chaqueño, Velasquez and Cr. Pilcomayo had intermediate contributions (0.152 < PCHe<
0.192). Although Cr. Casanareño was excluded from the coancestry analysis, it resulted in a null MEK contribution and was highly prioritized by the WLM and WLMM as a consequence of having a significant effect (~14%) in the overall heterozygosity of Creole cattle.
Table 4 Contributions of Creole cattle breeds to diversity according to Caballero and Toro [20] and Fabuel et al. [35]
Group Breed fii DNei
1
Contribution tof 1Contribution to D GDT|i 1loss/gain (%) 1PCweighted 2 PCunweighted Creole1 CRA 0.329 0.094 0.014 0.044 0.806 0.2 5.430 3.643 Creole1 PAT 0.339 0.106 0.009 0.031 0.805 0.1 3.813 3.655 Creole1 CAR 0.300 0.097 0.011 0.043 0.803 −0.1 5.321 3.798 Creole1 CRU 0.335 0.097 0.012 0.038 0.805 0.1 4.656 3.632 Creole2 BON 0.319 0.084 0.007 0.022 0.805 0.1 2.716 3.644 Creole2 HVA 0.234 0.058 0.004 0.021 0.804 0.0 2.578 3.931 Creole2 LUC 0.302 0.081 0.006 0.021 0.804 0.0 2.656 3.713 Creole2 PCH 0.237 0.065 0.010 0.048 0.803 −0.1 5.884 3.948 Creole3 CCC 0.344 0.111 0.007 0.022 0.804 0.0 2.727 3.659 Creole3 RMS 0.344 0.118 0.006 0.022 0.804 0.0 2.750 3.690 Creole4 GUA 0.354 0.127 0.007 0.022 0.803 −0.1 2.745 3.683 Creole4 GYM 0.255 0.066 0.008 0.034 0.804 0.0 4.151 3.868 Creole5 SMA 0.298 0.080 0.006 0.022 0.804 0.0 2.778 3.728 Creole5 CBC 0.266 0.071 0.005 0.019 0.804 0.0 2.401 3.835 Creole5 CHU 0.246 0.067 0.004 0.018 0.804 0.0 2.216 3.913 Creole5 CNY 0.229 0.066 0.004 0.023 0.803 −0.1 2.852 3.987 Creole5 CPO 0.236 0.063 0.008 0.041 0.803 −0.1 5.057 3.945 Creole5 TLH 0.266 0.064 0.019 0.073 0.806 0.2 9.060 3.799 Creole6 CAQ 0.233 0.064 0.005 0.024 0.803 −0.1 2.952 3.961 Creole6 CHS 0.236 0.068 0.005 0.024 0.803 −0.1 2.956 3.967 Creole6 VEL 0.249 0.085 0.005 0.024 0.803 −0.1 2.966 3.981 Creole6 CUB 0.251 0.095 0.009 0.048 0.801 −0.4 5.999 4.025 Creole6 SIB 0.246 0.108 0.008 0.049 0.799 −0.6 6.123 4.108 Creole6 ECU 0.262 0.092 0.002 0.011 0.803 −0.1 1.414 3.954 Creole6 CHI 0.226 0.066 0.006 0.029 0.803 −0.1 3.578 4.001 Creole6 PIL 0.242 0.068 0.007 0.034 0.804 0.0 4.222 3.935
Average coancestries (fii) and Nei’s genetic distances (DNei), contributions to global coancestry (f) and to average Nei’s distance (D), global coancestry (GDT|i) and
proportional loss or gain in genetic diversity after removing each breed, proportional contributions (PC) to a pool of maximum genetic diversity weighted and unweighted by sample sizes; values for the five breeds with the highest contributions are shown in bold, except for GDT|i and loss/gain for which only the two highest values are in bold.; geographical breed groups and breed acronyms are defined in Table1;1
average coancestries weighted by sample sizes;2
average coancestries estimated by ignoring sample sizes; mean coancestry within-breeds,f = 0.275; mean Nei’s minimum distance in the metapopulation, D = 0.083; mean coancestry in the metapopulation,f = 0.197; global genetic diversity of the metapopulation, GDT = 0.804.
The Weitzman approach prioritizes highly differen-tiated breeds (i.e. those with large genetic distances from all others) based only on their contribution to between-breed genetic diversity. In this case, between-breeds with the
highest contributions (5.39 < PCWeitz < 9.88) were
Guabalá, Romosinuano, Cr. Patagonico, Siboney and
Caracú followed by Costeño con Cuernos, Cr.
Uruguayo and Cr. Argentino (5.38 < PCWeitz < 4.97).
Mexican breeds had the lowest contributions amongst all breeds (< 2%).
The combined approach of Ollivier and Foulley [37]
(PCFst), which takes into account both within- and
between-breed components of the genetic diversity, seems to provide more balanced solutions. In this case, the
between-breed component (i.e. PCWeitz) was weighted by
the overall FST value of 0.087 obtained for the
metapopulation of Creole breeds. The PCFstapproach
pri-oritized Creole breeds that also ranked high with the kinship-based methods (i.e. with high within-breed diver-sity), namely Siboney, Cr. Cubano, Velasquez and Cr. Nayarit (0.385 < PCFst< 0.579). Nevertheless, some of the
breeds prioritized by PCWeitz (i.e. with greater genetic
distances) also had high PCFst estimates, particularly
Guabalá, Caracú and the above mentioned Siboney (0.337 < PCFst< 0.579). Creole breeds Chino Santandereano, Cr.
Ecuatoriano, Cr. Chiapas, Caqueteño, Pampa Chaqueño, Hartón del Valle and Guaymí had intermediate conserva-tion values (0.310 < PCFst< 0.378). The PC5:1method gave
the same results in terms of breed ranking for conserva-tion priorities as the Weitzman approach.
The results of the combined approach of Caballero and Toro [20] and Fabuel et al. [35] are in Table 4. The
Texas Longhorn breed had the greatest contribution to global coancestry (f, 0.019) because its within-breed
coancestry was quite high (fii = 0.266) and its distance
from all the other populations was among the lowest
ob-served (DNei= 0.064). The breeds Cr. Argentino, Caracú
and Cr. Uruguayo also had high contributions to f (0.014, 0.012 and 0.011, respectively) as a consequence
of their high fii values (between 0.300 and 0.329).
Although the Cr. Patagonico, Guabalá, Costeño con
Cuernos and Romosinuano breeds had high fii values
(between 0.339 and 0.354), their mean genetic distances were also rather large (between 0.106 and 0.127) and thus their contributions to f, obtained from the
differ-ence between fii and DNei, were less significant (0.009,
0.007, 0.007 and 0.006, respectively). The Texas
Longhorn breed had the highest contribution to D
(0.073) and to proportional contribution estimates
(PCweighted, 9.060), but these estimates can be biased as a
consequence of the rather large sample size of this popula-tion (N = 80), which is taken into account in all calcula-tions. This could also be valid for the PC estimates of the breeds Siboney (6.123), Cr. Cubano (5.999), Pampa Chaqueño (5.884) e Cr. Argentino (5.430), which also had large samples sizes. Indeed, when the proportional con-tributions to genetic diversity are estimated by ignoring
sample sizes (PCunweighted), only the Siboney and Cr.
Cubano breeds maintain their high ranking (4.108 and 4.025, respectively), followed by Cr. Chiapas (4.001), Cr. Nayarit (3.987) and Velasquez (3.981). The Caracú, Cr. Poblano, Cr. Uruguayo, Cr. Pilcomayo, Guaymí and Cr. Patagonico breeds had quite high proportional contri-butions to genetic diversity (3.813 < PCweighted <5.321),
Table 5 Analyses of conservation priorities of geographical breed groups
Group MEKs fm WLM WLMM PCHe PCWeitz
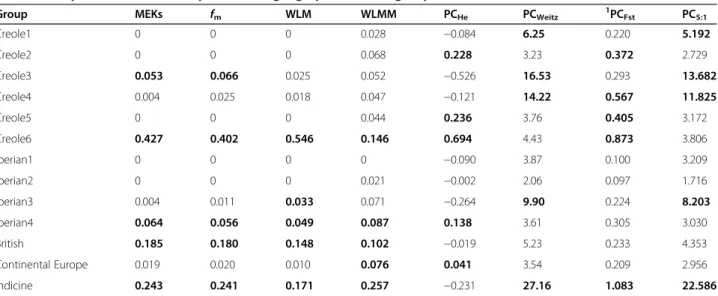
1 PCFst PC5:1 Creole1 0 0 0 0.028 −0.084 6.25 0.220 5.192 Creole2 0 0 0 0.068 0.228 3.23 0.372 2.729 Creole3 0.053 0.066 0.025 0.052 −0.526 16.53 0.293 13.682 Creole4 0.004 0.025 0.018 0.047 −0.121 14.22 0.567 11.825 Creole5 0 0 0 0.044 0.236 3.76 0.405 3.172 Creole6 0.427 0.402 0.546 0.146 0.694 4.43 0.873 3.806 Iberian1 0 0 0 0 −0.090 3.87 0.100 3.209 Iberian2 0 0 0 0.021 −0.002 2.06 0.097 1.716 Iberian3 0.004 0.011 0.033 0.071 −0.264 9.90 0.224 8.203 Iberian4 0.064 0.056 0.049 0.087 0.138 3.61 0.305 3.030 British 0.185 0.180 0.148 0.102 −0.019 5.23 0.233 4.353 Continental Europe 0.019 0.020 0.010 0.076 0.041 3.54 0.209 2.956 Indicine 0.243 0.241 0.171 0.257 −0.231 27.16 1.083 22.586
Contributions of 13 geographical breed groups to the overall genetic diversity of worldwide cattle according to: marker estimated kinships (MEK), average coancestries (fm), weighted log-linear model (WLM), weighted log-linear mixed model (WLMM), Weitzman formula (PCWeitz), proportional variation of the expected
heterozygosity (PCHe), aggregate diversity (PCFst), and the Piyasatian and Kinghorn formula (PC5:1); values for the five breed groups with the highest contributions
whereas Cr. Ecuatoriano had the lowest contribution (PCweighted= 1.414), perhaps because of its low
representa-tion (N = 12). The proporrepresenta-tional contriburepresenta-tion of each breed to a pool of maximum genetic diversity showed very little variation among Creole breeds, but removal of the Siboney and Cr. Cubano breeds from the metapopulation of Creole cattle caused the greatest loss in total genetic di-versity (−0.6% and −0.4%, respectively).
Analyses of conservation priorities of breed groups
The results of the analyses of conservation priorities of geographical breed-groups are in Tables 5 and 6. With
the kinship-based methods (MEKs, fm, WLM and
WLMM), the breed groups Creole6 (zebu-influenced), Indicine, British and Iberian4 (most Spanish breeds) were highly prioritized (0.064 < MEKs < 0.427, 0.056 < fm < 0.402, 0.049 < WLM <0.546, 0.087 < WLMM
< 0.257) because of the rather high within-group genetic diversity which reflects their heterogeneous genetic
make-up. Based on the MEKs and fm estimates, Creole3
(Costeño con Cuernos and Romosinuano breeds from Colombia) had an intermediate conservation value (0.053 and 0.066, respectively). Similarly, with WLM and WLMM, the Iberian3 (breeds from the Canary Islands) and Continental European (WLM = 0.033 and WLMM = 0.076, respectively) breed groups had an intermediate
pos-ition. As expected, PCHe estimates resulted in negative
contributions for eight of the 13 geographical breed groups and prioritized Creole6, Creole2, Creole5, Iberian4
and Continental European cattle (0.041 < PCHe < 0.694)
for conservation.
Indicine cattle had a particularly high Weitzman
estimate (PCWeitz = 27.16) which reflected their
wide phylogenetic differentiation. This approach also prioritized Creole3 (16.53) and Creole4 (14.22), whereas Iberian3 and Creole1 had more intermediate values (9.90 and 6.25, respectively). The strong differentiation of these geographical breed groups is confirmed by their large genetic distances, as shown [see Additional file 3: Figure S2].
Given the inherent limitations of the Weitzman pro-cedure, especially when the number of breeds is large, the alternative approximation algorithm of Garcia et al. [22] was also tested with the 13 geographical breed groups [see Additional file 4: Figure S3] to investigate the partial contributions of each breed to genetic diver-sity. Our results indicate that the approximate estimates of Weitzman and exact methods are in full agreement only for thresholds between 0.300 and 0.200. Further-more, these results suggest that it would not be practical to carry this type of analysis of conservation priorities of worldwide cattle at the breed level (too many breeds, too computationally demanding), even if the approxi-mate method is used. These results provide additional support to our approach that considers geographical breed groups instead of individual breeds.
The strategy based on the analysis of breed groups
produced an overall FSTvalue of 0.048, which was used
in the formula of Ollivier and Foulley [37] (PCFst =
PCWEITZ*0.048 + PCHe*0.952) to calculate conservation
values. With this method, well-differentiated breed groups such as Indicine and Creole6 were prioritized
Table 6 Contributions of geographical breed groups to diversity according to Caballero and Toro [20] and Fabuel et al. [35]
Group fii DNei
1
Contrib tof 1Contrib to D GDT|i 1loss/gain (%) 1PCweighted 2 PCunweighted Creole1 0.254 0.051 0.010 0.041 0.795 0.0 5.109 7.597 Creole2 0.228 0.038 0.007 0.029 0.795 0.0 3.587 7.715 Creole3 0.297 0.075 0.003 0.012 0.795 0.0 1.425 7.418 Creole4 0.262 0.061 0.004 0.014 0.795 0.0 1.786 7.619 Creole5 0.228 0.039 0.012 0.051 0.795 0.0 6.300 7.733 Creole6 0.183 0.041 0.012 0.073 0.790 −0.6 9.046 8.174 Iberian1 0.253 0.041 0.038 0.142 0.801 0.8 17.569 7.507 Iberian2 0.246 0.039 0.028 0.106 0.798 0.4 13.117 7.552 Iberian3 0.271 0.061 0.006 0.023 0.795 0.0 2.895 7.533 Iberian4 0.233 0.043 0.043 0.183 0.796 0.1 22.623 7.716 British 0.247 0.051 0.012 0.048 0.794 −0.1 5.892 7.667 Continental Europe 0.243 0.044 0.011 0.044 0.795 0.0 5.392 7.626 Indicine 0.272 0.127 0.007 0.042 0.787 −1.0 5.258 8.144
Average coancestries (fii) and Nei’s genetic distances (DNei), contributions to global coancestry (f) and to average Nei’s distance (D), global coancestry (GDT|i) and
proportional loss or gain in genetic diversity after removing each breed group, proportional contributions (PC) to a pool of maximum genetic diversity weighted and unweighted by sample sizes are shown; values for the five breed groups with the highest contributions are shown in bold, except for GDT|i and loss/gain for which only the two highest values; breeds in each group are defined in Table1;1
average coancestries weighted by sample sizes;2
average coancestries estimated by ignoring sample sizes; mean coancestry within-groups,f = 0.241; mean Nei’s minimum distance in the metapopulation, D = 0.055; mean coancestry in the metapopulation,f = 0.205; global genetic diversity of the metapopulation, GDT = 0.795.
(1.083 and 0.873, respectively), but Creole4, Creole5 and
Creole2 also ranked high (0.372 < PCFst < 0.567).
According to this method, Iberian2 (a group of Iberian breeds with a recognized admixed background) had the lowest conservation value (0.097). Both Piyasatian and Kinghorn [34] and Weitzman approaches gave the same results in terms of ranking of conservation priorities, as shown in the analysis of individual Creole breeds.
The results of the combined approach of Caballero and Toro [20] and Fabuel et al. [35] for the geographical breed groups are in Table 6. Contributions to global coancestry were high for Iberian4, Iberian1 and Iberian2 (between 0.028 and 0.038), whereas they were moderate for the British, Creole5, Creole6 and Continental European groups (about 0.012). Their contributions to D were also high (between 0.051 and 0.183) due to their lower average Nei’s minimum distances. Accordingly, the above-mentioned Iberian breed groups were highly prioritized when samples sizes were considered (13.117 < PCweighted < 22.623). Indicine and Creole6 had the most
negative impact on overall genetic diversity when they were removed from the metapopulation (GDT|I = 0.787,
loss/gain = −1.0% and GDT|I = 0.790, loss/gain = −0.6%,
respectively). When the proportional contributions to genetic diversity were estimated ignoring sample sizes (PCunweighted), Indicine, Creole6, Creole5, Iberian4,
Creole2 and British breed groups ranked highest (7.715 < PCunweighted< 8.174).
Discussion
The need for conservation of genetic resources for food and agriculture is widely recognized [1], but the exist-ence of organized programs for the conservation of domestic animal breeds differs considerably between countries. With a few exceptions, e.g. [53-56], systematic conservation actions have been taken for Creole cattle breeds (but not all) only in the last few years [1]. While
several Creole breeds are considered ‘not at risk’
according to the FAO risk categories (Table 1), no infor-mation on the number of breeding animals and on their population trend is available for most of these breeds. Creole populations are descendants of Iberian cattle brought to the Americas nearly five centuries ago [57]; the process of separation and divergence of these popu-lations with many generations of genetic drift has prob-ably determined their retention of genetic diversity and adaptation to a very wide range of environmental condi-tions [40]. However, many of these Creole breeds have been abandoned or extensively crossed with commercial European and zebu breeds and conservation programs are necessary to avoid further losses of genetic diversity.
In many cases, a conservation program will concern many breeds while financial resources are limited, thus the need to set priorities. Factors that need to be
considered when defining such priorities include the im-portance of a breed in terms of genetic uniqueness but also its own genetic diversity, and other aspects such as adaptation to specific environments, possession of unique traits, cultural and historical value, contribution to environmental sustainability, etc. [58]. Once priorities have been established, different conservation strategies can be applied, namely in situ or ex situ in vivo preser-vation, and cryoconserpreser-vation, which differ in their ability to address the different aspects considered in the ration-ale for conservation [59].
Although other factors that can potentially impact conservation decisions are important, knowledge of the population structure of a livestock species in terms of distribution of genetic variability within- and between-breeds is a key factor to establish conservation priorities and strategies [20], that aim at maintaining genetic diversity for future generations [60]. Previous studies [40,43,44,61] have confirmed that Creole breeds retain high levels of genetic diversity, and that they differ con-siderably from each other and from their Iberian ances-tors. Some of this diversity may result from admixture with exotic germplasm in a number of Creole breeds, such as those from Cuba and Ecuador, which have been influenced by admixture from zebu cattle over the last century [40].
Our results indicate that under different conservation perspectives, the groups of Creole breeds generally had a higher conservation priority than Iberian, British or Continental European breed groups (Tables 5 and 6). This may reflect the strong selection pressure and con-sequent loss of genetic diversity of commercial European breeds over the years, such as those included in the British and Continental European breed groups, whereas herdbooks and organized breeding programs have only recently been adopted for a few Creole breeds. Among the Creole breeds, conservation priorities depended on whether the method used placed more emphasis on the contribution of each breed to the within- or the between-breed component of genetic diversity. Thus, if the focus was on breed distinctiveness, priority was given to most breeds classified in breed groups Creole1 (breeds from Argentina, Brazil and Uruguay), Creole3 (two breeds from Colombia) and Creole4 (breeds from Panama), whereas if the focus was on within-breed di-versity, priority was given to breeds from Creole2 (three breeds from Colombia and one from Paraguay), Creole5 (most Mexican breeds) and Creole6 (two breeds from Cuba, one from Ecuador, one from Mexico, and most Colombian breeds). Finally, for individual Creole breeds, the contribution to genetic diversity based on average coancestries combined with genetic distances (Table 4), generally prioritized breeds that are thought to have the highest degree of zebu admixture (Creole5 and Creole6).
The difficulties associated with the choice of the best method to prioritize breeds for conservation decisions were recently discussed in several papers [11,24,27,39] and are illustrated by our results. For example, Martinez et al. [40] reported that the highly-threatened Guabalá is a Creole breed with strong signatures of Iberian ances-try. However, in our study, it had the lowest levels of genetic diversity, the highest within-breed coancestry, and the highest average Nei’s distance (Tables 1 and 4). Thus, including the Guabalá breed among those priori-tized for conservation depended highly on the criteria used for breed ranking, i.e. it was classified as a top pri-ority when the focus was on between-breed diversity (such as in the Weitzman procedure), but was the first breed to be excluded when only the within-breed com-ponent of genetic diversity was considered (proportional
contribution to He). This is in line with previous findings
[16,17] that indicate that small, inbred breeds will be given priority when the emphasis is placed on the between-breed component. This result invalidates the use of the Weitzman approach, based on genetic distances, as a single measure for breed prioritization. In contrast, higher ranking will be given to large, and pos-sibly crossbred, populations when the emphasis is placed on the within-breed component [24]. Nevertheless, when other methods are used, the ranking of Guabalá depends on the weight given to each component of the overall genetic diversity, i.e. it has a low conservation value with kinship-based methods (Table 3) because of its high inbreeding but it is highly ranked with methods that give greater weight to the between-breed component such as the Piyasatian and Kinghorn approach [34]. When ana-lyzing the genetic diversity of Iberian cattle, Cañon et al. [39] were faced with the same difficulty, i.e. that the more a breed was differentiated (e.g. Mirandesa) the more likely it had undergone strong genetic drift and showed high levels of inbreeding. Thus, classifying such breeds among the top priorities for conservation deci-sions depended on the strategy followed, although they constitute reservoirs of rare alleles. This pattern of genetic variation distribution is typical of sub-divided populations in which the global genetic diversity of the species is maintained at the cost of a loss in the genetic variability of the sub-populations.
Overall, the choice of the most appropriate method to prioritize breeds for conservation decisions is deter-mined by whether it is important to maintain genetic diversity for the short- or long-term. For example, if the focus is on short-term objectives, the emphasis should be placed on maintaining high levels of heterozygosity, while if it is on long-term objectives, the emphasis should be placed on allelic richness and breed differen-tiation [9]. In the particular case of Creole cattle, for which distinct evolutionary trajectories and selection for
adaptation to extreme environments have played a major role, the preservation of high levels of allelic diversity is a key element for their long-term preservation and for maintaining their ability to cope and adjust to future environmental changes. Furthermore, in addition to establishing conservation priorities among candidate breeds, it may be important to carry out similar analyses on a within-breed basis to define conservation priorities among different herds, strains, etc., which may be particularly important in breeds with a pronounced substructure [39].
One key issue, which is well-exemplified in the case of Creole cattle, is how misleading the exclusive conside-ration of high heterozygosity might be, and how it should be carefully assessed and interpreted. For ex-ample, several of the Creole breeds included in our study are known to have been admixed with zebu cattle in the beginning of the 20th century, and show strong signs of this influence [40,61]. As expected, breeds with zebu admixture (which are mainly included in the Creole6 breed group) have the highest levels of heterozygosity (Table 1), and thus are often classified as the top priority for conservation decisions (Tables 3 and 4). Indeed, this is also in the case in the analyses of the geographical breed groups, which classify Creole6 and Indicine as the top priorities for conservation with most of the methods used (Table 5). These results reinforce the idea that sta-tistical analyses aimed at making conservation decisions are useful but should be considered carefully, since there is a risk that some breeds or breed groups may be ignored in conservation programs. Thus, such decisions must take into account additional factors, including the results of other methods such as cluster and admixture analyses. One example of an ancillary method is the esti-mation of marginal kinship-based diversities per breed [16], which take into account extinction probabilities, to measure the expected loss of diversity within a defined time interval. Given the difficulties with estimating valid extinction probabilities [12] for most of the Creole breeds, for which the risk status is largely unknown, we chose not to include this approach in our analyses but recognize its relevance to conservation studies.
The establishment of conservation priorities based
only on‘neutral’ genetic markers, such as microsatellites,
can fail to take into account important genetic informa-tion associated with phenotypic variainforma-tion (e.g. morph-ology or production traits), disease resistance, and other adaptive traits. Starting with a few B. taurus animals
imported from Iberia since the 15thcentury [62], Creole
cattle expanded throughout the Americas and adapted to environmental conditions ranging from the Chihua-hua desert to Patagonia, or from the tropical climate of the Caribbean to the Chilean Andes. Natural selection probably played a major role in the adaptation to these
novel and diverse environmental niches and in the differentiation of Creole subpopulations. When com-pared to other taurine breeds, Creole breeds have been shown to have better heat tolerance [63,64], greater re-sistance to ticks [65,66] and to Tropical Ox Warble [67], lower incidence of anaplasmosis [68], better immune re-sponse [69], greater docility and more desirable grazing behavior [70], higher fertility and longevity [67], and higher productivity under given conditions [71]. This resili-ence can be of extreme importance in a world facing climate changes [72]. Whole-genome approaches using next-generation sequencing have been developed for livestock species, particularly cattle, which allow identi-fication of genomic regions under selection [73-75]. Be-cause a high number of genetic markers in coding and non-coding genomic regions can be used (e.g. SNPs), such a genomic approach can provide more reliable es-timates of inbreeding coefficients when pedigree infor-mation is lacking, as well as more accurate measures of genetic diversity and of the conservation value of the different breeds [10]. Thus, and following recent FAO guidelines for the in vivo preservation of AnGR [76], it is important to investigate furthermore and carefully evaluate the usefulness of whole-genome SNPs to define conservation priorities of genetically distinct breeds of Creole cattle in addition to the microsatellite-based in-ferences reported in this study. Creole breeds have a particular evolutionary history that can be crucial to better understand the genetic basis of adaptation because, from a small number of animals originally brought from the Iberian peninsula [57], Creole cattle populations have adapted to very distinct environmental conditions, spread-ing from Texas to Patagonia. Thus, it can be expected that Creole cattle carry specific genetic signatures of genomic regions under selection, and genome sequencing will be extremely useful to identify these regions.
Prior to applying the conservation priority principles discussed here on a large scale, it is essential that a better and more extensive sampling is carried out, par-ticularly for more endangered breeds, and that a general agreement is reached on the specific criteria to be used in the definition of priorities. Besides factors directly associated with genetic diversity, which have been the subject of our study, other aspects such as the contribu-tion of a breed to food security and economic return, the demography and risk status, the existence of unique traits or specific adaptation features, the historical and cultural values, the contribution to sustainable deve-lopment and environmental balance, etc., should also be taken into account [58]. The end result may be an index combining the different ranking criteria weighted appro-priately to establish conservation priorities, as outlined by the FAO [59,76]. In any case, the consensus is that the best way to ensure the survival of a breed is to make
its use more profitable and appealing to producers. The development of sustainable utilization and organized crossbreeding programs involving Creole breeds, and the added value resulting from their products, could make a major contribution towards their survival for the future.
Conclusions
The contributions to within- and between-breed genetic
diversity based on ‘neutral’ genetic markers were
eva-luated in a large sample of Iberoamerican cattle breeds, to provide the basis for establishing conservation prior-ities. Our results indicate that Creole cattle breeds retain considerable levels of genetic diversity and that several local isolated breeds are important reservoirs of genetic diversity. Conservation priorities depended on the approach used, i.e., on whether the emphasis was placed on the within- or the between-breed component of genetic diversity. In general, if the focus was on between-breed diversity, the Creole breeds classified as top priority were the most clearly differentiated with smaller census and higher levels of inbreeding, while if the focus was on within-breed genetic diversity, they failed to be considered. Thus, besides its contribution to the overall genetic diversity, other features of a breed should also be considered when considering a conserva-tion program, such as its adaptaconserva-tion to specific environ-ments, possession of unique traits, cultural and historical value, and contribution to environmental sustainability, among others. Other types of genetic markers, including novel SNPs, may detect other genetic factors related to breed differentiation, especially those underlying adap-tation and production traits, and should be investigated for use in conservation applications.
Additional files
Additional file 1: Table S1. Details on the cattle breeds and geographical breed groups included in this study. Description: Breed names axnd acronyms, sample origins and sizes, and number of genotyped microsatellite loci are provided. Summary statistics of within-breed genetic diversity are also shown, namely: observed (Ho) and
unbiased expected (He) heterozygosities, mean number of alleles (MNA),
allelic richness corrected for sample size (Rt), and the respective standard
deviation (SD).
Additional file 2: Figure S1. Contour plots of average coancestries (fm).
Description: Creole cattle breeds (a) and geographical breed groups (b) were sorted according to the respective kinship phylogenies. Breed acronyms are defined as follows: CRA, Cr. Argentino; PAT, Cr. Patagonico; CAR, Caracú; CRU, Cr. Uruguayo; BON, Blanco Orejinegro; HVA, Hartón del Valle; LUC, Lucerna; PCH, Pampa Chaqueño; CCC, Costeño con Cuernos; RMS, Romosinuano; GUA, Guabalá; GUY, Guaymí; SMA, Sanmartinero; CBC, Cr. Baja California; CHU, Cr. Chihuahua; CNY, Cr. Nayarit; CPO, Cr. Poblano; TLH, Texas Longhorn; CAQ, Caqueteño; CHS, Chino Santandereano; CAS, Cr. Casanareño; VEL, Velasquez; CUB, Cr. Cubano; SIB, Siboney; ECU, Cr. Ecuatoriano; CHI, Cr. Chiapas; PIL, Cr. Pilcomayo.


![Table 4 Contributions of Creole cattle breeds to diversity according to Caballero and Toro [20] and Fabuel et al](https://thumb-eu.123doks.com/thumbv2/123dok_br/18700266.916225/11.892.86.810.147.716/table-contributions-creole-cattle-diversity-according-caballero-fabuel.webp)