UNIVERSIDADE DE LISBOA FACULDADE DE CIÊNCIAS
DEPARTAMENTO DE ENGENHARIA GEOGRÁFICA, GEOFÍSICA E ENERGIA
Carbon Capture and Storage in the Power Sector of
Portugal and Spain
Lukas Fritz
Mestrado Integrado em Engenharia da Energia e do Ambiente
UNIVERSIDADE DE LISBOA FACULDADE DE CIÊNCIAS
DEPARTAMENTO DE ENGENHARIA GEOGRÁFICA, GEOFÍSICA E ENERGIA
Carbon Capture and Storage in the Power Sector of
Portugal and Spain
Lukas Fritz
Dissertação de Mestrado Integrado em Engenharia da Energia e do Ambiente
Trabalho realizado sob a supervisão de Prof. Dra. Dulce Boavida (LNEG, FCUL)
Acknowledgments
I would like to thank Professor Dr. Dulce Boavida and Professor Dr. Jorge Maia Alves for their supervision and suggestions during this work and for their great support during my studies on the University of Lisbon.
Also, I would like to thank my colleagues at FCUL for all their support and friendship, which made my start in Lisbon very enjoyable. Special thanks to my sister Maria Fritz for her help in the revision of the thesis.
I owe my deepest gratitude to my girlfriend Ana Duarte, for being the main motivator during my studies and for inspiring me.
Furthermore I would like to thank my family and all my friends for the great support and motivation. Special thanks to my brother Matthias Fritz and my cousin Johannes Schmid for her unique and special way of supporting and motivating me in finishing my thesis.
Abstract
Portugal and Spain are still relying heavily in fossil fuels. In the year 2007 around 64% of Portugal’s and 61% of Spain’s total electricity generation was provided by conventional, fossil-fuel based power plants. Due to the high dependency of Portugal’s and Spain’s power sector on fossil fuels, the related CO2 emissions of this sector are very high. To limit climate change to an acceptable level, where its consequences are limited to a minimum, it is necessary to define the cap in temperature increase with 2-degree Celsius, compared to pre-industrial level. To reach this ambitious target, carbon dioxide emissions of industrialized countries, including Portugal and Spain, have to be reduced by at least 80% by 2050. These changes will include a sharp increase in electricity generation out of renewable energy sources, strict energy efficiency measures and the induction of CCS technologies for coal- and gas-fired power plants.
The objective of the following study was to analyze the necessity and technical and economical viability of CCS systems for Portugal’s and Spain’s power sector, in order to decarbonize the Iberian power sector by 2050. For that purpose the carbon dioxide LPS (large point sources) of the power sectors and possible storage sides for CO2 were identified and a source-sink matching analysis was performed by mapping the LPS sources and potential geological sinks to analyze the proximity of sources and sinks. Furthermore the future economic potential of RES for electricity production was identified. For that two different scenarios were developed. In a first scenario 60% of electricity generation will be covered by RES and the remaining 40% in even shares by CCS based coal- and gas-fired power plants. The second scenario assumes 80% RES and 20% CCS. For Spain in both scenarios nuclear power generation is considered with a share of 10%. In the last part of the thesis the economical parameters for different power generation technologies were analyzed and the Levelized Cost of Electricity Generation (LCOE) by 2050 calculated. As the results show, the break-even price for CO2 certificates will be around 25 €/t in order to make coal based CCS power plants economical viable. For gas-fired power plants the break-even price is around 83 €/t.
Resumo
Portugal e Espanha são ainda caracterizados por uma forte dependência nos combustíveis fósseis. No ano de 2007, cerca de 67% da produção eléctrica total em Portugal foi gerada por centrais convencionais baseadas em combustíveis fósseis. Devido a esta forte dependência nos combustíveis fósseis, verificada quer no sector energético português, quer no espanhol, as emissões de CO2 resultantes assumem valores elevados. De forma a ser possível limitar as alterações climáticas a um nível aceitável, minimizando o seu impacto, torna-se necessário definir o cap do aumento da temperatura a 2 graus Celsius, em relação ao nível pré-industrial. A fim de alcancar este ambicioso objectivo, as emissões de dióxido de carbono nos países industrializados, incluindo Portugal e Espanha, têm de ser reduzidas em pelo menos 80% até 2050. As alterações necessárias incluem um aumento acentuado da produção energética com base em fontes renováveis, rigorosas medidas para a eficiência energética e a introdução de tecnologias CCS para centrais de carvão e de gás.
O objectivo do presente estudo foi analisar a necessidade bem como a viabilidade técnica e económica das tecnologias CCS no sector energético em Portugal e Espanha, de forma a descarbonizar o sector de energia Ibérico até ao ano de 2050. Para o efeito, as LPS (Large Point Sources) de dióxido de carbono dos sectores energéticos, e possíveis formas de armazenamento de CO2 foram identificadas e uma análise de correspondência fonte-dreno foi efectuada pelo mapeamento das fontes de LPS e potenciais sumidouros geológicos, e analise da proximidade de fontes e sumidouros. Da mesma forma, o potencial económico futuro de RES para a produção de electricidade foi identificado. Nesse âmbito, dois cenários diferentes foram analizados. No primeiro cenário, 60% da produção eléctrica será proveniente de fontes energéticas renováveis enquanto os restantes 40% em igual proporção de centrais de carvão e de gás baseadas em tecnologias CCS. No segundo cenário considera-se 80% RES e 20% CCS. Para Espanha, em ambos os cenários, considera-se uma taxa de 10% de produção energética nuclear. Na parte final da tese, foram analisados os parametros económicos para tecnologias de produção energética diversas e calculados os Levelized Costs of Electricity Generation (LCOE) até 2050. Como os resultados demonstram, o preco break-even para os certificados de CO2 será cerca de 25€/t de forma a tornar as centrais de carvão baseadas em CCS economicamente viáveis. No caso das centrais de gás, o preco break-even assume valores de aproximadamente 83€/t.
Acronyms
CAPEX Capital Expenditures
CCS Carbon Capture and Storage
CCGT Combined Cycle Gas Turbine
CO2 Carbon Dioxide
CSP Concentrating Solar Power
ECBMR Enhanced Coal Bed Methane Recovery
ECF European Climate Foundation
EEA European Energy Agency
EGR Enhanced Gas Recovery
EOR Enhanced Oil Recovery
EU – ETS European Union Emissions Trading Scheme
GDP Gross Domestic Product
GHG Greenhouse Gases
HVDC High Voltage Direct Current
IEA International Energy Agency
IGCC Integrated Gasification Combined Cycle
IPCC Intergovernmental Panel on Climate Change
LCOE Levelized Cost of Electricity Generation
LPS Large Point Sources
LRMG Long Run Marginal Costs
MEA Mono-Ethanolamine
NAP National Allocation Plan
NGCC Natural Gas Combined Cycle
OPEX Operational Expenditures
PSA Pressure Swing Adsorption
RES Renewable Energy Sources
TPES Total Primary Energy Supply
Table of contents
1. Introduction ... 1
1.1 Background ... 1
1.2 Status Quo and the objective of the thesis ... 3
1.3 Organization of the thesis ... 4
2. State of the art of CCS technology ... 6
2.1 Common carbon capture systems and technologies... 7
2.1.1 Carbon dioxide capture technologies... 8
2.1.2 Carbon dioxide capture systems ... 11
2.2 Compression and dehydration of carbon dioxide... 19
2.3 Carbon dioxide transportation systems ... 21
2.3.1 Pipeline transportation systems ... 21
2.3.2 Ship transport of carbon dioxide... 22
2.4 Carbon dioxide storage ... 22
2.4.1 Underground geological storage... 23
3. CO2 emissions and the power sector ... 27
3.1 Worldwide anthropogenic greenhouse gas emissions... 27
3.2 Carbon dioxide emissions of Portugal ... 28
3.2.1 CO2 emissions of Portugal’s power sector ... 29
3.2.2 Identification of Portugal’s stationary CO2 LPS... 31
3.3 Carbon dioxide emissions of Spain... 34
3.3.1 CO2 emissions of Spain´s power sector... 35
3.3.2 Identification of Spain´s stationary CO2 LPS ... 37
3.4 CO2 source - sink matching in Portugal and Spain ... 39
4. Power sector of the countries researched ... 44
4.1 The power sector of Portugal ... 44
4.1.2 Renewable energy sources in Portugal’s electricity generation ... 48
4.2 The power sector of Spain ... 52
4.2.1 Power sector overview... 52
4.2.2 Renewable energy sources in Spain´s electricity generation... 56
5. Induction of CCS technologies within the power sector ... 59
5.1 CCS technologies in Portugal’s power sector... 59
5.2 CCS technologies in Spain´s power sector ... 64
6. Economical feasibility of CCS technologies ... 70
6.1 Carbon prices and merit order... 72
6.2 Development of electricity generation costs ... 77
6.2.1 LCOE in comparison for commissioning by 2015 ... 80
6.2.2 LCOE in comparison for commissioning by 2050 ... 83
6.2.3 Sensitivity analysis of LCOE... 86
7. Conclusions ... 89
References ... 92
Annex I... 99
List of Figures
Figure 1.1: Linkage between anthropogenic climate change drivers, impacts of and responses to climate change change (Source: IPCC – Intergovernmental Panel on Climate Change (2007), Climate Change 2007: Synthesis Report, URL: http://www.ipcc.ch/pdf/assessment-report/ar4/syr/ar4_syr.pdf [10.01.2011])
Figure 2.1: Simplified overview of CO2 process chain from its source to the sink (Source: CRC for Greenhouse Gas Technologies (2006), Review of Geological Storage Opportunities for Carbon
Capture and Storage (CCS) in Victoria, URL:
http://www.co2crc.com.au/dls/pubs/regional/victoria_06_0506.pdf [10.02.2011])
Figure 2.2: Carbon dioxide separation with sorbents/solvents (Source: Metz / Davidson a. o., IPCC, Special Report on Carbon Dioxide Capture and Storage (2005), URL: http://www.ipcc.ch/pdf/special-reports/srccs/srccs_chapter3.pdf, [10.02.2011])
Figure 2.3: Carbon dioxide separation with membranes (Source: Metz / Davidson a. o., IPCC, Special Report on Carbon Dioxide Capture and Storage (2005), URL: http://www.ipcc.ch/pdf/special-reports/srccs/srccs_chapter3.pdf, [10.02.2011])
Figure 2.4: Carbon dioxide separation by cryogenic distillation (Source: Metz / Davidson a. o., IPCC, Special Report on Carbon Dioxide Capture and Storage (2005), URL: http://www.ipcc.ch/pdf/special-reports/srccs/srccs_chapter3.pdf, [10.02.2011])
Figure 2.5: Scheme of common carbon dioxide capture systems (Source: Metz / Davidson a. o., IPCC, Special Report on Carbon Dioxide Capture and Storage (2005), URL: http://www.ipcc.ch/pdf/special-reports/srccs/srccs_chapter3.pdf, [04.02.2011])
Figure 2.6: Process flow diagram of CO2 capture from flue gas by chemical absorption (Source: Metz / Davidson a. o., IPCC, Special Report on Carbon Dioxide Capture and Storage (2005), URL: http://www.ipcc.ch/pdf/special-reports/srccs/srccs_chapter3.pdf, [04.02.2011])
Figure 2.7: Phase diagram of carbon dioxide (Source: ChemicaLogic Corporation, 99 South Bedford
Street, Suite 207, Burlington, MA 01803, USA, URL:
http://www.chemicalogic.com/download/co2_phase_diagram.pdf [10.03.2011])
Figure 2.8: Geological Storage Options for carbon dioxide (Source: Metz / Davidson a. o., IPCC, Special Report on Carbon Dioxide Capture and Storage (2005), URL: http://www.ipcc.ch/pdf/special-reports/srccs/srccs_chapter3.pdf, [15.03.2011])
Figure 2.9: Injection of CO2 for EOR (Source: Metz / Davidson a. o., IPCC, Special Report on Carbon Dioxide Capture and Storage (2005), URL: http://www.ipcc.ch/pdf/special-reports/srccs/srccs_chapter3.pdf, [16.03.2011])
Figure 3.1: Anthropogenic GHG emissions by sector and by gas in 2008, (Source: UNFCCC,
Summary of GHG Emissions for Annex I (2010), URL:
http://unfccc.int/files/ghg_data/ghg_data_unfccc/ghg_profiles/application/pdf/ai_ghg_profile.pdf [20.03.2011])
Figure 3.2: Shares of carbon dioxide emissions in 2007 by sector of Portugal (Source: European Commission, Directorate-General for Energy and Transport, EU Energy in figures 2010, CO2
emissions by sector, URL:
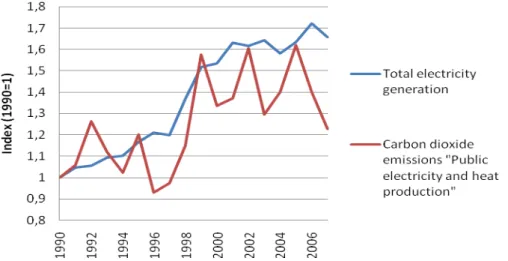
http://ec.europa.eu/energy/publications/doc/statistics/ext_co2_emissions_by_sector.pdf, [20.03.2011]) Figure 3.3: Increase in total electricity generation and related CO2 emissions of Portugal (Data source: European Commission (2010a) and European Commission (2010b))
Figure 3.4: Carbon intensity of Portugal’s power sector “Public electricity and heat production” (Data source: European Commission (2010a) and European Commission (2010b))
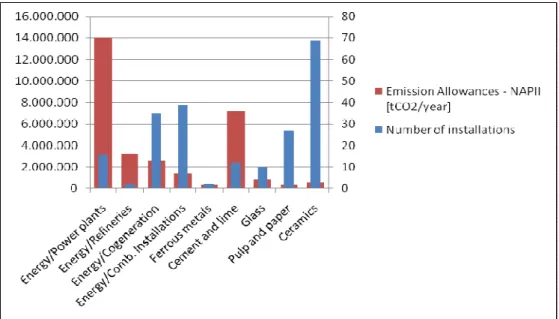
Figure 3.5: Number of installations included in the NAP II (2008-2012) of Portugal and related annual emission allowances (Data source: Plano Nacional de Alocação de Licenças de Emissão II (PNALE II) (2008b))
Figure 3.6: Identification of Portugal’s sectoral carbon dioxide LPS (Data source: Plano Nacional de Alocação de Licenças de Emissão II (PNALE II) (2008b))
Figure 3.5: Shares of carbon dioxide emissions in 2007 by sector of Spain (Source: European Commission, Directorate-General for Energy and Transport, EU Energy in figures 2010, CO2
emissions by sector, URL:
http://ec.europa.eu/energy/publications/doc/statistics/ext_co2_emissions_by_sector.pdf, [20.03.2011]) Figure 3.6: Increase in total electricity generation and related CO2 emissions of Spain (Data source: European Commission (2010a) and European Commission (2010b))
Figure 3.7: Carbon intensity of Spain´s power sector “Public electricity and heat production” (Data source: European Commission (2010a) and European Commission (2010b))
Figure 3.8: Number of installations included in the NAP II (2008-2012) of Spain and related annual emission allowances (Data source: Plano Nacional de asignación 2008-2012 (2007))
Figure 3.9: Identification of Spain´s sectoral carbon dioxide LPS (Data source: Plano Nacional de asignación 2008-2012 (2007))
Figure 3.10: Map of Portugal’s and Spain´s power sector related CO2-LPS (Data source: Plano Nacional de asignación 2008-2012 (2007) / Plano Nacional de Alocação de Licenças de Emissão II (PNALE II) (2008b))
Figure 3.11: Geographical location of potential CO2 storage sides on the Iberian Peninsula (Data source: Machado, S. / Sampaio, J. et al. (2007) / Sousa, M.L. (2007) / EU GeoCapacity (2009))
Figure 4.1: Development of electricity generation and consumption in Portugal (Data source: European Commission (2010b))
Figure 4.2: Development of Portugal’s electricity generation mix in the period 1990 – 2007 (Data source: European Commission (2010b))
Figure 4.3: Share of RES (with and without hydropower) on Portugal’s total electricity generation (Data source: European Commission (2010b))
Figure 4.4: Development of electricity generation and consumption in Spain (Data source: European Commission (2010b))
Figure 4.5: Development of Spain´s electricity generation mix in the period 1990 – 2007 (Data source: European Commission (2010b))
Figure 4.6: Share of RES (with and without hydropower) on Spain´s total electricity generation (Data source: European Commission (2010b))
Figure 6.1: Break-even price of carbon at which coal and gas would change places in the merit order. (Source: International Energy Agency (2007b), Climate Policy Uncertainty and Investment Risk) Figure 6.2: Effects of carbon price on the merit order (Source: International Energy Agency (2007b), Climate Policy Uncertainty and Investment Risk)
Figure 6.3: Price duration curve and contribution margin of gas- and coal-fired power stations (Source: Zimmermann, Stephan (2010), E.ON Kraftwerke, Energie 2030 und Energiemix, 6. Kraftwerksforum, Stade (E.ON power plants, Energy 2030 and Energymix, 6. Power plant symposium, Stade))
Figure 6.4: Costs for CO2 transport (pipeline and ship) in dependence on source-sink distance (Source: IPCC (2005, p. 192).
Figure 6.5: LCOE of different electricity generation technologies by 2050
Figure 6.6: Carbon price sensitivity of LCOE of different electricity generation technologies by 2050 Figure 6.7: Fuel price sensitivity of LCOE of different electricity generation technologies by 2050
List of Tables
Table 2.1: Capture toolbox (Source: Metz / Davidson a. o., IPCC, Special Report on Carbon Dioxide Capture and Storage (2005), URL: http://www.ipcc.ch/pdf/special-reports/srccs/srccs_chapter3.pdf, [04.02.2011])
Table 3.1: Installations of the power sector included in the NAP II and identification of LPS (Data source: Plano Nacional de Alocação de Licenças de Emissão II (PNALE II) (2008b))
Table 4.1: Primary energy endogenous technical potential until 2050 (Data source: COMET (2010a)) Table 4.2: Renewable Electricity Performance Indicators, representing the average renewable electricity yield of a typical facility in each country. (Data source: MED-CSP (2005))
Table 4.3: Technical and Economic Renewable Electricity Supply Side Potentials in TWh/year (Data source: MED-CSP (2005))
Table 4.4: International power interchanges in GWh (Source: REE (2010), REE (2006))
Table 4.5: Technical and Economic Renewable Electricity Supply Side Potentials in TWh/year (Data source: MED-CSP (2005))
Table 5.1: Max. use of RES by 2050 and their annual electricity generation under the 60% RES scenario (Data source: MED-CSP (2005))
Table 5.2: Share of different electricity generation technologies by 2050 in percent of total electricity generation (60% RES and 80% RES scenario)
Table 5.3: Reduction of carbon dioxide emissions by CCS technologies in the 60% RES scenario Table 5.4: Max. use of RES by 2050 and their annual electricity generation under the 60% RES scenario (Data source: MED-CSP (2005))
Table 5.5: Share of different electricity generation technologies by 2050 in percent of total electricity generation (60% RES and 80% RES scenario)
Table 5.6: Reduction of carbon dioxide emissions by CCS technologies in the 60% RES scenario Table 5.7: Reduction of carbon dioxide emissions by applying CCS technologies in the different scenarios
Table 6.1: Development of primary energy prices between 2005 and 2050 in “Basis” and “Alternative” scenario (Source: University of Stuttgart (2008b, p. 14))
Table 6.3: Elements of LCOE for different electricity generation technologies by 2015
Table 6.4: Technical and economical parameters for reference power plants (Commissioning by 2050) Table 6.5: Elements of LCOE for different electricity generation technologies by 2050
Lukas Fritz 1
1.
Introduction
1.1 Background
Already in 1988 the Intergovernmental Panel on Climate Change (IPCC) was jointly established and its first assessment report on climate change was published in 1990, stating that emissions resulting from human activities are substantially increasing the concentration of greenhouse gases (GHG) and that these increases will enhance the greenhouse effect, resulting in an additional warming of the Earth´s surface.1 As climate change is a global issue and its consequences are real, effective responses on a global level are needed to tackle it. By the definition of the IPCC, “climate change refers to a change in the state of climate that can be identified by changes in the mean and/or the variability of its properties and that persists for an extended period (decades or longer). It refers to any change in climate over time, whether due to natural variability or as a result of human activity.”2 This definition differs from the definition used by the United Nations Framework Convention on Climate Change (UNFCCC). The UNFCCC defines it as “a change of climate that is attributed directly or indirectly to human activity that alters the composition of the global atmosphere and that is in addition to natural climate variability observed over comparable time periods.”3
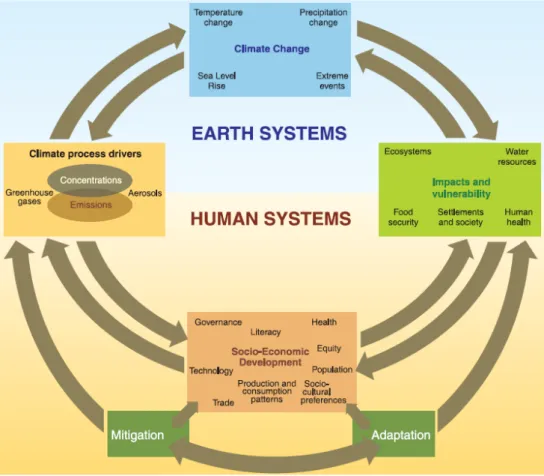
Climate change and its global effects on natural systems have great impacts on our society and human beings in general. Change of temperature and precipitation, the rise of sea level and extreme local weather events influence and harm our ecosystems, water resources, food security, settlements and society as well as human health. This leads to serious conflicts with our socio-economic development. Exactly this socio-economic development is the cause of the conflict due to misuse of our natural- and human resources which have influence on the climate process drivers such as greenhouse gases.4 The influence parameters on our socio-economic development, such as technology, population, trade and many more, are the reason for anthropogenic drivers on climate change. These drivers have to be reduced in a sustainable way to limit the effects of climate change to an acceptable level. The mitigation of climate process drivers has a direct impact on the level of adaptation to climate change.
1 IPCC (1990, p. XI) 2 IPCC (2007a, p. 30) 3 IPCC (2007a, p. 30) 4 IPCC (2007a, p. 26)
Lukas Fritz 2 The following schematic framework illustrates the linkages between anthropogenic climate change drivers, impacts of and responses to climate change as described above.
Figure 1.1: Linkage between anthropogenic climate change drivers, impacts of and responses to climate change (Source: IPCC – Intergovernmental Panel on Climate Change (2007), Climate Change 2007: Synthesis Report, URL: http://www.ipcc.ch/pdf/assessment-report/ar4/syr/ar4_syr.pdf [10.01.2011])
An acceptable level of climate change, where its consequences are limited to a minimum, is to limit the temperature increase to 2-degree Celsius, compared to pre-industrial level. This is confirmed by the Fraunhofer Institute Systems and Innovation Research (Fraunhofer-ISI), which assumes that negative consequences of climate change remain limited and no tipping points of natural systems are reached with a temperature increase of 2-degree Celsius.5 This restriction in temperature rise requires high efforts in mitigation and besides that considerable adaption to climate change effects. The Intergovernmental Panel on Climate Change expects a rise of sea level of 0.4 to 1.4 meters for a temperature increase of 2.0 to 2.4 degree Celsius compared to pre-industrial levels.6 In order to reach this ambitious target, the European Union formulates the target of reducing GHG emissions by -50%
5
Fraunhofer Institute Systems and Innovation Research (Fraunhofer-ISI) (2009, p. 3-4) 6
Lukas Fritz 3 by 2050 compared to 1990 on a global level. This equals a necessary reduction of -80 to -95% by the industrialized countries by 2050.7 This was the scientific basis when the leaders of the European Union and the G8 decided in July 2009 for the objective to reduce greenhouse gas emissions (GHG) by at least 80% by 2050 compared to 1990 levels. The abatement objective of 80 to 95% for Europe and other developed economies was set in October 2009 by the European Council.8 This ambitious target results in substantial reductions of GHG in all sectors and likely translates to a requirement of an almost complete decarbonization of some sectors – like the power sector – in particular. This necessary decarbonization of the power sector results out of the structure (mainly large scale CO2 point sources) of this sector and its high share on total GHG emissions.
1.2 Status Quo and the objective of the thesis
Within the different options of decreasing the worldwide greenhouse gas emissions, including carbon dioxide emissions, the option of carbon capture and storage for a reduction of CO2 emissions within the large scale power sector is widely discussed. Obviously the implementation of CCS technologies doesn´t imply an avoidance of CO2 as a gaseous product of the combustion process, but avoids the appearance of carbon dioxide as a pollutant (immission) in our atmosphere. By energy producers and policy makers this option is considered as a potential CO2 reduction possibility especially for large scale CO2 point sources (LPS) such as coal-fired power plants as well as a so called bridging technology during the time needed to base our energy supply on carbon free, renewable energy technologies. Though it is clear that no single measurement taken to reduce GHG is sufficient to tackle climate change and broad actions are needed, with CCS technologies the use of fossil fuels such as coal for power generation and combustion in industrial processes will continue well into this century. This is due to the fact that coal is a relatively abundant, cheap, available and globally distributed energy source and thus enhancing the security and stability of energy systems.9 This is confirmed by the World Coal Institute who mentions that coal is located worldwide and can be found on each continent with the biggest reserves in the USA, Russia, China and India.10 Transition economies, such as China and India, are searching to base their economy on cheap resources in order to fulfill their tremendously increasing energy demand and to ensure their energy supply. The combustion of coal in developing countries was the main reason of the increase of the global CO2 emissions between 2006
7
Fraunhofer Institute Systems and Innovation Research (Fraunhofer-ISI) (2009, p. 4) 8
ECF - European Climate Foundation (2010, p. 3) 9
Bachu (2007, p. 254) 10
Lukas Fritz 4 and 2007.11 Therefore especially in transition economies clean coal technologies and CCS can play a major role in reducing CO2 emissions.
The objective of the following study is to analyze the feasibility of the implementation of CCS technologies as a possible pathway to go in order to tackle climate change and therefore to decarbonize the power sector of the Iberian Peninsula (Portugal and Spain). The feasibility will be studied on a technical, economical and energetic/ecological basis. This includes an analysis of the existing power sectors of the countries mentioned above to estimate the potentials and necessity for the implementation of CCS technologies.
The goal is to analyze the role of CCS in the transition of the power sector under an increasing penetration of renewable energy sources. Considered are the existing, stationary CO2 large point sources within the power sector, as they are the main contributors on CO2 emissions of the power sector and therefore possible applications for CCS. Basis for the identification of CO2 LPS are the installations included in the National Allocation Plan II of the European Emissions Trading Scheme in the Kyoto Protocol commitment period 2008 until 2012. The assessment of the implementation of CCS as a possible carbon dioxide mitigation strategy has to be made on a technical, economical and energetic/ecological basis. Additional energy is required to remove, compress, transport and finally inject the CO2 in its storage side. Furthermore the costs for the whole process chain (from source to sink) have to be considered. The implementation of CCS will also have a strong dependency on political will and therefore on political decision makers – regulatory and legal aspects are playing a major role. Decisions for or against CCS will also be defined by the social acceptance within the population. The analysis of CCS on a political and social level is not goal of the thesis.
1.3 Organization of the thesis
The first chapter focuses on the basics of global warming, the necessity of its mitigation and level of adaption to climate change. Furthermore the global and European GHG reduction commitments necessary to tackle climate change and its consequences for the power sector are mentioned. The aims of the diploma thesis are explained in the chapter “Status Quo and the objective of the thesis”, where the future role of fossil fuels and CCS is explained. Chapter 2 focuses on the current state of CCS technologies and existing capture technologies and systems, opportunities for carbon dioxide transport and ways for long-term storage.
11
Lukas Fritz 5 In the following chapter 3 the author will analyze the anthropogenic, worldwide GHG emissions by its sector and gas and furthermore the carbon dioxide emission data of Portugal and Spain will be analyzed and stationary, large scale CO2-emitters within the power sector identified to make a qualified statement about the possibilities and opportunities existing within the power sector of these countries to reduce their power sector related carbon dioxide emissions. The goal is to analyze the geographical matching between CO2 sources and possible sinks.
In chapter 4 “Power sector of the countries researched” a close look is taken on the electricity sectors of the countries and their generation/fuel mix, to analyze the share of RES on generation and consumption and their dependency on imports. This is necessary to analyze the role of renewable energies in the power sector and their contribution for a decarbonized electricity generation by 2050.
In the following chapter 5 the author will analyze the role of RES and CCS within the power sector in the context of a carbon dioxide emissions reduction by 95% until 2050. Two different decarbonized pathways within the power sectors of Portugal and Spain will be studied and analyzed on a technical and economical scale. These pathways differ in their shares of a mix of renewable energy technologies, CCS technologies for fossil fuels (coal and gas) and, in the case of Spain, nuclear energy. The analysis of the pathways is based on the study “Roadmap 2050”, in which “business as usual” growth in electricity demand is avoided almost completely by applying aggressive energy efficiency measures.
The last chapter of the thesis concentrates on the analysis of the economical feasibility of CCS technologies in the Iberian power sector. The deployment of CCS technologies will strongly depend on the economical competitiveness with alternative/conventional electricity generation technologies. First of all the author will describe the influence of carbon prices on the electricity market (merit order) and how contribution margins of different conventional electricity generation technologies change due to higher carbon prices. In a second stage the development of life cycle cost of electricity generation (LCOE) for the different electricity generation technologies is researched. An attempt is made to estimate the LCOE by 2050 and to derivate the role of RES- and CCS-based electricity generation by 2050. Furthermore the uncertainty of carbon price- and fuel price development and their influence on LCOE by 2050 are considered in a sensitivity analysis.
Lukas Fritz 6
2.
State of the art of CCS technology
To store carbon dioxide it has to be separated from the flue-gas, compressed and transported to the sink. According to the IPCC, carbon capture and storage is defined as a process consisting of CO2 removal from industrial and energy-related sources, transport to a storage location and long-term isolation from the atmosphere.12 The removal of CO2 always involves the separation of carbon dioxide from other gases. For this separation process different technical concepts applicable within the conventional power sector are available. These carbon dioxide capture concepts, the transportation of CO2 from its source to the sink and the different storage concepts existing will be explained further in this chapter. CO2 capture systems are likely to be applied mainly for LPS such as fossil fuel power plants, fuel processing plants and other industrial plants (iron, steel, cement and bulk chemicals production). The capture of CO2 from small and mobile sources, as the residential and commercial building sector and the transportation sector, would be more difficult and expensive than from the already mentioned LPS.13 This is confirmed by the European Energy Agency (EEA) which considers large stationary sources such as power generation or oil refineries as the best application of CCS, having large and concentrated streams of carbon dioxide emissions.14 Therefore the following study will only focus on CCS systems for conventional LPS in the power sector.
For the transport of carbon dioxide to its sink it has to be compressed. This is due to the fact that any gas transported close to atmospheric pressure occupies large volumes, which would require very large facilities. Less volume is occupied if it is compressed and the volume can be further reduced by liquefaction, solidification or hydration. Therefore CO2 can be transported in gaseous, liquid and solid state.15 The physical state of CO2 for transportation will mainly be defined by the energy required and the related costs. The transportation of the separated and compressed carbon dioxide is considered as a relatively mature technology compared with CO2 capture and underground sequestration. CO2 can be transported by pipelines, tanker trucks and ships. However, dedicated CO2 pipelines are the most efficient transport mode for shipment.16 After shipment of CO2 from its source to the sink it can be stored in three different ways: Geological storage, Ocean storage and industrial fixation of CO2 into inorganic carbonates. The geological storage allows storing of carbon dioxide in oil and gas fields, 12 IPCC (2005, p. 3) 13 IPCC (2005, p. 108) 14
EEA - European Energy Agency (2008, p. 15) 15
IPCC (2005, p. 181) 16
Lukas Fritz 7 coal beds and deep saline formations, which are sedimentary rocks saturated with formation water containing high concentrations of dissolved salts. In the ocean the gas can either be directly released into the ocean water column or onto the deep sea floor.17 Independently from the storage option applied, it has to be guaranteed that carbon dioxide is stored over the long-term without any leakage in order to avoid the release of the GHG to the atmosphere and any possible hazard to human beings due to high CO2 concentrations, which could appear locally in case of leakage.
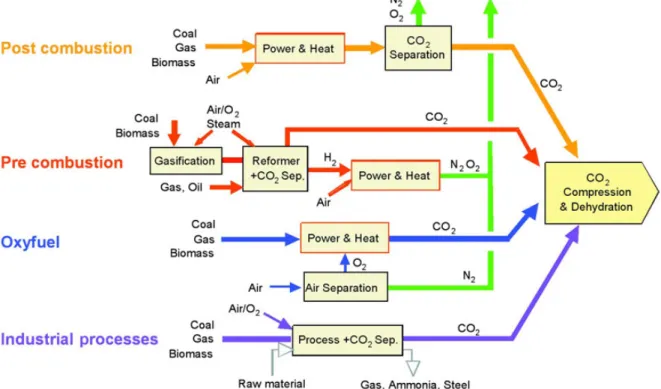
The following graphic shows the basic steps of the process chain in CCS systems, including the power plant as source of CO2, the capturing and separation, compression, transport and injection of CO2 into the storage. In the next chapter the already applied and researched technologies in the different steps within the process chain will be explained and analyzed.
Figure 2.1: Simplified overview of CO2 process chain from its source to the sink (Source: CRC for Greenhouse Gas Technologies (2006), Review of Geological Storage Opportunities for Carbon
Capture and Storage (CCS) in Victoria, URL:
http://www.co2crc.com.au/dls/pubs/regional/victoria_06_0506.pdf [10.02.2011])
2.1 Common carbon capture systems and technologies
As already mentioned above, carbon capture is likely to be applied mainly for carbon dioxide LPS within the power sector. Carbon capture technologies don´t have their origins in the power sector, already for gas- and oil reservoirs CO2 was used to increase the oil-, respectively gas production. This process is called enhanced oil recovery (EOR) or enhanced gas recovery (EGR). In this processes
17
Lukas Fritz 8 carbon dioxide is injected into a reservoir to increase its productivity. This is also confirmed by Herzog, who speaks about the separation and capturing of CO2 out of economic reasons, especially for EOR operations. With the decrease of the oil price in the mid-1980s EOR got too expensive and many of the capture facilities constructed in the late 1970s were forced to close.18 Nowadays separation and capturing of carbon dioxide is as well researched and applied for the mentioned LPS within the power sector as a result out of climate change discussion. It is often considered as a major mitigation strategy.
In the following chapter the author is going to describe and discuss the existing carbon capture systems and technologies, their application and marketability (state of development). The different technical possibilities for the gas separation (separation of CO2 from the flue gas) are called carbon
capture technologies. The main separation processes used for separation CO2 from other gases are: - Separation with sorbents/solvents
- Separation with membranes
- Distillation of liquefied gas streams and refrigerated separation
These gas separation processes can be integrated in different CO2 capture systems. At the time there are existing three main systems for carbon capture applicable for the power sector (excluding industrial processes), which are going to be described further in the following chapters:
- Pre-combustion capture - Post-combustion capture - Oxy-fuel combustion
2.1.1 Carbon dioxide capture technologies
Separation with sorbents/solvents
In this technology the separation of the carbon dioxide is reached by contact of the flue gas with the sorbent used. The sorbent can either be in liquid or solid state. After enriching the sorbent with CO2, it is transported to another vessel where the CO2 is released again (regeneration of the sorbent). This regeneration happens by heating the sorbent, decreasing the pressure or by any other change in the conditions around the sorbent. The regenerated sorbent can be recycled in the first process step to capture CO2 again. In case of a sorbent in its solid state, there is no circulation between the vessels –
18
Lukas Fritz 9 the regeneration is achieved by cyclic changes in pressure or temperature.19 Due to natural losses new, fresh sorbent is needed from time to time (sorbent make-up). As mentioned before heat or pressure loss is needed for the sorbent regeneration process, which translates into required energy and therefore a decrease in the global energy efficiency. The energy demand of the process and also the sorbent material required are resulting in additional costs. Figure 2.2 illustrates the process of CO2 capture with sorbents as described above.
Figure 2.2: Carbon dioxide separation with sorbents/solvents (Source: Metz / Davidson a. o., IPCC, Special Report on Carbon Dioxide Capture and Storage (2005), URL: http://www.ipcc.ch/pdf/special-reports/srccs/srccs_chapter3.pdf, [10.02.2011])
Separation with membranes
The separation of a gas by the use of a membrane is driven by a pressure difference between the feed side (left side of the membrane in Fig. 2.3) and the permeate side (right side of the membrane in Fig. 2.3), which is also called selective permeation. Depending on the composition of the gas entering the feed side and its temperature, the type of membrane can be chosen. Common materials used are coal, ceramics, metal and polymeric membranes.20 While the selectivity of the membrane to different gases is related to the membrane material used, the flow of gas through the membrane is driven by the pressure difference across the membrane. A high pressure difference is usually preferred for membrane based gas separation.21 Figure 2.3 shows schematically the functionality of a gas separation process using a membrane.
19 IPCC (2005, p. 109) 20 Costa (2009, p. 21) 21 IPCC (2005, p. 109)
Lukas Fritz 10
Figure 2.3: Carbon dioxide separation with membranes (Source: Metz / Davidson a. o., IPCC, Special Report on Carbon Dioxide Capture and Storage (2005), URL: http://www.ipcc.ch/pdf/special-reports/srccs/srccs_chapter3.pdf, [10.02.2011])
A gas mixture entering the feed side (A+B) is separated by a membrane. In case of separating carbon dioxide, either Gas A or Gas B can be the concentrated CO2 and the other gas contains all the other remaining gas fractions.
Separation by cryogenic distillation
The separation of CO2 by cryogenic distillation is based on a liquefaction of the flue gas due to series of compression, cooling and expansion steps. Once the flue gas is in liquid form, the different components of the gas can be separated in a distillation column. This process is commercially on large scale applied for separating oxygen from air. This technology can be applied for oxy-fuel combustion and pre-combustion capture systems.22 The described process is illustrated below in figure 2.4.
Figure 2.4: Carbon dioxide separation by cryogenic distillation (Source: Metz / Davidson a. o., IPCC, Special Report on Carbon Dioxide Capture and Storage (2005), URL: http://www.ipcc.ch/pdf/special-reports/srccs/srccs_chapter3.pdf, [10.02.2011])
22
Lukas Fritz 11 For the series of compression, cooling and expansion steps energy is needed to turn the flue gas into a liquid state which results in a decrease of the global energy efficiency and additional costs for the energy required.
2.1.2 Carbon dioxide capture systems
Carbon dioxide capture systems can be applied for power plants (fossil fuelled and biomass), industrial processes and in refinery processes for transforming crude oil in its final products. The main carbon capture systems existing are illustrated in the flow diagram below in figure 2.5. As the thesis concentrates on the power sector, carbon capture systems and technologies applied for industrial processes will not be described further. In post combustion capture technologies the CO2 is removed after the combustion process from the flue gas by a CO2 separation unit. Pre combustion capture systems use gasification systems for solid hydrocarbons to turn the solid material in a gaseous state. By using a reforming process (e.g. Steam reforming) the gaseous (or liquid) hydrocarbons can be turned into hydrogen (H2) and carbon dioxide (CO2). The CO2 is captured before the combustion process and H2 is combusted in the boiler. Oxy-fuel capture systems (or denitrogenation) are based on separating air into oxygen (O2) and nitrogen (N2). The hydrocarbons are combusted with pure oxygen instead of air to produce high concentrated streams of CO2 which is capturing ready.
Figure 2.5: Scheme of common carbon dioxide capture systems (Source: Metz / Davidson a. o., IPCC, Special Report on Carbon Dioxide Capture and Storage (2005), URL: http://www.ipcc.ch/pdf/special-reports/srccs/srccs_chapter3.pdf, [04.02.2011])
Lukas Fritz 12 The separated CO2 has to be compressed and dehydrated to make it transportation ready. The technologies for this separation are going to be discussed further in chapter 2.2.
Depending on the capture system applied, different CO2 capture technologies are available and applied. The following table shows the current and emerging technologies for post combustion, pre combustion and oxy-fuel capture systems.
Separation task Post-combustion capture (CO2/N2) Pre-combustion capture (CO2/H2) Oxy-fuel combustion capture (O2/N2) Capture
technology Current Emerging Current Emerging Current Emerging
Solvents (Absorption) Chemical solvents1 Improved solvents Novel contacting equipment Improved design of process Physical solvents Chemical solvents1 Improved chemical solvents Novel contacting equipment Improved design of processes n. a. Biomimetic solvents, e.g. hemoglobin derivatives Membranes Polymeric Ceramic Facilitated transport Carbon Contactors Polymeric Ceramic Palladium Reactors Contactors Polymeric Ion transport membranes Facilitated transport Solid sorbents Zeolites Activated carbon Carbonates Carbon based sorbents Zeolites Activated carbon Alumins Carbonates Hydrotalcites Silicates Zeolites Activated carbon Adsorbents for O2/N2 separation, Perovskities Oxygen chemical looping
Cryogenic Liquefaction Hybrid
processes Liquefaction Hybrid processes Distillation 1 Improved distillation 1
This carbon capture technology is the commercially and currently preferred technology for the respective capture system in most circumstances.
Table 2.1: Capture toolbox (Source: Metz / Davidson a. o., IPCC, Special Report on Carbon Dioxide Capture and Storage (2005), URL: http://www.ipcc.ch/pdf/special-reports/srccs/srccs_chapter3.pdf, [04.02.2011])
Post-combustion capture
Post-combustion capture is the removal of CO2 from the power plants flue gas after the combustion process as it is also done for other pollutants such as SO2. The removal of CO2 is usually done by a
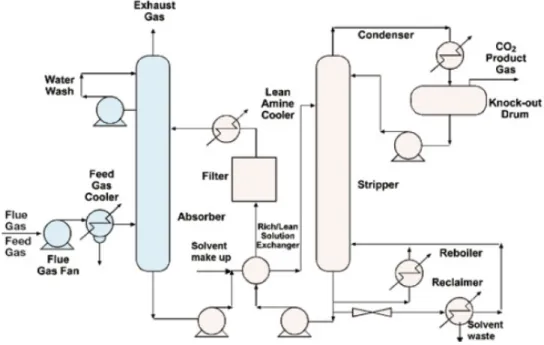
Lukas Fritz 13 scrubbing process which absorbs the carbon dioxide. When taking a look on the current situation of the power sector the importance of post-combustion capture systems becomes obvious. In large scale power plants fossil fuels are directly combusted with air. This results – depending on the fuel used – on large quantities of CO2. The large presence of nitrogen from combustion air and the large scale of the power plants result in huge gas flows. As an example can be mentioned a natural gas combined cycle (NGCC) power plant having a maximum capacity of 5 million normal m³/h flue gas. The CO2 contents of flue gases vary between 3% for NGCC and around 15% by volume for a coal-fired power plant.23 The separation of carbon dioxide from the flue gas of the power plant in post-combustion capture systems is mainly done by using chemical solvents for the absorption process. According to the IEA, most existing CO2 capture systems use chemical absorption in combination with heat induced CO2 recovery (using the chemical solvent Monoethanolamine (MEA)).24 Currently the use of chemical solvents for post-combustion capture systems offer high capture efficiency and selectivity, and the lowest energy use and costs compared to other existing capture technologies available for post-combustion capture.25 Figure 2.6 illustrates a typical chemical carbon dioxide absorption process for power plants in a flow diagram.
Figure 2.6: Process flow diagram of CO2 capture from flue gas by chemical absorption (Source: Metz / Davidson a. o., IPCC, Special Report on Carbon Dioxide Capture and Storage (2005), URL: http://www.ipcc.ch/pdf/special-reports/srccs/srccs_chapter3.pdf, [04.02.2011])
23
IPCC (2005, p. 114) 24
EEA - European Energy Agency (2008, p. 48) 25
Lukas Fritz 14 First of all the flue gas is brought in contact with a chemical solvent used in the absorber (e.g. MEA), where CO2 is bound by the solvent. This happens usually between 40 and 60°C. After the absorber a water wash section is required to balance water in the system and to remove any solvent droplets or solvent vapor carried over. As lower the remaining CO2 concentration in the flue gas as higher the absorption vessel needs to be. The CO2-enriched solvent is pumped to the top of a regeneration vessel (stripper), where the regeneration process of the solvent takes place at a temperature level between 100 and 140°C. For guaranteeing this temperature level in the stripper heat is supplied by the reboiler and this leads to a thermal energy penalty for the desorption process and removing the chemically bound CO2. Furthermore steam has to be added which acts as a stripping gas. The steam is recovered in the condenser and the CO2 product gas leaves the stripper. The recovered solvent is pumped back to the absorber vessel after passing a heat exchanger and a cooler to bring the temperature back to the level required in the absorber (40°C-60°C). 26 Before the flue gas is scrubbed of CO2 it has to contain very low concentrations of oxides of sulphur and nitrogen (NO2 and SOx) as they would react with the solvent (amine) and cause a steady loss of this chemical. The required SOx concentrations should be between 1 and 10 ppm(v). This results in an improvement of the flue gas treatment facilities for sulphur- and nitrogen oxides by using low NOx burners with selective catalytic reduction (SCR) and using proper flue gas desulphurization facilities.27 The key parameters determining the technical and economic operation of a post-combustion system using chemical absorption as capture technology are the following:
• Flue gas flow rate:
Determines the size of the absorber representing a substantial contribution to the overall cost • CO2 content in flue gas:
As flue gas is usually at atmospheric pressure the partial pressure of CO2 will be around 3 to 15kPa. Aqueous amines are the most suitable absorption solvents for these conditions
• CO2 removal:
In practice the recovery of CO2 is between 80% and 95%. Higher recovery rates would lead to a taller absorption column, higher energy penalties and hence to an increase of costs. The chosen recovery rate is therefore an economic trade-off.
26
IPCC (2005, p. 115) 27
Lukas Fritz 15 • Solvent flow rate:
With exception of the absorber the size of most equipment is determined by the solvent flow rate. Therefore the flow rate of the solvent is determined by the chosen CO2 concentrations within the lean and the rich solutions.
• Energy requirement:
The energy required for the process is the sum of thermal energy needed to regenerate the chemical solvent and the electrical energy consumed by the various pumps and the flue gas blower or fan.
• Cooling requirement:
To bring the flue gas and solvent temperatures down to the required levels for an efficient absorption of CO2 cooling is needed. Also the recovered product from the stripper requires cooling to recover the steam needed in the stripping process.28
At this point in time chemical solvents (amines) are mainly used for post-combustion capture due to the fact that chemical solvents are less dependent on partial pressure (partial pressure is very low for CO2) than physical solvents. Still, chemical solvents require – compared to steam – more energy to regenerate due to the strong chemical links between carbon dioxide and the solvent.29 Besides the commercially and currently preferred absorption technology used in post-combustion capture systems, also solid sorbents, membranes and cryogenic separation is under research and development. Studying other capture technologies aims to reduce the energy consumption and cost in the future.
Pre-combustion capture
Pre-combustion carbon capture systems can be applied for power plants using solid, gaseous or liquid combustion materials. In a first step the primary combustion material is turned into a synthesis gas (syngas) which consists out of hydrogen (H2) and carbon monoxide (CO). The production of the syngas is based on different processes depending on the physical state of the combustion material used. For gaseous and liquid fuels “Steam reforming” (1) (water steam is added) or “Partial oxidation” (2) (oxygen is added) is used and for solid fuels (coal or biomass) a “Gasification process” can be applied. The CO fraction of the syngas is converted into CO2 and H2 by applying a “Water-gas shift”
28
IPCC (2005, p. 115-116) 29
Lukas Fritz 16 reaction (3) in which steam is added. The following formulas illustrate the chemical reactions of the processes mentioned.30
Steam reforming
(1)
Partial oxidation
(2)
Water-gas shift reaction
(3)
Pre-combustion capture is usually used for natural gas fired power plants in gas turbine combined cycles (GTCC) or coal based plants. When using coal and the process applied is gasification, it is known as an integrated gasification combined cycle (IGCC). The target of the gasification process is high energy efficiency and a minimum of emissions to the environment.31 From the remaining CO2/H2 mixture, which has a CO2 concentration in the range of 15-60% (dry basis) and a total pressure of 2-7 MPa, the CO2 is removed.32 The pressure of the gas is compared to the atmospheric pressure of the flue gas in post-combustion capture systems much higher, which allows applying other capture technologies than MEA based solvent separation. This is confirmed by Herzog, who refers to the physical solvent process (like Selexol) as much less energy intensive than the MEA separation process, because carbon capture takes place from the high pressure syngas.33 Already table 2.1 refers to physical and chemical solvents as currently preferred separation technologies for pre-combustion capture systems.
Another separation option is the use of solid sorbents in pressure swing adsorption processes (PSA) or temperature swing adsorption (TSA). In steam reforming of natural gas and light hydrocarbons for hydrogen production, modern plants use a pressure swing adsorber (PSA). The hydrogen is separated from the other gases by adsorption in a set of switching beds contacting layers of solid adsorbents like activated carbon, alumina and zeolites. The purity of the H2 exiting the PSA is up to 99.999%. Still,
30
Costa (2009, p. 5-21) 31
IEA – International Energy Agency (2007a, p. 3) 32
IPCC (2005, p. 130) 33
Lukas Fritz 17 PSA has not yet reached a commercial stage for separating CO2 from flue gas.34 Intense research and development activities on PSA for CO2 separation show how promising this technology is considered to be in the future. Challenges lie in reducing the energy intensity of the process and to increase the CO2 capacity for adsorbents at elevated temperatures.
When applying gasification processes for coal-fired power plants a CCGT is used to combust the cleaned syngas. The gasification is basically a partial oxidation (see reaction (2)), although steam is also supplied to the reactor in most processes.35 Usually three different gasifiers can be used: fixed bed, fluidized bed or entrained flow gasifiers (pulverized). Before the combustion of the syngas in the turbine it has to be cleaned from impurities such as particles, tar, alkali-compounds, NH3, H2S, HCl and other chemical substances which can harm the installation. The condensation of tars has to be avoided in any part of the installation. Also sulfur and halogens compound abatement is an absolute necessity as the catalysts used in the installation are very sensitive to S and Cl. At present, none of the existing coal-fired IGCC plants is capturing CO2.36 The development of IGCC plants was initially driven by the prospects of exploiting continuing advances in gas turbine technology, the low levels of air-pollutant emissions due to the cleaned syngas, and greatly reduced process streams compared to flue gas streams at low pressure and diluted with nitrogen oxides from the combustion air in usual combustion processes. The deployment of IGCC plants is mainly restricted by the strong cost-competition with NGCC plants, the fact that they are not less costly than pulverized coal fired power plants and due to reliability concerns. 37 The decision for IGCC power plants will therefore be determined by the development of the gas/coal price ratio.
Oxyfuel combustion
In a common combustion process the primary material (coal, natural gas, biomass …) is combusted with air containing nitrogen. The high content of nitrogen in air (ca. 78% (v)) leads to the formation of nitrogen oxides (NOX) in large quantities and therefore huge flue gas streams which complicate to capture the carbon dioxide. An approach to reduce the flue gas stream is to use pure oxygen (O2) for the combustion process, resulting in a smaller flue gas stream which consists mainly out of CO2 and H2O (vapor). The oxygen used in the process has to be produced in an air separation unit, requiring 34 IPCC (2005, p. 119/131) 35 IPCC (2005, p. 132) 36
IEA – International Energy Agency (2007a, p. 3) 37
Lukas Fritz 18 energy and additional installation facilities resulting in increasing costs. This is confirmed by the Department of Energy (U.S), which speaks about challenges related to the currently high capital and operating costs of Air Separation Units. These expenditures are responsible for the major part of the costs in oxyfuel combustion technology. 38 Research and development aiming to reduce the costs of oxygen production will therefore be essential to make oxyfuel combustion more attractive and competitive with pre- and post-combustion carbon capture systems. This includes steady improvements of the cryogenic distillation process, which already led to a significant cost decrease in the past 10 years and investigation efforts for alternative oxygen supply processes such as membranes.39 Another challenge concerning oxyfuel combustion is the high combustion temperature due to the use of pure oxygen. The combustion of a fuel with pure oxygen leads to combustion temperatures of around 3500°C which is far too high for usually used power plant materials as the combustion temperature is limited to ca. 1300-1400°C for GTCC applications and ca. 1900°C in an oxyfuel coal-fired boiler considering the currently used technology. To overcome the problem of too high combustion temperatures a part of the flue gas and steam or liquid water is recycled back to the combustion chamber. The flue gas obtained from the combustion process has very high concentrations of CO2 and contains vapor which can be cooled to condense to water in its liquid form. The IPCC refers to typical CO2 concentrations between 80 and 98% after condensing the water vapor, depending on the fuel used and the particular oxyfuel combustion process applied.40 Still, the NOx content of the flue gas can not be reduced down to zero due to the nitrogen entering with the combustion material (chemical bound) and air infiltration. Furthermore the flue gas will contain mercury (Hg), unburned hydrocarbons and SOx. Assuming that those trace species do not interfere with the sequestration process and are below certain levels, co-sequestration is possible and therefore no further controlling or scrubbing of these exhaust effluents is needed.41 A possible co-sequestration depends on the interference with the storage side, the legal aspects of sequestrating hazardous and toxic materials (like Hg) and possible damages to installations such as pipelines (corrosion). The physical properties and chemical composition of the gas required for transportation and sequestration will be discussed further in the following chapters. Also Herzog confirms that NOx and SO2 tolerant sinks do not need separate control steps and NOx and SO2 can be sequestrated along with the CO2, resulting in a “zero emissions” power plant.42 The CO2 captured by oxyfuel combustion systems is close to 100%. The International 38 DOE/NETL (2007, p. 19) 39 DOE/NETL (2007, p. 19) 40 IPCC (2005, p. 122) 41 DOE/NETL (2007, p. 18) 42 Herzog (1999a, p. 3)
Lukas Fritz 19 Energy Agency refers to 90-97%, which is compared to pre- and post combustion capturing systems (85-90%) significantly higher.43 Oxyfuel combustion is at the time being at an early stage of development but integrated pilot power plants are being built and plans for commercial power plants using oxyfuel combustion are at an advanced stage.44
2.2 Compression and dehydration of carbon dioxide
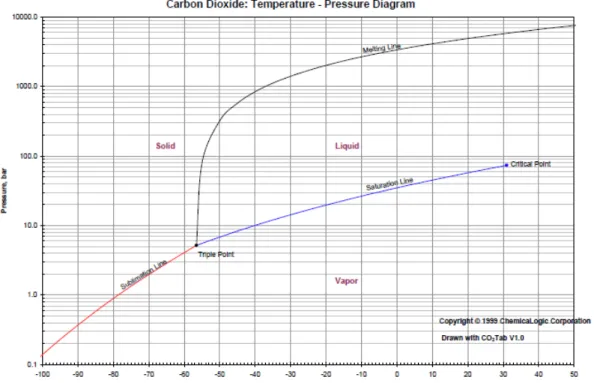
For discussing the challenges related to the dehydration and compression of CO2 it is necessary to describe the general physical properties of carbon dioxide. Carbon dioxide is composed by the chemical elements carbon (C) and oxygen (O) and therefore more dense than air. Very high concentrations of CO2 can be dangerous to human beings and animals. In very small quantities it is present in our atmosphere (ca. 370ppmv)45 and this concentration in our atmosphere is increasing. The physical state of CO2 depends on its temperature and pressure as it is the case for any other chemical element. This variation of the physical state is illustrated below in figure 2.7 in a phase diagram.
Figure 2.7: Phase diagram of carbon dioxide (Source: ChemicaLogic Corporation, 99 South Bedford Street, Suite 207, Burlington, MA 01803, USA, URL:
http://www.chemicalogic.com/download/co2_phase_diagram.pdf [10.03.2011])
43
IEA – International Energy Agency (2007a, p. 8) 44
IEA – International Energy Agency (2007a, p. 4) 45
Lukas Fritz 20 As observed in the diagram above CO2 is a gas at normal temperature and pressure. At very low temperatures CO2 can have solid state (ca. -78°C for atmospheric pressure). Taking the triple point as basis (T= -56.5°C / p=5.18bar) CO2 can be turned into vapor (gaseous state) by decreasing its pressure and/or increasing its temperature. At a temperature between the triple point temperature (-56.5°C) and the critical point temperature (31.1°C) an increase of pressure (compression) above the saturation line will turn CO2 into a liquid. To guarantee that the heat produced by the gas-compression doesn’t exceed the critical point temperature the heat has to be removed. Temperatures above the critical point temperature at a pressure higher than the critical point pressure (73.9bar) lead to CO2 in a supercritical state in which it behaves as a gas. This results in a very large density of carbon dioxide, approaching or even exceeding the density of liquid water. The behavior of CO2 in supercritical state is particularly relevant for its storage.46
Before compressing the carbon dioxide, remaining impurities (NOx/SOx) and water have to be removed to avoid any damage of the transportation system (e.g. pipelines) due to corrosion and/or hydrate formation. For oxy-fuel combustion and pre-combustion capture systems cryogenic distillation columns can be used to remove NOx and SOx impurities. Along with the removal of SO2 and SO3 as sulfuric acid also almost half of the remaining H2O content in the flue gases is removed. In a low temperature processing unit the remaining oxygen, argon and nitrogen impurities can be removed close to the carbon dioxide triple point temperature. In this cooling process two process streams are produced: capture-ready carbon dioxide and an exhaust stream consisting mostly of inert gases.47 For CO2 streams from post-combustion capture systems in which solvent based scrubbing processes are usually applied, the concentration of impurities is very low and many of the existing post-combustion capture plants produce high purity CO2 for use in the food industry.48
To make capture-ready carbon dioxide stream after capturing from the power plant suitable for transport it has to be compressed from atmospheric pressure (ca. 1013mbar) up to a final pressure of around 150bar. At its final pressure carbon dioxide is either in liquid form or in “dense phase” regions, depending on the temperature. Somewhere between the initial and final pressure CO2 undergoes a phase transition. In the gas phase a compressor is needed for compression, but in the liquid/dense phase the pressure can be further increased by a pump. The so called “cut-off” pressure, where the 46 IPCC (2005, p. 385) 47 Hong (2009, p. 11-12) 48 IPCC (2005, p. 142))
Lukas Fritz 21 compression process shifts from the compressor to the pump, represents the critical point pressure of CO2 (73.9bar).49 To compress carbon dioxide energy (electricity) is required. Typically pressurization needs around 0.22 GJ to 0.5 GJ of electricity per tone of CO2.50 This translates into a reduction of overall energy efficiency and results in additional costs.
2.3 Carbon dioxide transportation systems
To link the LPS of carbon dioxide with its sink a proper transportation system, depending on the transportation distance, the sink location, availability and costs, has to be found. The transportation systems under consideration in this chapter are: pipelines, ships and tanks. Also the IPCC considers in its special report about CCS these three systems as commercial-scale transport systems for liquid and gaseous carbon dioxide.51 As already mentioned in chapter 2, carbon dioxide can either be transported in solid, liquid or gaseous state. Still, at the time carbon dioxide is mainly transported with pipeline systems as they are considered to be a mature technology and usually the most efficient one. Transportation via railway and road tankers is not explained further in this chapter as it is unlikely that they are attractive options for large-scale carbon dioxide transport from source to sink.52
2.3.1 Pipeline transportation systems
Pipeline based transportation of carbon dioxide is considered to be a mature technology and long-time experience makes this technology the leading technology in transporting CO2. Worldwide already more than 2591km of pipelines transporting carbon dioxide are in operation – most of them in the U.S., where they carry 50Mt of CO2 per year from natural sources to EOR projects in the west of Texas and elsewhere.53 As already referred before, the concentration of impurities contained in the transported carbon dioxide can have great influence on the pipeline system due to corrosion. Therefore the concentrations of impurities need to be low enough to avoid the problem of corrosion and to ensure a long lifetime of the pipeline system used to transport CO2 from its source to the sink. Dry carbon dioxide with a relative humidity below 60% does not corrode the carbon-manganese steels usually used for pipelines. This conclusion also applies for other impurities than H2O - like N2, NOx
49
McCollum (2006, p. 2) 50
IEA – International Energy Agency (2008, p. 65) 51 IPCC (2005, p. 181) 52 IPCC (2005, p. 181) 53 IPCC (2005, p. 181-182)
Lukas Fritz 22 and SOx contaminants. Especially a low-nitrogen content is required if the captured and transported CO2 is used for EOR and a low H2S contents for transportation of carbon dioxide through more populated areas.54 Therefore the purity requirements for carbon dioxide are as well related to the storage side and security requirements for human beings, flora and fauna.
2.3.2 Ship transport of carbon dioxide
The second option to transport carbon dioxide is the maritime way by ship. In case that the source of carbon dioxide isn´t directly at the coastline or on riverside, also ship transport will involve pipelines as a primary transportation medium to the shore, where the carbon dioxide can be stored temporary until the ship brings it to its final destination (onshore or offshore). As many CO2 large point sources in the power sector are close to the riverside and as they are using the river for cooling purpose, ship transport can be an option if no pipeline system is available. The IPCC refers in its special report about CCS, that CO2 transportation by ship has a number of similarities to liquefied petroleum gas (LPG) transportation by ship and that also three types of tank structure for liquid gas transport ships (as for LPG and LNG) are used: pressure type, low-temperature type and semi-refrigerated type.55 As mentioned before, in some cases CO2 transportation by ship can have advantages compared to pipelines as a transport medium. This is confirmed by an IEA-study, carried out by the Mitsubishi Heavy Industries Ltd in Japan, where CO2 transport by ship is considered to be less costly in some circumstances and that the use of some storage sides could be enabled which might not be easily accessed by pipelines.56 However, at the time pipelines are the common mediums used to transport carbon dioxide from its source to the sink as it is always captured on land, but in some circumstances (depending on the available transportation systems, source-sink distance, location of the sink, CO2 quantities…) transportation by ship could be the option to favor.
2.4 Carbon dioxide storage
In the following chapter the different options for long-time storage of carbon dioxide, which has been captured at LPS of the power sector and transported to the storage side, are described. For carbon dioxide a primary differentiation between the main storage possibilities has to be made: CO2 can either be stored in underground geological storage sides, in the ocean or stored by industrial fixation.
54 IPCC (2005, p. 181) 55 IPCC (2005, p. 186) 56 IEA GHG (2004, p. i)


![Figure 2.9: Injection of CO 2 for EOR (Source: Metz / Davidson a. o., IPCC, Special Report on Carbon Dioxide Capture and Storage (2005), URL: http://www.ipcc.ch/pdf/special-reports/srccs/srccs_chapter3.pdf, [16.03.2011])](https://thumb-eu.123doks.com/thumbv2/123dok_br/18460852.898221/38.892.269.608.322.602/figure-injection-source-davidson-special-dioxide-capture-storage.webp)