3D image reconstruction for a dual plate positron emission tomograph: application to mammography
249
0
0
Texto
(2) ii.
(3) Universidade de Lisboa Faculdade de Ciˆencias Departamento de F´ısica. 3D Image Reconstruction for a Dual Plate Positron Emission Tomograph: Application to Mammography. M´onica Vieira Martins. Thesis supervised by Prof. Doutor Pedro Dinis de Almeida Instituto de Biof´ısica e Engenharia Biom´edica Faculdade de Ciˆencias da Universidade de Lisboa Doutoramento em Biof´ısica 2007.
(4)
(5) Contents Resumo. xi. Abstract. xv. Acknowledgments. I. xvii. Introduction. 1. 1 Introduction. 3. II. 7. Background. 2 Breast Cancer Imaging. 9. 2.1. Introduction . . . . . . . . . . . . . . . . . . . . . . . . . . . . . . . . . .. 9. 2.2. X-ray Mammography . . . . . . . . . . . . . . . . . . . . . . . . . . . . .. 11. 2.3. Breast Ecography . . . . . . . . . . . . . . . . . . . . . . . . . . . . . . .. 12. 2.4. Magnetic Resonance Imaging . . . . . . . . . . . . . . . . . . . . . . . .. 13. 2.5. Scintimammography . . . . . . . . . . . . . . . . . . . . . . . . . . . . .. 15. 2.6. Positron Emission Tomography . . . . . . . . . . . . . . . . . . . . . . .. 16. 2.7. Conclusions . . . . . . . . . . . . . . . . . . . . . . . . . . . . . . . . . .. 18. 3 Positron Emission Mammography. 19. 3.1. Introduction . . . . . . . . . . . . . . . . . . . . . . . . . . . . . . . . . .. 19. 3.2. Positron emission and detection . . . . . . . . . . . . . . . . . . . . . . .. 20. 3.3. The performance of a scanner . . . . . . . . . . . . . . . . . . . . . . . .. 20. 3.3.1. Photon sensitivity . . . . . . . . . . . . . . . . . . . . . . . . . .. 21. 3.3.2. Spatial resolution . . . . . . . . . . . . . . . . . . . . . . . . . . .. 22. 3.3.3. Energy Resolution . . . . . . . . . . . . . . . . . . . . . . . . . .. 23. 3.3.4. Time resolution . . . . . . . . . . . . . . . . . . . . . . . . . . . .. 24. 3.3.5. Photodetectors . . . . . . . . . . . . . . . . . . . . . . . . . . . .. 24. v.
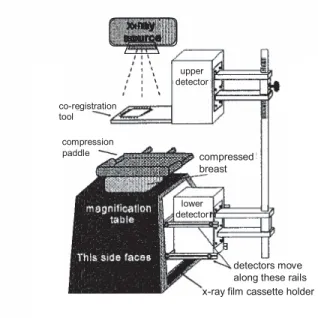
(6) 3.4. 3.5. Dedicated scanners for breast imaging . . . . . . . . . . . . . . . . . . .. 25. 3.4.1. The PEM-I system . . . . . . . . . . . . . . . . . . . . . . . . . .. 25. 3.4.2. The Naviscan PEM Flex system . . . . . . . . . . . . . . . . . .. 27. 3.4.3. The West Virginia University - Jefferson Lab PEM system. . . .. 29. 3.4.4. The Duke University - Jefferson Lab PEM system . . . . . . . .. 30. 3.4.5. The maxPET system . . . . . . . . . . . . . . . . . . . . . . . . .. 31. 3.4.6. The LNBL PEM system . . . . . . . . . . . . . . . . . . . . . . .. 31. 3.4.7. The YAP-PEM system . . . . . . . . . . . . . . . . . . . . . . . .. 32. Conclusions . . . . . . . . . . . . . . . . . . . . . . . . . . . . . . . . . .. 33. 4 Image Reconstruction in PET 4.1. Introduction . . . . . . . . . . . . . . . . . . . . . . . . . . . . . . . . . .. 35. 4.2. Organizing the data . . . . . . . . . . . . . . . . . . . . . . . . . . . . .. 36. 4.3. Statistical Iterative Reconstruction Algorithms . . . . . . . . . . . . . .. 39. 4.3.1. A model for the image . . . . . . . . . . . . . . . . . . . . . . . .. 39. 4.3.2. A model for the physics of the measurement process . . . . . . .. 40. 4.3.3. A model for the data . . . . . . . . . . . . . . . . . . . . . . . . .. 41. 4.3.4. An objective function . . . . . . . . . . . . . . . . . . . . . . . .. 42. 4.3.5. A numerical algorithm . . . . . . . . . . . . . . . . . . . . . . . .. 46. Expectation-Maximization Algorithms . . . . . . . . . . . . . . . . . . .. 47. 4.4.1. ML-EM . . . . . . . . . . . . . . . . . . . . . . . . . . . . . . . .. 47. 4.4.2. OS-EM . . . . . . . . . . . . . . . . . . . . . . . . . . . . . . . .. 50. Bayesian iterative algorithms . . . . . . . . . . . . . . . . . . . . . . . .. 51. 4.5.1. Defining a prior . . . . . . . . . . . . . . . . . . . . . . . . . . . .. 51. 4.5.2. The One Step Late algorithm . . . . . . . . . . . . . . . . . . . .. 53. 4.5.3. The Median Root Prior . . . . . . . . . . . . . . . . . . . . . . .. 54. Conclusions . . . . . . . . . . . . . . . . . . . . . . . . . . . . . . . . . .. 55. 4.4. 4.5. 4.6. III. 35. Materials and Methods. 57. 5 The Clear-PEM scanner and Monte Carlo simulations. 59. 5.1. Introduction . . . . . . . . . . . . . . . . . . . . . . . . . . . . . . . . . .. 59. 5.2. The Clear-PEM scanner . . . . . . . . . . . . . . . . . . . . . . . . . . .. 59. 5.3. Monte Carlo Simulations . . . . . . . . . . . . . . . . . . . . . . . . . . .. 61. 5.3.1. Clear-PEM Monte Carlo simulation framework . . . . . . . . . .. 62. 5.3.2. The simulated scanner geometries. . . . . . . . . . . . . . . . . .. 63. 5.3.3. The Phantoms used . . . . . . . . . . . . . . . . . . . . . . . . .. 64. 5.4. Planes of the breast . . . . . . . . . . . . . . . . . . . . . . . . . . . . .. 67. 5.5. Conclusion. 68. . . . . . . . . . . . . . . . . . . . . . . . . . . . . . . . . . ..
(7) 6 The STIR library 6.1. Introduction . . . . . . . . . . . . . . . . . . . . . . . . . . . . . . . . . .. 69. 6.2. Images . . . . . . . . . . . . . . . . . . . . . . . . . . . . . . . . . . . . .. 70. 6.2.1. 70. 6.3. Image Coordinates and Conventions . . . . . . . . . . . . . . . .. Projection Data 6.3.1. . . . . . . . . . . . . . . . . . . . . . . . . . . . . . . .. 74. Projection operators . . . . . . . . . . . . . . . . . . . . . . . . . . . . .. 74. 6.4.1. Projection Matrix By Bin Hierarchy . . . . . . . . . . . . . . . .. 74. 6.4.2. Forward Projection Hierarchy . . . . . . . . . . . . . . . . . . . .. 75. 6.4.3. Backprojection Hierarchy . . . . . . . . . . . . . . . . . . . . . .. 77. 6.5. Geometrical Symmetries . . . . . . . . . . . . . . . . . . . . . . . . . . .. 82. 6.6. Image Reconstruction Algorithms . . . . . . . . . . . . . . . . . . . . . .. 83. 6.6.1. The OSMAPOSL algorithm . . . . . . . . . . . . . . . . . . . . .. 84. 6.6.2. The sensitivity image . . . . . . . . . . . . . . . . . . . . . . . .. 86. 6.6.3. The MAP model and priors . . . . . . . . . . . . . . . . . . . . .. 86. Conclusions . . . . . . . . . . . . . . . . . . . . . . . . . . . . . . . . . .. 87. 6.7. Projection Data Coordinates and Conventions. 71. . . . . . . . . . .. 6.4. IV. 69. Results. 89. 7 Enhancements in the STIR framework. 91. 7.1. Introduction . . . . . . . . . . . . . . . . . . . . . . . . . . . . . . . . . .. 91. 7.2. The information on the projection data . . . . . . . . . . . . . . . . . .. 91. 7.2.1. The class ProjDataInterfile . . . . . . . . . . . . . . . . . . . . .. 92. 7.2.2. The class ProjDataInfoPlanar . . . . . . . . . . . . . . . . . . . .. 92. 7.2.3. Building the sinogram header . . . . . . . . . . . . . . . . . . . .. 96. 7.2.4. Computing the sinogram indexes . . . . . . . . . . . . . . . . . .. 98. 7.2.5. Dealing with the DOI information . . . . . . . . . . . . . . . . .. 99. 7.3. The projection operators for Clear-PEM . . . . . . . . . . . . . . . . . . 100. 7.4. The geometrical symmetries . . . . . . . . . . . . . . . . . . . . . . . . . 101. 7.5. The test utilities . . . . . . . . . . . . . . . . . . . . . . . . . . . . . . . 102. 7.6. Preliminary Evaluation. 7.7. . . . . . . . . . . . . . . . . . . . . . . . . . . . 102. 7.6.1. Number of Subsets . . . . . . . . . . . . . . . . . . . . . . . . . . 105. 7.6.2. Number of rays to trace each bin . . . . . . . . . . . . . . . . . . 111. 7.6.3. Geometrical Symmetries . . . . . . . . . . . . . . . . . . . . . . . 116. 7.6.4. One angular detector plates position . . . . . . . . . . . . . . . . 121. Conclusions . . . . . . . . . . . . . . . . . . . . . . . . . . . . . . . . . . 122.
(8) 8 3D OS-EM image reconstruction for the Clear−PEM scanner 8.1 Introduction . . . . . . . . . . . . . . . . . . . . . . . . . . . . . . 8.2 Simplified Scanner Geometry Studies . . . . . . . . . . . . . . . . 8.2.1 Methods . . . . . . . . . . . . . . . . . . . . . . . . . . . . 8.2.2 Results . . . . . . . . . . . . . . . . . . . . . . . . . . . . 8.2.3 Discussion . . . . . . . . . . . . . . . . . . . . . . . . . . . 8.3 Effect of DOI information and rotation . . . . . . . . . . . . . . . 8.3.1 Methods . . . . . . . . . . . . . . . . . . . . . . . . . . . . 8.3.2 Static Simulated Acquisition . . . . . . . . . . . . . . . . 8.3.3 Dual Angle Simulated Acquisition . . . . . . . . . . . . . 8.3.4 Discussion . . . . . . . . . . . . . . . . . . . . . . . . . . . 8.4 Studies with the NCAT phantom . . . . . . . . . . . . . . . . . . 8.4.1 The sensitivity image . . . . . . . . . . . . . . . . . . . . 8.4.2 Methods . . . . . . . . . . . . . . . . . . . . . . . . . . . . 8.4.3 Results . . . . . . . . . . . . . . . . . . . . . . . . . . . . 8.4.4 Discussion . . . . . . . . . . . . . . . . . . . . . . . . . . . 8.5 Conclusions . . . . . . . . . . . . . . . . . . . . . . . . . . . . . . 9 Bayesian Image Reconstruction for 9.1 Introduction . . . . . . . . . . . . . 9.2 Methods . . . . . . . . . . . . . . . 9.3 Results . . . . . . . . . . . . . . . . 9.3.1 Chain Phantom . . . . . . . 9.3.2 NCAT Breast Phantom . . 9.4 Conclusions . . . . . . . . . . . . .. V. the Clear−PEM Scanner . . . . . . . . . . . . . . . . . . . . . . . . . . . . . . . . . . . . . . . . . . . . . . . . . . . . . . . . . . . . . . . . . . . . . . . . . . . . . . . . . . . . . . . . . . . . . . . . . . . . . .. Main Conclusions and Future Work. . . . . . . . . . . . . . . . .. . . . . . .. . . . . . . . . . . . . . . . .. . . . . . .. . . . . . . . . . . . . . . . .. . . . . . .. . . . . . . . . . . . . . . . .. 123 123 123 124 124 126 129 130 130 140 146 150 150 152 153 162 163. . . . . . .. 167 167 167 168 168 169 186. 191. 10 Main Conclusions and Future Work. 193. A Publications. 201. Bibliography. 215.
(9) To Paulo, Francisco, J´ ulia and to the little one who is already on her way. To all the women who will eventually benefit from some of the work presented here..
(10)
(11) Resumo A imagiologia ´e um campo do conhecimento humano capaz de unir diversas a´reas cient´ıficas em torno de objectivos comuns: f´ısica, engenharia, matem´ atica, bioqu´ımica, ciˆencias m´edicas. Ao longo do u ´ltimo s´eculo, a imagiologia dotou a humanidade de uma plˆeiade de ferramentas que tˆem contribu´ıdo de forma decisiva para a compreens˜ ao do funcionamento do corpo humano. Entre outras aplica¸c˜oes, essas ferramentas s˜ao utilizadas como meios (praticamente) n˜ao invasivos de diagn´ ostico e estadiamento de doen¸cas, assim como de planeamento e avalia¸c˜ao de terapias. A imagiologia do cancro da mama ´e um bom exemplo de como os v´arios m´etodos de imagem m´edica podem contribuir de forma decisiva para a diminui¸c˜ao do impacto de uma doen¸ca de elevadas incidˆencia e mortalidade. A mamografia de raios-X ´e a t´ecnica imagiol´ogica mais utilizada no rastreio e avaliao imagiol´ ogica no caso do cancro da mama. Outros m´etodos, como a Ecografia mam´aria ou a Imagem de Ressonˆancia Magn´etica da mama, s˜ao importantes t´ecnicas adjuvantes da mamografia por raios-X. No entanto, a informa¸c˜ao fornecida pelas t´ecnicas acima mencionadas ´e essencialmente de natureza anat´ omica. As altera¸c˜oes anat´omicas e morfol´ogicas s˜ao precedidas por altera¸c˜oes funcionais. Assim, t´ecnicas imagiol´ogicas que forne¸cam informa¸c˜ao complementar sobre altera¸c˜oes funcionais e metab´ olicas dos tecidos, como a Tomografia por Emiss˜ao de Positr˜ oes (TEP) ou a Cintimamografia podem tamb´em contribuir para a diminui¸c˜ao da morbilidade e mortalidade associada a esta doen¸ca. Estas t´ecnicas, no entanto, s˜ao especialmente direccionadas para exames de corpo inteiro, pelo que possuem uma sensibilidade limitada para a detec¸c˜ao de pequenos tumores na mama. De facto, estudos cl´ınicos indicam que a TEP possui uma baixa sensibilidade para a detectac¸c˜ao de les˜oes mam´arias com menos de 1 cm. Neste contexto assistiu-se, nos u ´ ltimos anos, a um esfor¸co significativo no sentido de desenvolver sistemas de imagem comnpactos e dedicados `a detec¸c˜ao de cancro da mama baseadas nas t´ecnicas de Cintigrafia ou de TEP. Em especial, a t´ecnica denominada Mamografia por Emiss˜ao de Positr˜ oes (MEP) ambiciona obter imagens da mama com instrumentos dedicados utilizando tra¸cadores marcados com emissores de positr˜oes. Um dos intrumentos MEP em desenvolvimento ´e a cˆamara Clear-PEM. Este sistema, xi.
(12) que na altura de finaliza¸c˜ao deste trabalho se encontra em fase de montagem, foi projectado com o objectivo de ser um equipamento de elevadas resolu¸c˜ao e sensibilidade, capaz de detectar pequenas les˜ oes presented na glˆ andula mam´ aria. O sistema ´e constitu´ıdo por duas placas de detec¸c˜ao com capacidade para realizar aquisi¸c˜oes em v´arias posi¸c˜oes em torno da mama da paciente e, adicionalmente, realizar um exame axilar complementar. O sistema possuir´a a capacidade de medir a profundidade de interac¸c˜ao da radia¸c˜ao nos cristais detetores, uma medida conhecida por DOI (acr´onimo do termo inglˆes Depth of Interaction) que ´e fundamental para a obten¸c˜ao de uma resolu¸c˜ao espacial elevada e isotr´opica. Resultados experimentais indicam que dever´a ser poss´ıvel obter uma resolu¸c˜ao em DOI para a cˆamara Clear-PEM da ordem de 2 mm FWHM. De entre os v´arios componentes que contribuem para o desempenho de um sistema de imagem MEP encontram-se os m´etodos utilizados para realizar a reconstru¸c˜ao de imagem a partir dos dados de projec¸c˜ao adquiridos pelo sistema. O objectivo do trabalho apresentado nesta tese era o desenvolvimento e caracteriza¸c˜ao de software de reconstru¸c˜ao tridimensional de imagem para a cˆ amara Clear-PEM. Para esse efeito, foram abordadas quest˜oes tais como a enorme quantidade de dados a ser processados, a complexidade associada a m´etodos 3D de reconstru¸c˜ao de imagem, o facto da geometria de aquisi¸c˜ao ser bastante diferente da geometria das cˆamaras TEP convencionais e a necessidade de incorporar no processo de reconstru¸c˜ao de imagem a informa¸c˜ao DOI fornecida pelo equipamento. A biblioteca open-source de reconstru¸c˜ao de imagem STIR, originalmente desenvolvida para as cˆamaras TEP convencionais, de geometria cil´ındrica, foi utilizada como base para os m´etodos 3D de reconstru¸c˜ao de imagem para a cˆ amara Clear-PEM. A estrutura modular da biblioteca, escrita em linguagem de programa¸c˜ao C++, permitiu a incorpora¸c˜ao de novas classes e m´etodos adequados a` geometria de amara em estudo. O m´etodo tradicional de histogramiza¸c˜ao aquisi¸c˜ao particular da cˆ dos dados em formato sinograma 3D foi adaptado para os dados adquiridos pela cˆ amara Clear-PEM. O teste e a valida¸c˜ao inicial das novas ferramentas introduzidas na biblioteca de reconstru¸c˜ao de imagem foram efectuados com recurso a dados simulados por m´etodos de Monte Carlo e por m´etodos anal´ıticos, com fˆantomas geom´etricos simples. As imagens foram reconstru´ıdas com o algoritmo iterativo estat´ıstico OS-EM, ap´os optimiza¸c˜ao do mesmo. Os resultados obtidos demonstraram a capacidade de reconstruir imagens em acordo visual com os objectos simulados, com elevada resolu¸c˜ao espacial e caracter´ısticas de ru´ıdo em concordˆ ancia com o simulado e com o algoritmo iterativo estat´ıstico utilizado. As ferramentas de reconstru¸c˜ao de imagem desenvolvidas e optimizadas foram utilizadas para estudar o impacto da resolu¸c˜ao DOI e da aquisi¸c˜ao em duas posi¸c˜oes angulares das placas por oposi¸c˜ao a` aquisi¸c˜ao com as placas de detec¸c˜ao numa u ´nica posi¸c˜ao angular. Para esse efeito utilizaram-se dados simulados por Monte Carlo de fontes pontuais colocadas em diferentes pontos do campo de vis˜ ao da cˆ amara.
(13) (FOV, acr´ onima da express˜ ao inglesa Field of View). Como seria de esperar, os resultados obtidos indicam que a aquisi¸c˜ao em posi¸c˜ao u ´nica das placas resulta em artefactos significativos nas imagens quando ´e considerada uma resolu¸c˜ao em DOI baixa ou inexistente. Esses artefactos s˜ao significativamente reduzidos nas regi˜ oes pr´oximas do centro da FOV quando se considera 2 mm FWHM DOI (o valor expect´ avel para a cˆ amara Clear-PEM) ou um valor ideal correspondendo a informa¸c˜ao DOI exacta. Quando se considera a aquisi¸c˜ao em dupla posi¸c˜ao angular das placas de detec¸c˜ao e o valor de 2 mm FWHM DOI , n˜ ao se verifica a existˆencia de artefactos nas imagens. No entanto, a evolu¸c˜ao irregular da resolu¸c˜ao espacial medida em fontes pr´ oximas da periferia da FOV com o processo iterativo parece indicar que, nessas regi˜ oes da FOV, a qualidade da imagem teria a ganhar com aquisi¸c˜ao de dados em posi¸c˜oes adicionais das placas de detec¸c˜ao. Globalmente, os resultados obtidos indicam que, considerando a aquisi¸c˜ao em duas posi¸c˜oes perpendiculares das placas e o valor de resolu¸c˜ao em DOI que se espera para a cˆ amara Clear-PEM, a resolu¸c˜ao espacial das imagens ´e 1.3×1.3×1.3 mm3 no centro do campo de vis˜ao da cˆamara e 1.5×1.8×2.0 mm3 a 1 cm da periferia da FOV da cˆ amara. A capacidade de reconstruir imagens e de detectar les˜oes em condi¸c˜oes mais realistas e pr´oximas do cen´ario de um exame real foram avaliadas recorrendo a simula¸c˜oes de Monte Carlo. Nessas simula¸c˜oes foi utilizado um fˆ antoma antropom´ orfico da mama contendo les˜oes modeladas como estruturas esf´ericas de diˆ ametros vari´aveis entre 3 mm e 10 mm. Os valores de fixa¸c˜ao de radiof´ armaco considerados para os tecidos mam´arios (que n˜ ao les˜oes) foram obtidos da literatura e corresponderam aos diferentes tipos de glˆ andulas mam´arias As imagens foram reconstru´ıdas utilizando quer o algoritmo OS-EM quer o algortimo iterativo estat´ıstico Bayeseano OS-MAP-OSL com o Median Root Prior. Os resultados obtidos demostram que o algoritmo OS-EM permite obter imagens de elevado contraste, embora com valores de raz˜ao sinal sobre ru´ıdo relativamente baixos para les˜oes localizadas pr´oximo da parede tor´ axica. A utiliza¸c˜ao do algoritmo Bayseano permite controlar de forma mais eficaz o ru´ıdo produzido nas imagens no decorrer do processo iterativo. Consequentemente, os valores da raz˜ao sinal sobre ru´ıdo s˜ ao mais elevados nestas imagens, por compara¸c˜ao com as obtidas com o OS-EM, embora com valores mais baixos de contraste entre as les˜oes e os tecidos adjacentes. Globalmente, os resultados da reconstru¸c˜ao indicam que dever´ a ser poss´ıvel visualizar les˜ oes de 3 mm em glˆandulas mam´arias consitu´ıdas essencialmente por tecido adiposo e de 5 mm em glˆandulas mam´arias ricas em tecido fibroglandular denso. Em conclus˜ ao, o software para reconstru¸c˜ao 3D de imagem apresentado nesta tese contribuiu para a avalia¸c˜ao do desempenho esperado da cˆ amara Clear-PEM, dedicada `a imagem da glandula mam´ aria. Espera-se que possa tamb´em vir a contribuir para o.
(14) bom desempenho da cˆ amara em ambiente cl´ınico.. Palavras Chave: Cancro da mama; Tomografia por Emiss˜ao de Positr˜ oes; Geometria Planar em Medicina Nuclear; Algoritmos 3D de Reconstru¸c˜ao de Imagem; Algoritmos Iterativos Estat´ısticos..
(15) Abstract The Clear-PEM scanner is a compact, dedicated, dual plate positron emission tomograph that is being developed for imaging the breast. This scanner has been designed to be a high sensitivity, high resolution instrument, able to detect small breast cancerous lesions at an early stage of the disease. The scanner will acquire data using two detector plates at two perpendicular angular positions around the breast. It will be able to measure the Depth-of-Interaction (DOI) of the photons within the detector crystal with a foreseen resolution of 2mm FWHM. The work presented in this thesis deals with 3D image reconstruction for the Clear-PEM scanner. A number of issues such as the unconventional nature of the acquisition geometry, the incorporation of the DOI information in the reconstruction process, the large amount of data to be processed and the complexity of 3D image reconstruction were addressed in this thesis. The STIR library, an open-source image reconstruction library, originally developed for conventional Positron Emission Tomography ring scanners was used as the basis for 3D image reconstruction of the Clear-PEM scanner. The modular structure of the library allowed incorporating classes and methods adequate to the particular geometry under study. The validation and optimization of the enhanced library was performed with geometrical phantom Monte Carlo(MC) and analytical simulated data and with the 3D OSEM algorithm available in STIR. The results obtained indicate that, with the tuned 3D image reconstruction algorithm the image spatial resolution is expected to be 1.3×1.3×1.3mm3 in the Field-of-View (FOV) center and 1.5×1.8×2.0mm3 at 1cm from the FOV edge. The ability to reconstruct data acquired in a realistic, clinical scenario was tested with MC simulated data of an anthropomorphic breast phantom. Images were reconstructed both with the OS-EM algorithm and with a Bayesian algorithm. The results obtained show that the OS-EM algorithm allows obtaining high contrast images, albeit with low signal-to-noise ratio values in lesions located near the chest wall. The use of a Bayesian algorithm allows improving the signal-to-noise ratio, albeit resulting in lower contrast images. Globally, the results indicate the possibility of visualizing 3mm diameter lesions in essentially fat tissue breasts and 5mm diameter lesion in dense fibroglandular breasts. xv.
(16) Keywords: Breast Cancer; Positron Emission Tomography; Dual Plate Geometry Scanners in Nuclear Medicine; 3D Image Reconstruction; Iterative Statistical Algorithms..
(17) Acknowledgments The work presented in this document is the result of many individual working hours but also, and probably more significantly, of the interaction with so many teachers, co-workers, colleagues and friends. I would like to express my gratitude to those who have contributed to this work: - To Professor Pedro Almeida who has introduced me to the field of Nuclear Medicine and who has supervised my investigation work and the writing of this thesis. I want to thank him not only for the scientific advisement and guidance but also for his support, generosity and patience. His words of trust and encouragement throughout these years were very meaningful. His enthusiasm, creativity and long working hours toward new ideas and projects are an inspiration and an example to me. - To Professor Eduardo Ducla-Soares, who, with his contagious enthusiasm and never ending good humor, introduced me to the fascinating world of biophysics, and who, since then, has never saved acts nor words of encouragement. - To Professor Jo˜ ao Varela, who is the soul of the Clear-PEM project and who consequently has contributed significantly for the work here presented. If he did not had the courage to initiate this project, this work would certainly not have been possible. His coordination, scientific and human skills are an example to me. - To Professor Christian Morel, who has welcomed me at the PET Instrumentation Group at the Institute for High Energy Physics (IPHE) of the University of Lausanne in the distant beginning of my PhD, and who has guided my first steps with the STIR library. - To the colleagues I had the luck to find at IPHE, specially Daniel Strul, Luc Simon, Giovanni Santin, Magalit Krueger and Jean-Baptiste Mosset. - To the colleagues at LIP - Laborat´orio de Instrumenta¸c˜ao e Part´ıculas, Pedro Rodrigues and Andreia Trindade, who have developed the Monte Carlo simulation framework and produced the data that was used in this work. xvii.
(18) - A very special thanks goes to the colleagues from IBEB that made part of the team that worked in the context of the image reconstruction and visualization software for the Clear−PEM scanner, namely Nuno Matela, Nuno Oliveira, Hugo Cordeiro and Marta Correia. Besides the richness that arouse from sharing common scientific questions, your constant good moods and good humor have greatly helped throughout these years. - To Nuno Matela I am deeply thankful to the many elucidating discussions regarding image reconstruction issues, as well as the unmeasurable help on other scientific and practical questions. You really are a great working fellow! - To Nuno Oliveira I must thank the visualization and image analysis tool he has developed. Many of the laborious procedures used to analyze the images for this work were made infinitely easier thanks to Quasimanager, formerly known as Quasianalyst. - To my IBEB colleagues who also work in the field of Nuclear Medicine and Molecular Imaging, and with whom I have had the pleasure of learning so much: Lu´ıs Janeiro, Paula Alexandra Santos, Lu´ıs Freire and Susana Silva. - To Ana Sousa and Beatriz Lampreia, for the important help in so many formal questions, and also for their friendship. - To the teachers and many colleagues at IBEB with whom I have been privileged to share a common working place and who daily contribute for making IBEB such an enjoyable place to work: Professor Pedro Miranda, Professor Alexandre Andrade, Sandra, Sofia, Patr´ıcia, Ricardo, Paula, Teresa, Gilberto.... - To everyone in my big family who, in so many different ways, has helped me to find the means and the strengths to finish this work. - To Francisco and J´ ulia, for the delight they give to my life. They are my personal reminder of the fact that there are things by far more important in life than debugging a program or obtaining good quality reconstructed images. - To Paulo, for being my shelter harbour. I am deeply grateful for your love, care, patience, understanding and sacrifice during these years. This work was financed in part by Funda¸c˜ao para a Ciˆencia e Tecnologia under grant SFRH/BD/3002/2000 and by AdI-Agˆencia de Inova¸c˜ao..
(19) Part I. Introduction.
(20)
(21) Chapter 1. Introduction The medical imaging field has the power of bringing together many different areas of scientific knowledge: physics, engineering, mathematics, biochemistry, medical sciences. During the last century, the medical imaging field has provided humanity with a variety of tools that have decisively contributed to the understanding of the functioning of the human body and of its constituents, either in health or in disease. Among other applications, these tools have been invaluable as (almost) non invasive means to diagnose and to evaluate disease, as well as to plan and to evaluate treatment. Breast cancer imaging is a good example of how medical imaging modalities can diminish the number of patients suffering from this highly prevalent (at least in the western world 1 ) and deadly disease. X-ray mammography is the most used technique for breast cancer imaging. This technique is used either as a complementary tool to clinical diagnosis or as an irreplaceable screening tool for the early detection of the disease. Other imaging methods such as breast Ecography and breast Magnetic Resonance Imaging play important roles as adjunct techniques to X-ray mammography. The information provided by the aforementioned techniques is, however, mainly anatomical, thus leaving space for imaging methods that are able to obtain information regarding functional or metabolic changes in tissues. Among these, molecular imaging methods such as Scintimammography and Positron Emission Mammography (PET) have been found to provide useful complementary information to the anatomical methods. However, both these techniques are tunned for whole body imaging, resulting in low sensitivity for the detection of small lesions in the breast. In this context, last years have witnessed the birth of a tremendous effort to develop dedicated compact cameras for breast cancer imaging based in Scintimammography or in PET technologies. In particular, the approach that aims to image the breast with dedicated instruments that use tracers labeled with positron emitters has been named Positron Emission Mammography (PEM). 1. Data for other countries is usually difficult to obtain..
(22) 4. Introduction. One of the PEM instruments currently being developed is the Clear−PEM scanner. This scanner, which, by the time this works is being finished, is at its assembling stage, is designed to be a high resolution, high sensitivity instrument, able to detect small cancerous lesions in the breast at an early stage of the disease. The scanner is based in a dual detector plate with the capability of acquiring data around the breast of the patient and additionally perform a complementary axillary exam. The scanner also has Depth-of-Interaction capabilities, a fundamental measure to meet the requirements of a high resolution system. Among the several components that contribute to the performance of an imaging system, the methods used for the reconstruction of the images from the projection data acquired by the system play a fundamental role. The present thesis deals 3D image reconstruction software for the Clear−PEM scanner. The aim of the work here presented was to develop and characterize the 3D image reconstruction software for the dual plate Clear-PEM scanner. A number of issues need to be addressed for that purpose, such as the large amount of data to be processed and the complexity implied in 3D image reconstruction methods, the non-standard acquisition geometry of the scanner and the incorporation in the image reconstruction process of the Depth-of-Interaction information measured by the system. The approaches followed to address these issues, the tests performed to test and tune the image reconstruction algorithms and the results obtained with Monte Carlo simulation data, which allow to foreseen some of the aspects of the performance of the Clear-PEM scanner, will be presented. The Part I−Introduction is composed of the present Chapter 1−Introduction, where the context, motivations and general organization of the work are provided. The Part II−Background comprises three chapters which include a review of the state of the art on the main knowledge fields that are related to the work developed in the present thesis. Chapter 2−Breast Cancer Imaging presents a review of the most important breast imaging modalities, focusing on the strengths and weaknesses of each technique. In this chapter it will became clear why technical improvements in some of these imaging methods, namely in Nuclear Medicine techniques, have the potential to push further the limits of breast imaging. In the following chapter, Chapter 3−Positron Emission Mammography we present an overview of some of the instrumentation issues that impact on the performance of positron emission tomography equipments. Emphasis is given on the most demanding aspects of dedicated instruments, such as the ones used to image the breast, the PEM systems, with respect to conventional whole body scanners. A literature review of the PEM scanners that are or have been developed, including the strategies used to reconstruct the data from these scanners is presented therein. The final chapter of the second part of this work, Chapter 4−Image Reconstruction in PET presents an overview of the fundamental characteristics of a class of image reconstruction algorithms that are commonly.
(23) 5. used in Position Emission Tomography, the iterative statistical image reconstruction algorithms. The Part III−Methods is composed of two chapters that describe the Clear-PEM scanner and the main utilities that were used in the development of this thesis. Chapter 5−The Clear-PEM scanner and Monte Carlo simulations is devoted to providing a general overview of the design of the Clear−PEM scanner. References are included to some of the expected performance characteristics of the scanner. The description of the Monte Carlo simulation framework that was developed for the design of the Clear−PEM scanner, and the results used to test and to tune the image reconstruction methods are presented. The simulation settings, as well as the analytical and anthropomorphic phantoms used are described in this chapter. The following chapter, Chapter 6−The STIR library, describes the image reconstruction software library that was used as the basis for the 3D image reconstruction software for the Clear−PEM scanner. The Part IV−Results begins with Chapter 7−Enhancements in the STIR framework that describes the features that were introduced in the STIR library in order to use it with data proceeding from a non standard acquisition geometry such as the Clear−PEM scanner. This chapter also includes some initial tests that were performed with analytical phantom data and the tuned image reconstruction software. The following chapter, Chapter 8−3D OS-EM image reconstruction for the Clear−PEM scanner presents the results of the studies that were performed with 3D image reconstruction software and the Clear−PEM scanner Monte Carlo simulation data. The final chapter of Part IV is Chapter 9−Bayesian Image Reconstruction for the Clear−PEM Scanner, which describes the results of the image reconstruction of the Clear−PEM scanner simulation data with a Bayesian image reconstruction algorithm. A summary of the work presented is this thesis is given in PartV−Main Conclusions and Future Work, together with a discussion of the main findings and the perspectives of future work. Finally, Appendix A lists the publications in which parts of the work presented in this thesis was published..
(24) 6. Introduction.
(25) Part II. Background.
(26)
(27) Chapter 2. Breast Cancer Imaging 2.1. Introduction. Breast cancer is the second major cause of cancer-related mortality among the occidental female population [1]. Statistics indicate that one in ten women in the western world will develop breast cancer during her lifetime Given the high incidence of breast cancer, as well as the high mortality rate associated with the disease, there have been great efforts to technically improve breast cancer imaging methods. These mainly aim at improving the capacity to detect lesions at an earlier stage, since early detection is the best means to reduce mortality, and to better differentiate malignant from benign lesions. The breast is constituted by fibrous, glandular and adipose tissue. The fibrous and glandular tissues are structured into ducts and lobules, which are surrounded by the adipose tissue. The earliest form of breast cancer is Ductal Carcinoma in Situ (DCIS). In DCIS the cancer cells are confined to the breast ducts and have not invaded the surrounding fat tissue. This form of cancer is usually associated with microcalcifications that can be detected by mammography. Breast cancer can also appear confined to the lobules, in which case it is named Lobular Carcinoma in Situ (LCIS). Both DCIS and LCIS can degenerate into invasive carcinoma, if the carcinoma spreads to surrounding breast tissues. When a carcinoma is found in the breast, there is a need to ascertain if it has spread to other regions of the body. If so, the first sites to receive lymph from the tumor are the axillary lymph nodes. A sentinel lymph node biopsy can be performed in order to detect if and which lymph nodes are cancerous, and those will be removed. If the tumor has spread beyond the lymph nodes, whole body imaging techniques such as Computed Tomography (CT), Positron Emission Tomography (PET) or Single Emission Computed Tomography (SPECT) can be used to localize the metastasis. X-ray mammography is the gold standard imaging technique for the detection and screening of breast cancer. Despite its success, x-ray mammography is not a perfect.
(28) 10. Breast Cancer Imaging. technique, as we will see further in this chapter. Other imaging methods, such as breast ecography, magnetic resonance imaging (MRI), and nuclear medicine techniques (scintimammography (SM) and PET) have also an important role in the management of this disease, providing additional or complementary information to x-ray mammography. They are employed either to further characterize tissue lesions detected by mammography, or when the physical characteristics of the women’s breast make mammography inconclusive, or when a women has known risk factors for breast cancer. High risk factors for breast cancer include inherited genetic mutations in the BRCA1 and BRCA2 genes (these account for 5% − 10% of all breast cancer cases), a personal or familial history of breast cancer and high breast tissue mammographic density (that is, a high amount of glandular tissue relative to fatty tissue in the breast). In this chapter we will briefly review the most significant modalities which are employed on breast cancer imaging, namely mammography, ecography, MRI and nuclear medicine techniques. We will overview the physical principles inherent to each of these modalities, as well as the morphological or functional characteristics of the lesions to which they are sensitive to. When possible, the sensitivity and specificity values available in the literature for the imaging modalities discussed will be presented. Sensitivity and specificity are two important parameters when evaluating the utility of a given imaging technique on detecting disease. Sensitivity refers to the ability of detecting lesions and is computed as the ratio of the true positive findings to the total number of positive exams. Specificity is the ability to distinguish malignant from benign lesions. It is computed as the ratio of the true negative findings to the total number of false exams. We will focus on the main advantages and pitfalls of each of these techniques, emphasizing how the most recent technical advances in each area are allowing to push further the boundaries of breast imaging. Examples of images of the breast obtained with each of the techniques that will be presented in this chapter can be seen in Figure 2.1.. (a). (b). (c). (d). (e). Figure 2.1: Breast cancer images obtained with (a)X-ray mammography [2], (b) Ecography [3] , (c) breast MRI [3], (d) scintimammography [2] and (d) PET [4]. ..
(29) 2.2 X-ray Mammography. 2.2. 11. X-ray Mammography. Conventional X-ray mammography has long been used for the detection of breast pathologies. It is used either as a screening tool or as a diagnostic tool, allowing further evaluation of suspected lesions found in clinical diagnosis (palpation). Screening mammography is the only screening test that has been proven in large clinical trials to decrease mortality from breast cancer [3]. Up to 30% decrease in breast cancer mortality in the screened population has been demontrated [5]. Mammography uses low energy X-rays that penetrate through the compressed breast and then exposes a photographic film placed on the opposite side of the breast. The image that is produced by mammography results from the variation in breast tissue densities that the X-ray beam has encountered along its path to the detector. Structures that more strongly attenuate the X-ray beam appear as whiter areas in the image. Mammographic features that are characteristic of breast cancer are masses, particularly irregular ones, architectural distortions of breast structures and clusters of microcalcifications. Microcalcifications can be detected by mammography due to its high resolution images. In fact, under optimal conditions, a resolution smaller than 150 µm can be obtained [3]. Unfortunately, areas of dense glandular tissue attenuate the X-ray beam similarly to masses and calcifications. As a consequence, cancers that present as small masses can be obscured by overlapping dense glandular tissue. Hence, the sensitivity of mammography for the detection of small breast cancers is reduced in women with dense breast tissue. Unfortunately, dense breast tissue is also a risk factor for breast cancer. Sensitivity is also diminished if there is a breast prosthesis or if the patient has scars resulting from previous surgery, biopsy or radiation procedures. With the optimal technique and patient conditions, mammography has a reported sensitivity between 69% and 90% [6]. Denser breasts are the main responsible for the lowest sensitivity values. Sensitivity is also dependent on the tumour size. In fatty breast, the size of detected tumour with mammography can be as small as 5 mm, but it is rarely less than 1-2 cm in dense breast. The specificity of mammography relies on the ability to distinguish cancerous from noncancerous breast lesions based on their shapes and margins, that is, on morphology. Unfortunately, as malignant and benign lesions may have similar appearances, X-ray mammography has specificity between 10% and 40% [6], which means that there is a large fraction of false-positive results. As a result of its low specificity, breast lesion evaluation based solely on X-ray mammography results frequently in unnecessary biopsy procedures. Other clinical areas in which mammography is of restricted use include the detection of lobular cancer and of ductal carcinoma in situ. The detection of DCIS is usually based.
(30) 12. Breast Cancer Imaging. on the detection of the associated microcalcifications. However, it may happen that DCIS does not present microcalcifications, and, in this case, it usually is undetected by mammography. Recently, digital mammography, which uses a digital receptor instead of the traditional screen film, resulting in a computer-generated image, was introduced for the detection of breast cancer. The use of imaging processing algorithms with the digital mammograms allows manipulating fine differences in image contrast. As a result, subtle differences, even in dense tissue, can be evaluated. Despite these promising characteristics, early experience with digital mammography has shown that the difference in cancer detection was not significant [5], although it reduces the number of unnecessary breast biopsies. Mammographic breast cancer screening reduces breast cancer mortality, but, due to its low specificity and sensibility, breast mammography results in a considerable number of missed cancers and a large number of unnecessary breast biopsies. This is specially true if the breast is dense. Because of this limitations, other imaging modalities have been proposed as additional diagnostic tools for improving breast cancer detection.. 2.3. Breast Ecography. Breast ecography is a technique that, when used as an adjunct to mammography, has been shown to improve the overall sensitivity of conventional breast imaging [7]. Furthermore, breast ecography systems are currently used to perform guided biopsies. Medical ecography imaging involves the use of very high frequency sound waves (7-12 MHz)[8] that are produced by a transducer. These waves interact with the patient tissues, producing echoes whose amplitudes depend on the acoustic impedance of the tissues. The depth of the structures that produce the echoes are determined by the time difference between the emission and the return of the sound wave. The echoes amplitudes are encoded in a gray scale image. The images obtained with breast ecography represent a two-dimensional cross section through the breast tissue. Therefore, unlike mammography, ecography imaging of the breast is not hindered by overlying dense tissue. Hence, some cancers that are not detected on mammography due to dense overlying tissue may be detected with breast ecography. However, although uncommon, some cancers have acoustical impedance similar to normal tissue and therefore may not be detected by breast ecography. Furthermore, current ecography image resolution is not enough to detect the small cancerous microcalcifications seen on mammography. The major advantage of breast ecography over mammography is its capacity for differentiating solid from cystic breast lesions, which are fluid in nature and almost always.
(31) 2.4 Magnetic Resonance Imaging. 13. benign. Since they are fluid, cysts respond differently from solid masses when penetrated by the sound waves. Breast ecography can also be used in a limited fashion to characterize solid masses. It is not, however, recommended as a primary screening method, because of a variable false-negative rate (ranging from 0.3% to 47%) [5] and of the operator-dependent nature of efficacy. Breast ecography can also be used as a vascular imaging tool with the use of the Doppler technique. A vascular imaging tool can be useful in the detection of malignancies due to tumor angiogenisis. Angiogenisis, which is considered a hallmark of cancer, is defined as the emergence of new vessels to sustain the growth of the tumor. Therefore, breast cancers are expected to demonstrate increased vascularity compared with benign masses. The future role of vascular imaging in breast ecography remains yet to be defined, since there are contradictory results regarding the reliability of Doppler evaluation in differentiating benign from malignant breast masses [9, 10]. To take the evaluation of lesion vascularity with ecography a step further, contrast agents can be used. The most common type of contrast agents in ecography are encapsulated bubbles and solid particles. These allow visualizations of blood flow in the area of interest by increasing the backscatter echoes. Improved visualization of lesion vascularity and characterization using contrast agents compared with Doppler alone has been found [11]. However, it remains to be seen whether there will be acceptance of these agents in routine breast ecography.. 2.4. Magnetic Resonance Imaging. Magnetic Resonance Imaging has been used consistently in the detection of breast cancer since the late 90’s. Since them, MRI has shown to have a very high sensitivity for detecting invasive breast carcinoma (at least 95%) [5], although with a very wide range of specificity values (37% to 97%) [5]. Several studies have clearly established that MRI can detect mammographically and clinically occult breast cancer [12], although with low specificity. MRI can be used as a tool to detect breast cancer recurrences and in the staging of the disease [13]. Since its sensitivity is not affected by the presence of underlying dense breast tissue, MRI has also been found particularly valuable in screening young women at high risk [14, 15]. Recently, it has been recommended by the American Cancer Society that MRI should be used as an adjunct tool to mammography for women at high risk for breast cancer [16]. Breast MRI is performed in a magnetic field (0.5T − 1.5T ) [12] created by a magnet that surrounds the body of the patient and with a small breast surface coil that acts as an antenna. This dedicated surface coil is needed to ensure adequate spatial resolution at high signal to noise levels [17]. The static magnetic field acts on the hydrogen nucleus of the media, aligning them. The coil emits a radio frequency pulse that induces.
(32) 14. Breast Cancer Imaging. a change in the alignment of the protons and is then turned off. The time taken by the protons to return to their original alignment is then converted into an MRI image. Since the main reservoir of hydrogen in the cell is in water molecules, MRI allows to observe the water contents of the tissues, thus providing high contrast levels between tissues with different water contents. The differences in water content between normal and malignant tissues in the breast are not enough to provide breast cancer detection with MRI. Therefore, it is necessary the use of intravenous contrast agent. This agent is usually a small molecule containing gadolinium. Due to their increased angiogenesis, cancer cells present increased vascularity. The contrast agent will thus accumulate in the cancerous lesions, highlighting them in the MRI image. Unfortunately, many benign lesions will also highlight. The difference in the lesion morphology can then be used to distinguish the malignant from the benign lesions [3]. These morphological differences may, however, not be enough to provide a good discrimination between benign and malignant lesions. Improved specificity may be achieved through the analysis of lesion kinetics, that is, by evaluating the time intervals of wash in and wash out of the contrast agent in the lesion. Since the malignant lesions vasculature has higher capillary permeability than the normal vasculature, malignant lesions tend to present quicker enhancement and clearance of the contrast material [12]. A point where breast imaging with MRI falls short consists on the difficulty to detect DCIS lesions. In fact, MRI sensitivity for DCIS can be as low as 40% [18]. On the one side, MRI is uncapable of detecting the microcalcifications that typically appear with DCIS, since MRI can only identify breast masses as small as 1-2 mm [19]. On the other side, DCIS lesions do not present increased vascularity, since their nutrition is performed by difusion. Therefore, these lesions are commonly missed by MRI. One other handicap of MRI arises when suspicious lesions found on MRI cannot be visualized with mammography or ecography. In these cases, ecography guided biopsy systems are of no use. Therefore, MRI-based guidance systems are needed for needle biopsy or placement of localization needles before surgery. MRI guided systems are not yet well established, and still present many problems. However, systems exist that are based on anatomical navigation using fiducial markers placed either on the coil or on the breast [20]. In alternative, an interactive placement of needles can be performed directly with MRI guidance if open-architecture MR coil is available [21]. Yet another alternative is MRI guided vacuum assisted biopsy [22]. In either case, MRI compatible needles must be used. There are, however, many unsolved problems associated with its use, such as artifacts in some of the MRI sequences [12]..
(33) 2.5 Scintimammography. 2.5. 15. Scintimammography. Scintimammography (SM) is a functional imaging technique that uses a radiation detector camera, named Anger Camea, and single-photon emitter radiotracers to image the breast. The radiopharmaceuticals used are administrated intravenously in the patient body, and since they are designed for such purpose, they accumulate in the cancerous cells. The emitted gamma rays can be detected externally by an Anger Camera, thus providing information of the location of the cancerous cells. Currently, the most used radiopharmaceuticals used for SM are 99m Tc-sestamibi (MIBI) and 99m Tc-tetrofosmin [23]. Of these two, the highly complex uptake mechanism of 99m Tc-sestamibi is better understood, although they both share common biophysical, chemical and pharmacokinetic properties [24]. The uptake of both radiopharmaceuticals rely on the higher aerobic metabolism of tumor in comparison with normal breast tissue cells, and are related to tumor cell apoptosis, blood supply and cell proliferation [24]. Scintimammography is a highly sensitivity technique for the detection of breast cancer. The reported sensitivity values range from 85% to 93% [22, 25]. Since SM is not affected by the breast density [26], it is often able to visualize lesions in dense fibroglandular tissue that can not be seen by mammography. Thus, it is of special value when the mammography findings are equivocal or when there are palpable masses that are not seen in mammography. The specificity of scintimammography is also high, since SM images do not reflect morphological changes in the breast tissue, but rather changes in the cells metabolism. Thus, SM is better able to distinguish malignant from benign lesions than conventional techniques. The reported specificity for SM is around 87% [22, 25, 27]. When used in combination with mammography, SM can improve its overall sensitivity and specificity [28]. It is important to emphasize that the sensitivity of SM depends utterly on the size of the lesions, dropping drastically for lesions lower than 1 cm [23]. This is due to the poor intrinsic spatial resolution of the Anger Camera, and to the sub optimal detection geometry, since there is a big distance between the detector and the imaged breast. Attempts to overcome these pitfalls have resulted in the development of small dedicated gamma cameras that provide higher spatial resolution and higher detection sensitivity. The firsts clinical trials using these dedicated cameras have shown a significant improvement in sensitivity for smaller lesions [29, 30, 31, 32] indicating that this new technique might become useful in the clinical practice [33]. As any other nuclear medicine technique, the quality and type of information provided by scintimammography relies tremendously on the radiopharmaceuticals used. Different radiotracers will provide information on different cellular processes. Thus, another.
(34) 16. Breast Cancer Imaging. approach to improve scintimammography’s accuracy is the development of radiopharmaceuticals that are more specific of breast cancer. Examples of such developments are radiopharmaceuticals that are used to target tumor associated antigens or receptors that are expressed in most primary breast cancers such as somatostatin receptors [28].. 2.6. Positron Emission Tomography. Just like scintimammography, Positron Emission Tomography is a form of diagnosis imaging that uses radiolabeled tracers to track functional or metabolic changes in tissues. However, unlike scintimammography, PET is a tomographic technique where the radionuclides used decay by the emission of positrons. The most used radiotracer for imaging cancer in PET is 18 F-fluorodeoxyglucose, or 18 FDG, a glucose analogue that is labeled with the positron emitter 18 F. This radiotracer is used to detect glucose consumption, which is known to be increased in cancerous cells compared to normal cells. This is due to the higher metabolism of cancerous cells. Just like in scintimammography, the advantage of being able to image metabolism instead of anatomy is that, usually, the accelerated metabolic activity of cancerous cells occurs before the changes in the anatomical structures. The tracking mechanism of 18 FDG inside the cancerous cells is as follows. FDG is a glucose analog and, just like glucose, is transported into the cells by glucose transporters named GLUT1. These transporters are known to be overexpressed in breast cancerous cells, thus contributing to increased FDG uptake [34]. Once inside the cell, FDG is phosphorylated into deoxyglucose-6-phosphate (FDG-6-PO4) by an enzyme named hexokinase. Hexokinase is also thought to be overexpressed in cancerous cells. Unlike glucose, FDG-6-PO4 does not enter further enzymatic reactions and, due to its negative charge, remains trapped inside the cell [28]. This metabolic trapping of FDG inside the cell constitutes the basis for imaging the in vivo distribution of the tracer [35]. The sensitivity and specificity values found for PET in the detection of primary breast cancer are moderate: 85% and 79%, respectively [3]. The fact that FDG can be taken by non malignant processes such as infection or inflammation accounts for the not so high specificity values. It has also been found a high variability in the metabolic rate of tumors, and consequently in FDG uptake [36]. The low to moderate sensitivity values are due to the fact that primary breast cancer detection by PET is lesion size dependent. In fact, due to its limited spatial resolution, PET has litle capability of detecting lesions of less than 1 cm. For instance, in a given clinical study, the sensitivity for detecting tumors less than 1 cm was only 57%, compared with 91% for tumors larger than 1 cm [37]. FDG uptake is also dependent on the breast composition, with fibroglandular breasts exhibiting a significantly higher FDG uptake than breasts that.
(35) 2.6 Positron Emission Tomography. 17. are constituted mainly by fat. However, this does not seem to preclude PET from being able to detect lesions in dense breasts [38]. Therefore, in primary breast cancer PET may help on detecting tumors in high risk patients with dense breasts, to whom conventional tecniques are of little use [3]. Due to its moderate sensitivity in detecting small cancers, PET is not considered a first choice technique for the diagnosis of primary disease. The role of PET in breast imaging has been mainly focused on other applications. PET has been found to be invaluable in the determination of unsuspected metastatic disease resulting from breast cancer, mainly in the detection of distant metastasis, since it is a whole body imaging technique. It has also been shown to be of great value in the evaluation of the response to therapy and in the detection of recurrent breast cancer. This is because PET, unlike anatomical techniques, is able to differentiate viable tumors from scars resulting from previous therapies [28]. The detection of metastasis in the axilla is an important prognostic status, especially for early stage breast cancer patients, as it was previously said. Initial evaluations of PET as a predictor of axillary node status were very promising. However, it was soon found that the ability of PET do detect metastatic disease in the axilla was hampered by its limited spatial resolution [39]. In fact, PET seems to be unable to detect small metastasis in the axilla (less than 5 mm). Published studies have shown a wide range of sensitivity values for PET in the case of axillary staging, ranging from 79% to 100%. Specificities have ranged from 66% to 100% [40]. PET-CT in one integrated unit that allows both functional and anatomic imaging in a single study has also revealed to be a valuable technique for breast cancer imaging. Besides providing anatomical information, the low-dose CT exams also allows for attenuation correction of the emission scan. The use of PET-CT in breast cancer imaging has shown to yield a clear improvement in diagnostic accuracy [35, 41]. Figure 2.2 is an example of a FDG PET-CT exam.. Figure 2.2: FDG PET-CT breast exam. The image on the left shows the reconstructed PET image, while the image on the right shoes the PET-CT fused image. From [41]..
(36) 18. Breast Cancer Imaging. Such as in scintimammography, some of the aspects that prevent whole body PET from being more useful in the diagnosis of primary breast cancer are related to technological aspects and not with fundamental limits of the technique. This has lead to a tremendous surge of interest on the conception and development of small, dedicated PET cameras for breast imaging [42, 43, 44, 45], as we will see in the next chapter. The first preliminary clinical trials using this technology seem to be very promising [46, 47, 48, 49], but technical improvements of these cameras are still taking place. Another means to improve the usefulness of PET in breast cancer imaging is through the development of new radioligands. Although FDG continues to play an important role in the evaluation of breast cancer, there is a chance that other radiopharmaceuticals will play a role in the management of breast cancer in the future [4]. Besides energy metabolism, other tumor surrogates can be used for imaging breast cancer with PET. For instance, genetic changes in breast cancerous cells comprise increased oestrogen receptors, increased protein synthesis and enhanced proliferation activity. The evaluation of such processes with newly developed radiopharmaceuticals such as 18 Ffluroestradiol (FES), 11 C-methionine and 18 F-fluorothymidine (FLT), respectively, may provide additional functional information to that obtained with FDG [4].. 2.7. Conclusions. In this chapter an overview of the main technologies used for breast cancer imaging was given. Mammography remains the gold standard for breast cancer screening and diagnosis, together with biopsy. Adjunct techniques such breast ecography and magnetic resonance imaging provide information when the findings on mammograms are equivocal, but this information is still mainly anatomical. Functional imaging such as scintimammography and PET have been reported to offer advantages over anatomically based imaging modalities. However, both these imaging techniques suffer from lack of ability to detect small lesions, mainly due to their limited spatial resolution and whole body geometry. In this context, there has emerged a tremendous effort in the development of dedicated instruments for breast cancer imaging, either based in scintimammography or in PET technology. These efforts have been crowned with very promising initial clinical results. In the next chapter we will overview the main instrumentation issues regarding the development of breast imaging dedicated PET scanners..
(37) Chapter 3. Positron Emission Mammography 3.1. Introduction. We have seen in the previous chapter that the use of labeled radiotracers has shown promise for the detection, diagnosis and staging of breast cancer. However, the standard technology of whole body scanners, due to its limited spatial resolution and to the disadvantageous geometry, which limits sensitivity, are in part precluding molecular imaging using radiotracers from contributing with its full potential to the imaging of the breast. These limitations have prompted an active interest in the development of compact positron emission tomography cameras dedicated for breast imaging, or Positron Emission Mammography (PEM) cameras. In the last ten years, a variety of detector designs and geometries has been studied in order to optimize the technique. Several geometries have been exploited to fulfill the requirements of imaging the breast, the most commonly adapted being rectangular or planar detector geometries with or without rotation. Regarding the design of the detectors, most of the instrumentation issues raised by the development of PEM scanners are common to the ones of small animal positron emission tomography (PET) scanners, since they also must meet high resolution, high sensitivity requirements. This chapter will begin with a brief description of the positron emission and detection processes, that are common to PEM and PET. Then, we will review the performance parameters and instrumentation issues more challenging in the design of dedicated PEM scanners. We will finalize the chapter with a literature review of the state of the art in Positron Emission Tomography scanners..
(38) 20. 3.2. Positron Emission Mammography. Positron emission and detection. As it was seen in the previous chapter, Positron Emission Tomography, as well as Positron Emission Mammography, uses radiopharmaceuticals that are labeled with a positron emitting radionuclide. Besides 18 F, which is used in FDG, other radionuclides, such as 82 Rb, 15 O, 13 N and 11 C, among others, can be used to label the molecular probes used in PET. The emitted positron travels a given amount of space in matter, while dissipating its kinetic energy through interactions with electrons and surrounding nuclei. At the end of its path, the positron combines with an electron in its vicinity, in an annihilation reaction whereby the total mass of the electron and the positron is converted into high energy photons. The rest-mass energy of both positron and electron is 511 keV. If both particles were at rest at the time of annihilation, the two resulting 511 keV photons will be emitted in opposite directions. The gamma rays thus emitted can interact with the tissues of the patient either by photoelectric effect or by Compton scatter. Both photon attenuation and scatter result in image degradation since, in the first case, emission counts are lost and, in the second, the measured spatial information is inaccurate. Whereas attenuation correction is fairly simple if a transmission scan is available, the scatter correction is not as straightforward. If the photons are not absorbed by the matter in the patient body, they can be detected externally in coincidence by using opposed pairs of scintillator crystals. Each luminous signal produced in the crystals is transformed into an electrical signal. A coincidence event happens when such two electrical signals are registered in a coincidence electronic circuit within a time frame that is defined by a coincidence time window. The imaginary line that unites the two activated crystals in a coincidence event is called a line of response (LOR). The number of counts that are detected along the several LORs during an exam is stored in an histogram and used for image reconstruction purposes. Alternatively, list mode format can be used. In list mode format, the relevant information regarding the event, such as the activated crystals, the deposited energy and a time stamp, is stored sequentially on disk and used directly for image reconstruction.. 3.3. The performance of a scanner. Of main importance for the performance of a PET scanner are its photon sensitivity and its spatial, energy and temporal resolutions. The geometry, the detector crystals and the electronics of the system all impact on the above mentioned parameters. In this paragraph we will overview the main aspects that affect these parameters, highlighting the most common differences between traditional clinical scanners and high resolution scanners..
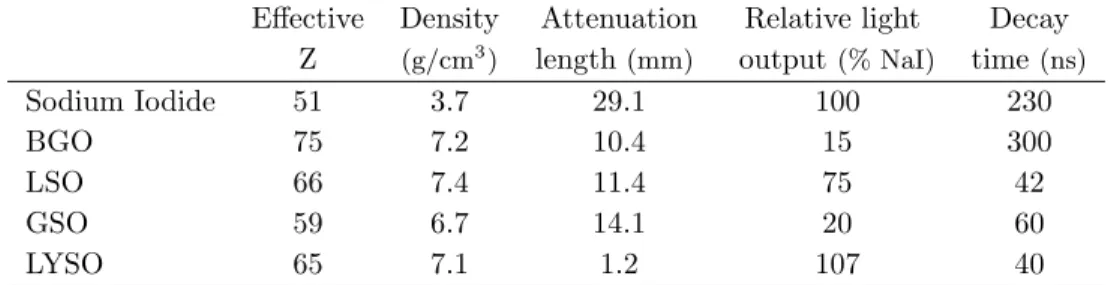
(39) 3.3 The performance of a scanner. 3.3.1. 21. Photon sensitivity. The photon sensitivity is defined as the fraction of 511 keV photon pairs emitted from the imaging subject that are detected by the imaging system [50]. It is important that a scanner has the higher photon sensitivity possible since a higher fraction of detected photons will impact on better statistics of the acquired data and, consequently, on lower noise level of the final reconstructed images. The photon sensitivity in a clinical PET system is less than 1%. In dedicated or high resolution scanners, this value is usually improved by increasing the scanner geometric efficiency, that is, the probability that the emitted photon transverses the detected material, or by increasing the intrinsic detector efficiency. Usually, the scanner geometric efficiency is enhanced in dedicated scanners relatively to traditional scanners mainly because the detector is brought closer to the imaging subject. The geometric efficiency can also be increased by packing the detector elements as tightly as possible and by covering the region to be imaged with as much detector as possible. The other aspect that influences the scanner photon sensitivity is the intrinsic detector efficiency. This is defined as the likelihood that photons transversing the detector material will be stopped [50]. It depends mainly on the scintillator crystals that are used as detector elements. Scintillator crystals that have high density (ρ), with high effective atomic number (Zef f ) have maximum ability to stop the 511 keV photons. In fact, a high density crystal favors the photon interaction and a high effective atomic number maximizes the probability of photoelectric interactions within the crystal, with respect to Compton events. The quantity that maximizes the crystal stopping power 2 . A scintillator that has a high stopping power will have a short attenuation is ρZef f length. Table 3.1 lists the values of Zef f , ρ, the attenuation length and some other properties of the most common scintillator crystals used in PET scanners. The decay time determines the time resolution of the scanner and the light output determines the detector energy resolution and has effects also in the image resolution. Both these parameters will be discussed later. Sodium Iodine doped with Thallium (NaI(Tl)) was the detector initially used in PET scanners. It has a very high light output (38 photons/keV), resulting in good energy and spatial resolutions [51]. However, its slow decay time leads to increased detector dead time and a high random coincidence rate (see below the discussion for system time resolution). Its low density results in a low stopping power (high attenuation length) when compared to the other crystals used in PET. Sodium Iodine was first replaced by BGO (Bismuth Germanate) that, despite its high decay time and poor light output, has an excellent stopping power..
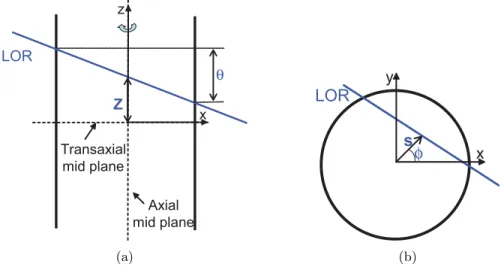
(40) 22. Positron Emission Mammography. Sodium Iodide BGO LSO GSO LYSO. Effective Z 51 75 66 59 65. Density 3. (g/cm ). 3.7 7.2 7.4 6.7 7.1. Attenuation length (mm) 29.1 10.4 11.4 14.1 1.2. Relative light output (% NaI) 100 15 75 20 107. Decay time (ns) 230 300 42 60 40. Table 3.1: Properties of common scintillator crystals used in positron emission tomography. Adapted from [50]. More recently, other crystals that combine better light output with high stopping power have been introduced to PET. LSO (Lutetium Oxyorthosilicate) has a high stopping power and a good light yield but, due to intrinsic properties of the crystal, its overall resolution is not as good as NaI(Tl) [52]. GSO (Germanium Orthosilicate), despite its lower stopping power and light output, has better energy resolution than LSO. Both crystals are in use in PET scanners.. 3.3.2. Spatial resolution. The spatial resolution describes the ability of the system to distinguish two closely spaced point sources. In PET, the fundamental limit of spatial resolution is imposed by the nature of positron annihilation. In fact, the emitted positron describes, before annihilating, a given path of variable length and direction. Therefore, the detected LOR contains the positron annihilation point, not the positron emission point, and these two points can be several millimeters apart. This positron range effect degrades the spatial resolution of the images. (Figure 3.1 (a)). The positron range depends upon the energy of the emitted positron and upon the electronic density of the medium. It has been estimated a value of 0.22 mm FWHM for the positron range emitted from 18 F in water, the major component of human cells [53]. In addition to the positron range, the acollinearity effect also leads to resolution degradation in PET systems. This effect is caused by the fact that the annihilation photons are almost never anti-parallel, since usually the positron and the electron are not exactly at rest when they annihilate. As a consequence, the detected line of response does not contain the point of positron-electron annihilation (Figure 3.1 (b)). The degradation of the spatial resolution due to the accolinearity effect worsens as the detector diameter increases. Another significant factor that limits PET spatial resolution is the size of the detector element. Spatial resolution may be improved significantly by reducing the detector pixel size. This is specially important in small diameter or dedicated PET scanners,.
(41) 3.3 The performance of a scanner. Annihilation Positron Emission. (a). 23. Annihilation. True LOR Assumed LOR. Assumed LOR. (b). Annihilation. (c). Figure 3.1: Schematic drawings of some of the effects that degrade spatial resolution in PET: a) the positron range, b) the accolinearity effect and c) the Depth of Interaction effect or parallax error. where the pixel size dominates image resolution over the non-collinearity effect, which is minor for small detector diameters. Typical clinical systems use 4−6 mm2 detector pixels, whereas small animal use detector pixels of 1.5−2.0 mm2 and positron emission mammography scanners use pixels of 1.8−3.0 mm2 . A final important factor that affects PET spatial resolution is the parallax error. This error occurs when the crystal depth at which the photon interaction takes place, known as Depth of Interaction (DOI), is not known. In this case, the LOR that unites the two activated crystals does not necessarily contain the true LOR (Figure 3.1 (c)). For photons entering the scintillators at oblique angles there will be a mismatch between the true and the measured line of response. This degrading effect has greater impact in scanners where the distance between opposed detectors is smaller, like dedicated cameras. These are also the cameras to which a good spatial resolution is of crucial importance. Furthermore, the scintillator crystals that compose these cameras are usually long crystals, to improve photon sensitivity. Therefore, it does not surprise that the ability to obtain information on the DOI has became an important factor in the design of high resolution PET scanners [54, 55, 56], with different strategies being followed to perform such measure.. 3.3.3. Energy Resolution. The energy resolution indicates the precision with which the system can measure the incoming photon energy. A good energy resolution is important because it allows the use of a narrow energy window without significantly compromising photon sensitivity. A narrow energy window helps to prevent contamination from photons that undergo scatter before interacting with the scintillator crystal, since the scatter process implies the loss of energy. It may also help to reduce the rate of random photon events, since a part of these photons undergo scatter. Random, or accidental, coincidences,.
Imagem
+7
![Figure 5.1: Representation of the Clear-PEM system. From [143].](https://thumb-eu.123doks.com/thumbv2/123dok_br/18089588.866245/78.918.167.664.94.465/figure-representation-clear-pem.webp)
Documentos relacionados
Mas, apesar das recomendações do Ministério da Saúde (MS) sobre aleitamento materno e sobre as desvantagens de uso de bicos artificiais (OPAS/OMS, 2003), parece não
Ousasse apontar algumas hipóteses para a solução desse problema público a partir do exposto dos autores usados como base para fundamentação teórica, da análise dos dados
A infestação da praga foi medida mediante a contagem de castanhas com orificio de saída do adulto, aberto pela larva no final do seu desenvolvimento, na parte distal da castanha,
Como descrito acima, vários fatores podem influenciar na composição físicoquí mica do leite, portanto, o objetivo do estudo foi comparar a composição físico-química do
However, on the point source phantom reconstruction, the random correction was not used, as a result of the low number of counts obtained with the phantom.. In conformity with
The probability of attending school four our group of interest in this region increased by 6.5 percentage points after the expansion of the Bolsa Família program in 2007 and
O presente trabalho visa demonstrar a importância da relação teórico-prática, no Laboratório de Solos e Plantas do Instituto Federal do Espírito Santo – Campus Itapina, para
No campo, os efeitos da seca e da privatiza- ção dos recursos recaíram principalmente sobre agricultores familiares, que mobilizaram as comunidades rurais organizadas e as agências
