Printed version ISSN 0001-3765 / Online version ISSN 1678-2690 http://dx.doi.org/10.1590/0001-3765201520140453
www.scielo.br/aabc
In
fl
uence of mass transfer on bubble plume hydrodynamics
IRAN E. LIMA NETO and PRISCILA A.B. PARENTE
Departamento de Engenharia Hidráulica e Ambiental/DEHA, Centro de Tecnologia/CT,
Universidade Federal do Ceará/UFC, Campus do Pici, Bloco 713 - 1° andar, 60451-970 Fortaleza, CE, Brasil
Manuscript received on September 9, 2014; accepted for publication on January 29, 2015 ABSTRACT
This paper presents an integral model to evaluate the impact of gas transfer on the hydrodynamics of bubble plumes. The model is based on the Gaussian type self-similarity and functional relationships for the entrainment coeffi cient and factor of momentum amplifi cation due to turbulence. The impact of mass transfer on bubble plume hydrodynamics is investigated considering different bubble sizes, gas fl ow rates and water depths. The results revealed a relevant impact when fi ne bubbles are considered, even for moderate water depths. Additionally, model simulations indicate that for weak bubble plumes (i.e., with relatively low fl ow rates and large depths and slip velocities), both dissolution and turbulence can affect plume hydrodynamics, which demonstrates the importance of taking the momentum amplifi cation factor relationship into account. For deeper water conditions, simulations of bubble dissolution/decompression using the present model and classical models available in the literature resulted in a very good agreement for both aeration and oxygenation processes. Sensitivity analysis showed that the water depth, followed by the bubble size and the fl ow rate are the most important parameters that affect plume hydrodynamics. Lastly, dimensionless correlations are proposed to assess the impact of mass transfer on plume hydrodynamics, including both the aeration and oxygenation modes.
Key words: aeration, bubbles, hydrodynamics, mass transfer, modeling, oxygenation.
INTRODUCTION
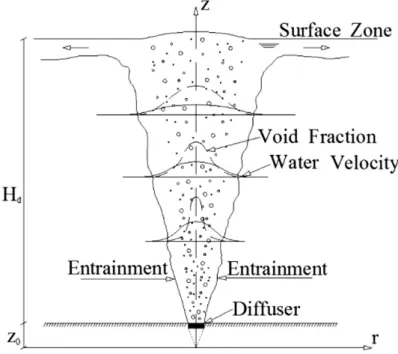
Bubble plumes are produced when gases are injected in liquids, as shown schematically in Figure 1. These systems occur in several engineering applications including artifi cial aeration, oxygenation and mixing in
tanks and water bodies, reservoir destratifi cation, contaminant containment, underwater blowouts, CO2
sequestration, among others (Wüest et al. 1992, Johansen 2003, Yapa and Chen 2004, Singleton and Little 2006, Lima Neto et al. 2008a, c, Socolofsky et al. 2008, Einarsrud and Brevik 2009, Lima Neto 2012a, b, Zhang and Zhu 2013).
The integral approach proposed by Cederwall and Ditmars (1970) and then revisited by Milgram (1983), Socolofsky et al. (2002), and Lima Neto (2012a) has long been used to model the hydrodynamics of round bubble plumes in stagnant water. These models consider Gaussian distributions of water velocity
and void fraction (see Figure 1), as observed experimentally (Milgram 1983, Lima Neto et al. 2008b).
Key model parameters are the entrainment coeffi cient and the factor of momentum amplifi cation due to
turbulence, which can be estimated using functional relationships given by Milgram (1983) and Lima Neto (2012a). For relatively weak bubble plumes (i.e., with relatively low gas fl ow rates and high water depths and slip velocities), Lima Neto (2012a) showed that a relationship for the momentum amplifi cation factor is indeed needed, as the importance of turbulent momentum fl ux increases with decreasing air fl ow rate (Leitch and Baines 1989). On the other hand, for stronger bubble plumes, this effect becomes negligible. Wüest et al. (1992) investigated the effect of mass transfer using such integral approach but considering top hat distributions of plume properties and neglecting the effect of turbulence. Buscaglia et al. (2002)
compared an integral approach based on the model of Wüest et al. (1992) to computational fl uid dynamic
(CFD) simulations and obtained similar results. McGinnis et al. (2004) and Socolofsky et al. (2008) also validated and improved the method of Wüest et al. (1992). More recently, Einarsrud and Brevik (2009) presented an alternative bubble plume model accounting for bubble dissolution that makes use of a turbulent correlation parameter analogous to the entrainment coeffi cient. Differently from previous studies
on mass transfer, Einarsrud and Brevik (2009) assumed Gaussian profi les for plume parameters. Other
investigations on the effects of crossfl ow, stratifi cation or hydrate formation have also been conducted (Johansen 2003, Socolofsky et al. 2008, Zhang and Zhu 2013), but are not the focus of the present study.
In this paper, we proposed a simple integral model to predict gas transfer from round bubble plumes in stagnant water. The model is based on Gaussian profi les of plume properties, conservation equations of
liquid volume, momentum and buoyancy, and functional relationships, modifi ed from Lima Neto (2012a),
to describe the hydrodynamics of weak/strong bubble plumes. The effect of mass transfer as initially suggested by Wüest et al. (1992) was incorporated into the model. It is important to note that the model developed herein differs from that of Wüest et al. (1992) because the former uses Gaussian distributions of water velocity and void fraction while the latter uses top hat distributions. In addition, different functional relationships for the initial conditions of the plume, entrainment coeffi cient and momentum amplifi cation factor were used in our model. Also, the present model considers a simple numerical integration of the bubble plume equations, making it simpler than the other currently available models.
MODEL FORMULATION
The axial variation of mass of gaseous species transferred per bubble is given by Eq. (1), which has been modifi ed from Wüest et al. (1992) to account for a Gaussian distribution of water velocity in the radial direction (see Figure 1):
(
)
22
1
i b
L i i
c s
dm
d
K
HP
C
u
dz
u
π
λ
= −
−
⎛
+
⎞
⎜
⎟
⎝
+
⎠
(1)
in which mi is the mass of each gaseous specie i (oxygen or nitrogen), KL the liquid-side mass-transfer coeffi cient, H the Henry’s constant, Pi the partial pressure of the gas at a given depth, Ci the bulk aqueous-phase concentration, db the bubble diameter, λ the spreading ratio of the bubble core radius relative to the entrained liquid radius, uc the centerline liquid velocity, and us the bubble slip velocity. Relationships for KL,
At a distance z from the source, mass transfer from one bubble to the water [given by Eq. (1)] will promote a reduction in the bubble volume Vb. On the other hand, as the bubble rises towards the free water surface, it will also suffer decompression which in turn will promote an increase in Vb, as a counterbalance effect. The following expression obtained by considering the ideal gas law, together with isothermal expansion, is used to evaluate the impact of decompression on bubble diameter:
⎟⎟
⎠
⎞
⎜⎜
⎝
⎛
−
+
+
=
z
H
H
H
H
m
V
d a
d a d g
z b z b
, ,
,
ρ
(2)where mb,zis the total mass of gaseous species of a bubble at a distance z from the source, ρg,d is gas density at the diffuser, Ha the atmospheric pressure head, and Hd the water head above the diffuser. Thus, assuming a spherical bubble, the diameter db can be calculated by:
=
b
d
36
,π
z b
V
(3)
A volumetric gas fl ow rate Qg,z for all the bubbles at a given height z was calculated to introduce the effect of mass transfer on plume hydrodynamics:
N
V
Q
g,z=
b,z (4)in which N is the number fl ux of bubbles, assumed constant along the axial direction and equal to the
number fl ux at the diffuser. This means that bubble coalescence and breakup are considered negligible.
Equation (4) also assumes monodisperse bubble sizes.
Lastly, bubble plume hydrodynamics can be described by two equations derived from conservation of
liquid volume, momentum, and buoyancy, which have been modifi ed from Cederwall and Ditmars (1970)
to account for mass transfer and momentum amplifi cation due to turbulence:
, 2 2
2
2
1
g z c c c c sgQ
du
u
u
dz
b
u b
u
α
γπ
λ
=
−
⎛
+
⎞
⎜
⎟
⎝
+
⎠
(5) , 2 22
1
g z c c sgQ
db
u
dz
u b
u
α
γπ
λ
=
−
⎛
+
⎞
⎜
⎟
⎝
+
⎠
(6)in which b is the plume radius where u = 0.37uc, g the gravity acceleration, α the entrainment coeffi cient, and γ the momentum amplifi cation factor, defi ned as the ratio of total momentum fl ux to the momentum
fl ux carried by the mean fl ow. The following functional relationships for the parameters α and γ were adjusted herein to a wide range of laboratory and fi eld-scale data, provided by Milgram (1983), resulting in correlation coeffi cients higher than 0.95:
( )
0.0148 ln 0.0824
α= β + (7)
( )
0.181.405
γ = β − (8)
in which β is a dimensionless parameter given by:
3 , s d a g
u
H
Q
g
′
=
β
(9)where g’ is the reduced gravity defi ned as g’ = g (ρw - ρg)/ρw, in which ρw and ρg are the water and gas density, respectively, and Qg,a is the air volumetric fl ow rate at atmospheric pressure. Note that Eqs. (8) and (9) have the same form as those presented by Lima Neto (2012a), but here a constant slip velocity of us = 0.23 m/s (instead of us = 0.35 m/s, as suggested by Milgram 1983) was used to calculate β. This value of us
covers bubble diameters db ranging from about 5 to 10 mm (see Wüest et al. 1992), which were probably
the mean sizes of the bubbles present in the coarse-bubble aeration tests reported by Milgram (1983), where bubble dissolution was assumed negligible.
Eq. (7) indicates that, for a given value of g’, the higher the value of β(i.e., the higher the gas fl ow rates Qg,a as compared to the water depths Hd and slip velocities us), the higher will be the centerline (and entrained) liquid velocity. Note that lower slip velocities means smaller bubbles and a higher number fl ux
N (for the same value of Qg,a), which results indeed in higher entrainment into the plume (Lima Neto et al. 2008a). On the other hand, Eq. (8) shows that higher values of βwill result in a smaller effect of turbulence, as the turbulent momentum fl ux is expected to decrease with decreasing the bubble slip velocity (and size) and increasing the air fl ow rate (Leitch and Baines 1989). Therefore, low values of β represent weak bubble
In addition, relationships for the virtual origin of the fl ow zo as well as the initial conditions of uc and
b are obtained from Lima Neto (2012a). Thus, Eqs. (5) and (6) can be solved together with Eqs. (1) - (4)
by using a simple explicit Euler type fi nite difference scheme. Observe that previous numerical studies on bubble plumes normally use Runge-Kutta methods (Wüest et al. 1992, Socolofsky et al. 2008, Lima Neto 2012a, b) or more sophisticated approaches (Buscaglia et al. 2002, Yapa and Chen 2004).
RESULTS AND DISCUSSION
In this section, model simulations were performed for a wide range of gas volumetric fl ow rates Qg,a and water depths Hd. The tests included initial bubble diameters ranging from fi ne to coarse bubbles (db = 2-10
mm). Furthermore, both weak bubble plumes, where the effect of turbulence was considered important (γ
>> 1), and strong bubble plumes, where turbulence was considered negligible (γ≅ 1), were investigated. Note that all simulations considered constant concentrations of oxygen and nitrogen in the ambient water. The reader may refer to Singleton and Little (2006) for studies considering the coupling of bubble plume and ambient water models.
First we analyzed the impact of mass transfer and turbulence on air-bubble plume hydrodynamics by comparing model simulations with laboratory and fi eld-scale data available in the literature.
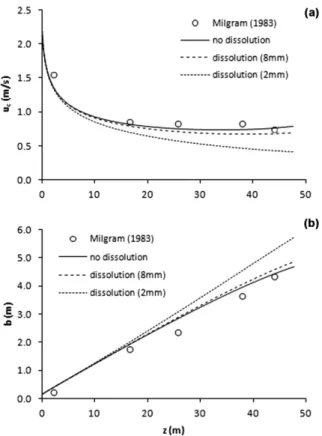
Figure 2 shows present model predictions of the axial variation of centerline liquid velocity (uc), plume radius (b) and experimental data of Milgram (1983) for Qg,a = 0.118 m3/s and Hd = 50 m. The simulations were performed for β= 1.91, α= 0.097, and γ= 1.25, and considered three conditions: no bubble dissolution, as a reference, and the effect of mass transfer for initial bubble diameters db of 2 (normally used in fi ne-bubble aeration) and 8 mm (assumed herein as a mean ne-bubble diameter in the coarse-ne-bubble experiments of Milgram 1983). For the case of no dissolution, a good agreement can be seen between model predictions and experimental data. For db = 8 mm, the values of uc shown in Figure 2(a) were consistently lower than the reference case (no dissolution), with deviations of up to 13%, while the values of b shown in Figure 2(b) were consistently higher, with deviations of up to about 5%. These relatively small differences suggest that for coarse air bubbles, the impact of dissolution was not signifi cant at the present fl ow conditions. Additional simulations were also conducted for lower values of Qg,a, but the effects of dissolution were still small. Nevertheless, simulations for higher values of Hd were also performed, and the deviations were more pronounced. On the other hand, for db = 2 mm, the values of uc shown in Figure 2(a) were up to about 50%
lower than the reference case, while the values of b shown in Figure 2(b) were up to about 20% higher.
This means that for fi ne air bubbles, dissolution will be important and, as a consequence, the volumetric
fl ow rate Qg,z will increase slower with z, which will result in a faster increase in b and faster decay of uc
[see Eqs. (5) and (6)]. Note that for the tests above, the bubble slip velocity us was approximately constant and equal to 0.23 m/s, as bubble diameter ranged from about 2 to 10 mm (see Wüest et al. 1992). Another
important point is the effect of turbulence. The above-mentioned value for the momentum amplifi cation
factor (γ= 1.25) means that 25% of the total momentum fl ux is carried out by turbulence. As a comparison, if a constant value of γ= 1.0 (as assumed by Wüest et al. 1992) were used in the simulations, the deviations
from the values shown in Figure 2 would reach up to about 10%. Therefore, for such fl ow conditions, in
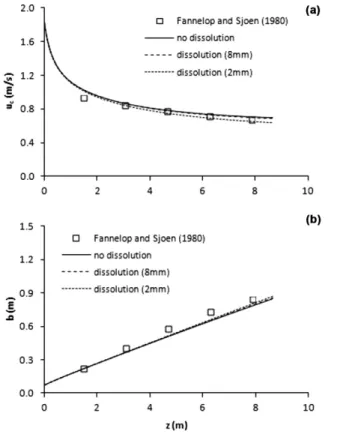
Figure 3 shows model predictions of the axial variation of uc and b and experimental data of Fannelöp and Sjöen (1980) for Qg,a = 0.01 m3/s and H
d = 10 m. Again, three conditions were considered: no bubble
dissolution, and the effect of mass transfer for initial bubble diameters db of 2 mm (fi ne-bubble aeration) and 8 mm (assumed herein as a mean bubble diameter in the coarse-bubble experiments of Fannelöp and
Sjöen 1980). The simulations were performed for β = 0.81, α= 0.077, and γ= 1.46. A good agreement
between model predictions and experimental data is obtained for the reference case of no dissolution. For
db = 8 mm, the values of uc and b almost overlap with the reference case. This confi rms that for coarse bubbles, dissolution is negligible at the present fl ow conditions. However, for db = 2 mm, the values of uc
shown in Figure 3(a) were up to about 10% lower than the reference case, while the values of b shown in
Figure 3(b) were up to about 3% higher. This suggests that even for relatively small water depths as in the present case, dissolution can have an impact on bubble plume hydrodynamics. Regarding the effect of the momentum amplifi cation factor, if a value of γ= 1.0 were used (instead of γ= 1.46), the deviations from
the values shown in Figure 3 would reach up to about 17%. For such case (γ= 1.46), the bubble plume can
be considered weaker than in the previous condition shown in Figure 2 (γ= 1.25), which means that the
momentum carried by the mean fl ow is small as compared to that carried by turbulence.
Figure 2 - Comparison between model predictions and experimental data of Milgram (1983) for Qg,a = 0.118 m3
/s and
Figure 4 shows model predictions of the axial variation of uc and b and experimental data of Milgram and Van Houten (1982) for Qg,a = 0.0005 m3/s and H
d = 3.66 m. The same conditions as those in the
preceding analyses (see Figures 2 and 3) were considered: no bubble dissolution, and the effect of mass transfer for initial bubble diameters db of 2 and 8 mm. The simulations were performed for β= 0.11, α=
0.050, and γ = 2.09. Model predictions and experimental data agree well with the reference case of no
dissolution. For db = 8 mm, the values of uc and b totally overlap with the reference case. This clearly shows that for coarse bubbles, dissolution is negligible at the present fl ow conditions. For db = 2 mm, the values of uc shown in Figure 4(a) were up to about 4% lower than the reference case, while the values of b shown in Figure 4(b) were up to about 1% higher. These results indicate that for the present case, dissolution has
a negligible impact on bubble plume hydrodynamics. Regarding the impact of turbulence, if a value of γ=
1.0 were used (instead of γ= 2.09), the deviations from the values shown in Figure 4 would be up to about 33%. For this case (γ= 2.09), the bubble plumes can be considered weaker than in the previous conditions shown in Figures 2 and 3 (γ= 1.25 - 1.46).
We also investigated the axial variation of bubble diameter by comparing present model simulations with those from classical bubble plume models accounting for mass transfer, including applications for both aeration and oxygenation under deeper water conditions.
Figure 3 - Comparison between model predictions and experimental data of Fannelop and Sjoen (1980) for Qg,a = 0.01 m3
/s and Hd = 10 m: (a) centerline liquid velocity, and (b) plume radius. Simulations are performed for β = 0.81, α = 0.077 and γ = 1.46, and under three conditions: no dissolution, and dissolution of air bubbles with diameters db of 2 and 8 mm.
Figure 4 - Comparison between model predictions and experimental data of Milgram and Van Houten (1982) for Qg,a = 0.0005 m3
In Figure 5 we compare predictions of bubbles’ diameter db variations with z using the present model and that of Wüest et al. (1992), which was applied to a lake with a diffuser depth Hd = 65 m, including
two modes of operation: aeration, using an initial bubble diameter db = 12 mm and an air volumetric
fl ow rate Qg,a = 0.014 m3/s; and oxygenation, using an initial bubble diameter d
b = 2 mm and an oxygen
volumetric fl ow rate Qg,a = 0.0062 m3/s. Figure 5(a) shows that the models agree very well with the case of aeration, with deviations of less than 10%. A gradual increase in bubble diameter from 12 to about 20 mm is clearly seen, which demonstrates that bubble expansion dominates bubble dissolution, as expected for such aeration systems. Figure 5(b) shows a reasonably good agreement between the present model simulation and that of Wüest et al. (1992) for the case of oxygenation, with deviations of up to about
40%. Nonetheless, both models provided a complete dissolution of the bubbles at about z = 40 m. This is
expected in fi ne-bubble systems, which are commonly used for hypolimnetic oxygenation. Overall, the
simulations shown in Figures 5(a) and 5(b) suggest that the present model is appropriate to describe both the aeration and oxygenation process.
In Figure 6 we compare predictions of bubbles’ diameter db variations with z using the present model and 1D integral and computational fl uid dynamics (CFD) models used by Buscaglia et al. (2002) to evaluate the effects of aeration plumes in a large combined sewage/stormwater reservoir, including the following conditions: initial bubble diameter db = 5 mm, water depth Hd = 77 m, and two air volumetric fl ow rates
of Qg,a = 0.00254 and 0.0254 m3/s. The present model shows a very similar behavior as those obtained
from 1D and CFD models, with deviations of less than 10% for both fl ow conditions. It is interesting to
observe that the model proposed herein reproduced well a zone dominated by bubble dissolution, in which
db decreases with z [up to about z = 60 m in Figure 6(a) and z = 50 m in Figure 6(b)], followed by a zone dominated by bubble expansion, in which db increases with z. Furthermore, it can be seen that an increase in the air fl ow rate Qg,a from 0.00254 to 0.0254 m3/s resulted in
fi nal simulated values of db (at z = 77 m) increasing from about 4.5 mm [see Figure 6(a)] to 5.5 mm [see Figure 6(b)], respectively. This clearly shows the impact of reduced bubble contact time on db for the higher air fl ow rate, which resulted in larger bubbles reaching the water surface.
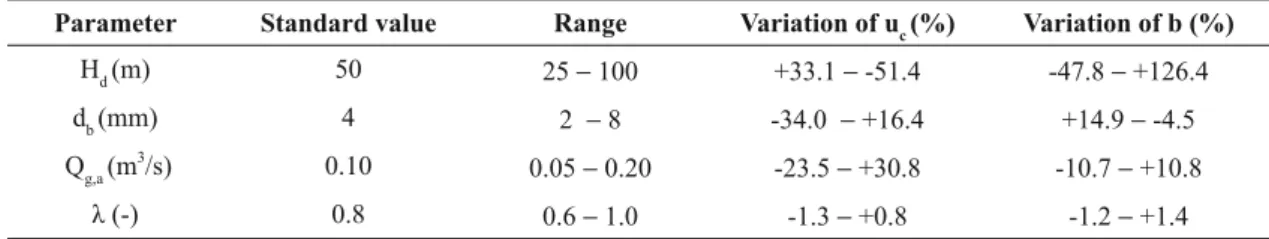
A sensitivity analysis was conducted to investigate the effect of each relevant parameter (Hd, db, Qg,a,
and λ) on bubble plume hydrodynamics, for both modes of operation: aeration and oxygenation. Observe
that the other relevant parameters (α, γ, us, and KL) were not included because they are already calculated as a function of Hd, db and/or Qg,a. Tables I and II show that the impact of Hd, db and Qg,a on the variations of uc
and b can be signifi cant (from about 10 to 150%). Contrastingly, the impact of λ (using the typical ranges reported by Lima Neto 2012a, b) was negligible (< 3%). It is also interesting to point out that, as expected, the impact of the parameters was higher for the oxygenation mode than for the aeration mode (except for the effect of Qg,a on the variation of b, in which the results were of the same order of magnitude).
TABLE I
Sensitivity analysis of the present model: aeration mode.
Parameter Standard value Range Variation of uc (%) Variation of b (%)
Hd (m) 50 25 − 100 +33.1 − -51.4 -47.8 − +126.4
db (mm) 4 2 − 8 -34.0 − +16.4 +14.9 − -4.5
Qg,a (m3
/s) 0.10 0.05 − 0.20 -23.5 − +30.8 -10.7 − +10.8
λ (-) 0.8 0.6 − 1.0 -1.3 − +0.8 -1.2 − +1.4
TABLE II
Sensitivity analysis of the present model: oxygenation mode.
Parameter Standard value Range Variation of uc (%) Variation of b (%)
Hd (m) 50 25 − 100 +56.6 − -67.3 -50.6 − +157.4
db (mm) 4 2 − 8 -49.8 − +35.5 +25.6 − -9.4
Qg,a (m3
/s) 0.10 0.05 − 0.20 -27.7 − +36.9 -9.1 − +9.0
λ (-) 0.8 0.6 − 1.0 -1.9 − +2.8 -2.3 − +2.7
Figure 5 - Comparison between present model simulations and those from the integral model of Wüest et al. (1992): Hd = 65 m and (a) initial bubble diameter db = 12 mm and Qg,a = 0.014 m3/s (aeration); and (b) initial bubble diameter db = 2 mm and
Qg,a = 0.0062 m3
/s (oxygenation).
Figure 6 - Comparison between present model simulations and those of Buscaglia et al. (2002) considering both 1D integral and computational fl uid dynamics (CFD) models: initial bubble diameter db = 5 mm, Hd = 77 m and (a)Qg,a = 0.00254 m3/s; and (b)Qg,a = 0.0254 m3
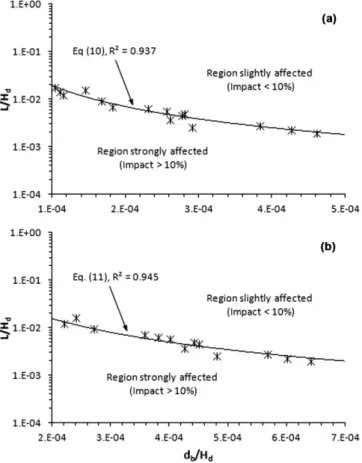
to indicate whether the fl ow conditions were susceptible or not to the effect of mass transfer. Therefore, the regions in Figures 7(a) and 7(b) located above the adjusted curves represent the fl ow conditions slightly affected by mass transfer (i.e., the regions with relatively large values of Qg,a and db where the deviations of uc are smaller than 10%). In this case, bubble plume hydrodynamics can be predicted disregarding mass transfer. On the other hand, the regions located below the curves represent the fl ow conditions strongly affected by mass transfer (i.e., the regions with relatively small values of Qg,a and db where the deviations of uc are higher than 10%). For such cases, a model that includes the effect of mass transfer (such as the present model or the CFD model of Buscaglia et al. 2002) must be used in order to accurately predict bubble plume hydrodynamics.
Aeration:
1.483
8
2.28 10
bd d
d
L
H
H
−
−
⎛
⎞
=
⋅
⎜
⎟
⎝
⎠
(R2 = 0.937) (10)Figure 7 - Dimensionless correlations to predict the impact of mass transfer on bubble plume hydrodynamics for (a) aeration and (b) oxygenation systems. Stars represent model simulations for different values of db/Hd and L/Hd that resulted in a maximum deviation of uc of 10%, as compared to the reference case of no bubble dissolution. The parameter L is a length scale given by
(
2)
1 5,
g a
Oxygenation:
1.649
8
1.24 10
bd d
d
L
H
H
−
−
⎛
⎞
=
⋅
⎜
⎟
⎝
⎠
(R2 = 0.945) (11)CONCLUSIONS
In this study, we incorporated a gas-liquid mass transfer submodel into an integral model for unstratifi ed bubble plumes based on the Gaussian type self-similarity and new functional relationships for the entrainment coeffi cient and momentum amplifi cation factor. The impact of mass transfer on bubble plume
hydrodynamics was investigated for different bubble sizes, gas fl ow rates and water depths. The results
were compared to a wide range of laboratory and fi eld-scale data available in the literature, including both weak bubble plumes (i.e., with relatively low gas fl ow rates and high water depths and slip velocities), where the effect of turbulence was important, and strong bubble plumes, where turbulence was negligible. It was clearly seen that coarse bubbles have a slight effect on bubble plume hydrodynamics, even for deeper water conditions. On the other hand, for moderate water depths, dissolution can impact bubble plume hydrodynamics if fi ne bubbles are used. It was also shown that the momentum amplifi cation factor had an important effect on bubble plume hydrodynamics, specially for weak bubble plumes. In many cases analyzed here, both dissolution and turbulence affected bubble plume hydrodynamics, which demonstrates the importance of taking the momentum amplifi cation factor relationship into account.
Simulations of bubble dissolution using the present model and classical models available in the literature resulted in a very good agreement, including both aeration and oxygenation modes of operation under deeper water conditions. Sensitivity analysis of model parameters also showed that the water head above the diffuser, initial bubble diameter and gas fl ow rate are the most important parameters that affect bubble plume hydrodynamics. Lastly, dimensionless correlations were proposed to verify the impact of mass transfer on bubble plume hydrodynamics, including both aeration and oxygenation systems. These correlations are important to help researchers/practitioners decide whether considering or not mass transfer to model the fl ow circulation induced by bubble plumes for applications including surface aeration, algal displacement, sediment suspension, and so on. Note that neglecting mass transfer would make the analysis much simpler, provided no interaction with the ambient water quality would be required for the simulations.
ACKNOWLEDGMENTS
This work has been fi nancially supported by the Conselho Nacional de Desenvolvimento Científi co e
Tecnológico (CNPq) (Project 476430/2011-9). The second author also thanks the scholarship from the
Fundação Cearense de Apoio ao Desenvolvimento Científi co e Tecnológico (FUNCAP).
RESUMO
são consideradas, mesmo para moderadas profundidades da água. Além disso, as simulações do modelo indicaram que para plumas de bolhas fracas (ou seja, com vazões gasosas relativamente baixas e profundidades de água e velocidades relativas elevadas), tanto a dissolução como a turbulência podem afetar a hidrodinâmica das plumas, o que demonstra a importância de se levar em conta o fator de amplifi cação da quantidade de movimento. Para condições de águas mais profundas, simulações dos processos de dissolução e descompressão das bolhas utilizando o modelo atual e modelos clássicos disponíveis na literatura forneceram resultados semelhantes tanto para sistemas de aeração como de oxigenação. Análise de sensibilidade mostrou que a profundidade da água, seguida do tamanho das bolhas e da vazão gasosa são os parâmetros que mais afetam a hidrodinâmica das plumas. Finalmente, correlações adimensionais são propostas para avaliar o impacto da transferência de massa na hidrodinâmica das plumas, incluindo tanto sistemas de aeração como de oxigenação.
Palavras-chave: aeração, bolhas, hidrodinâmica, transferência de massa, modelagem, oxigenação.
REFERENCES
BUSCAGLIA GC, BOMBARDELLI FA AND GARCÍA MH. 2002. Numerical modeling of large-scale bubble plumes accounting for mass transfer effects. Int J Multiphase Flow 28: 1763-1785.
CEDERWALL K AND DITMARS JD. 1970. Analysis of air-bubble plumes. Rep. No. KH-R-24, W. M. Keck Laboratory of Hydraulics and Water Resources, Division of Engineering and Applied Science, CA Institute of Technology, Pasadena, CA.
EINARSRUD KE AND BREVIK I. 2009. Kinetic energy approach to dissolving axisymmetric multiphase plumes. J Hydraul Eng 135: 1041-1051.
FANNELÖP TK AND SJÖEN K. 1980. Hydrodynamics of underwater blowouts. AIAA 8th
Aerospace Sciences Meeting, January 14-16, Pasadena, CA, AIAA paper, 80-0219.
JOHANSEN Ø. 2003. Development and verification of deep-water blowout models. Mar Pollut Bull 47: 360-368. LEITCH AM AND BAINES WD. 1989. Liquid volume flux in a weak bubble plume. J Fluid Mech 205: 77-98. LIMA NETO IE. 2012a. Bubble plume modelling with new functional relationships. J Hydraul Res 50: 134-137.
LIMA NETO IE. 2012b. Modeling the liquid volume flux in bubbly jets using a simple integral approach. J Hydraulic Eng 138: 210-215.
LIMA NETO IE, ZHU DZ AND RAJARATNAM N. 2008a. Air injection in water with different nozzles. J Env Eng 134: 283-294. LIMA NETO IE, ZHU DZ AND RAJARATNAM N. 2008b. Bubbly jets in stagnant water. Int J Multiphase Flow 34: 1130-1141. LIMA NETO IE, ZHU DZ AND RAJARATNAM N. 2008c. Effect of tank size and geometry on the flow induced by circular bubble
plumes and water jets. J Hydraulic Eng 134: 833-842.
MCGINNIS DF, LORKE A, WÜEST A, STÖECKLI A AND LITTLE JC. 2004. Interaction between a bubble plume and the near field in a stratified lake. Water Resour Res 40: W10206.
MILGRAM HJ. 1983. Mean flow in round bubble plumes. J Fluid Mech 133: 345-376. MILGRAM HJ AND VAN HOUTEN RJ. 1982. Plumes from sub-sea well blowouts. Proc. 3rd
Intl. Conf. BOSS Cambridge MA 1: 659-684.
SINGLETON VL AND LITTLE JC. 2006. Designing Hypolimnetic Aeration and Oxygenation Systems – A Review. Environ Sci Technol 40: 7512-7520.
SOCOLOFSKY SA, BHAUMIK T AND SEOL DG. 2008. Double-plume integral models for near-field mixing in multiphase plumes. J Hydraul Eng 134: 772-783.
SOCOLOFSKY SA, CROUNSE BC AND ADAMS EE. 2002. Multiphase plumes in uniform, stratified, and flowing environments. Environmental fluid mechanics theories and applications, Shen H, Cheng A, Wang KH, Teng MH and Liu C (Eds), ASCE, Reston, VA, p. 85-125.
WÜEST A, BROOKS NH AND IMBODEN DM. 1992. Bubble plume modeling for lake restoration. Water Resour Res 28: 3235-3250. YAPA PD AND CHEN F. 2004. Behavior of oil and gas from deepwater blowouts. J Hydraulic Eng 130: 540-553.