Acta Scientiarum
http://www.uem.br/acta ISSN printed: 1679-9275 ISSN on-line: 1807-8621
Doi: 10.4025/actasciagron.v37i4.19676
Evaluation of the spatial dependence of dendrometric characteristics
for an
Eucalyptus
plantation
Rodolfo Marcondes Silva Souza1, André Quintão de Almeida2*, Aristides Ribeiro3, Eduardo Soares de Souza1 and Fernando Palha Leite4
1
Unidade Acadêmica de Serra Talhada, Universidade Federal Rural de Pernambuco, Fazenda Saco, Serra Talhada, Pernambuco, Brazil. 2
Centro de Ciências Agrárias Aplicadas, Departamento de Engenharia Agrícola, Universidade Federal de Sergipe, Av. Marechal Rondon, s/n.º, 49100-000, Jardim Rosa Elze, São Cristóvão, Sergipe, Brazil. 3Departamento de Engenharia Agrícola, Universidade Federal de Viçosa, Viçosa, Minas Gerais, Brazil. 4Departamento de Pesquisa, Celulose-Nipo-Brasileira, Belo Oriente, Minas Gerais, Brazil. *Author for correspondence. E-mail: andreqa@gmail.com
ABSTRACT. Geostatistics evaluates the spatial dependence between two or more variables in order to estimate unknown values in space. The objective of this study was to evaluate, using geostatistical techniques, the spatial variability of dendrometric characteristics for a commercial plantation of Eucalyptus grandis x Eucalyptus urophylla located in eastern Minas Gerais, Brazil (19º28’ S and 42º49’ W). The diameter at breast height (DBH) and commercial height (H) of 60 trees was measured in a forest inventory plot at two, five and seven years old. The volume of each tree in the plot was estimated from allometric equations and values of DBH and H. Spatial dependence of the three dendrometric variables at different ages was evaluated by fitting the experimental semivariogram. Validation of the semivariograms was performed using the jackknife test. The dendrometric variables analyzed presented normal distribution throughout the entire production cycle according to the Kolmogorov-Smirnov test. The spherical model adequately represented the spatial distribution of dendrometric characteristics for the planted forest. The dendrometric characteristics of the analyzed plantation had an average spatial dependence, making the use of geostatistical techniques for characterization of the plantation very important.
Keywords: geostatistics, kriging, precision forestry.
Estudo da dependência espacial das características dendrométricas de um plantio
comercial de eucalipto
RESUMO. A geoestatística avalia a dependência espacial entre duas ou mais variáveis com a finalidade de estimar valores desconhecidos no espaço. O objetivo deste trabalho foi avaliar, a partir de técnicas Geoestatísticas, a variabilidade espacial das características dendrométricas de um plantio comercial de
Eucalyptusgrandis x urophylla localizado (19º28’ S e 42º49’ W) no leste de Minas Gerais. O diâmetro altura do peito (DAP) e a altura comercial (H) de 60 árvores foram medidos em uma parcela de inventário florestal, aos dois, cinco e sete anos de idade. A partir de equações alométricas e dos valores de DAP e H foi estimado o volume de cada árvore da parcela. A dependência espacial das três variáveis dendrométricas, nas diferentes idades, foi avaliada a partir do ajuste do semivariograma experimental. A validação dos semivariogramas foi realizada a partir do teste Jack-Knifing. As variáveis dendrométricas analisadas apresentaram distribuição normal durante todo ciclo de produção de acordo com o teste Kolmogorov-Smirnov. O modelo esférico foi adequado para representar a distribuição espacial das características dendrométricas da floresta plantada. Pode-se concluir que, as características dendrométricas do plantio analisado apresentaram média dependência espacial, sendo portanto, de fundamental importância a utilização de técnicas de geoestatística na caracterização do plantio.
Palavras-chave: geoestatística, krigagem, silvicultura de precisão.
Introduction
Dendrometric characterization and productivity estimation of commercial eucalyptus plantations are performed using sample plots (through a forest inventory), based on the sampling theory. Forest inventories are essential for the proper management of planted
eucalyptus forests (MELLO et al., 2009).
results regarding existing aspects because the hypothesis of occurrence of spatial dependence is ignored (GREGO; VIEIRA, 2005).
Geostatistical techniques have been used in the study of spatial dependence in commercial plantations of forest species (MELLO et al., 2005a and b; 2009; GUEDES et al., 2012), serving as an important tool in precision forestry. Use of these techniques not only identifies the existence of spatial dependence between observations but can also be applied in mapping, orientation of future sampling and in modeling, which estimates the values of certain attributes in unsampled locations. Therefore, geostatistics is an important tool for estimating dendrometric characteristics as an efficient and low-cost method for guiding management techniques in planted forest areas.
Based on the theory of regionalized variables, geostatistics assesses the spatial correlation between inventoried characteristics by adjusting the experimental semivariogram. From the semivariogram parameters (range, sill, nugget effect, etc.) and the kriging geostatistical interpolator, it is possible to estimate the dendrometric variables in unsampled locations using the forest inventory (MENG et al., 2009).
The objective of this study was to evaluate the spatial variability of the main dendrometric characteristics for a commercial plantation of E. grandis x E. urophylla located in eastern Minas Gerais, Brazil, using descriptive statistics and geostatistical techniques.
Material and methods
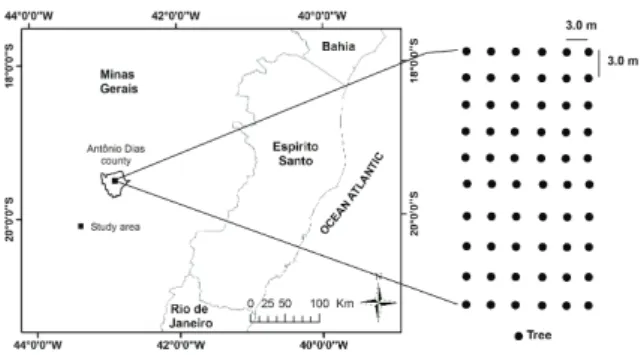
This study was conducted in a commercial plantation of the E. grandis x E. urophylla hybrid. The 40 ha plantation is located near the city of Antonio Dias, in the eastern region of Minas Gerais, Brazil (latitude: 19º28’S, longitude: 42º49’W, average elevation: 975 m) (Figure 1). According to the Köppen classification, the climate is considered cold and wet (Cwa), with precipitation events occurring throughout the year. The average annual rainfall is 1,281 mm and the average annual temperature and relative humidity are 20.3ºC and 71.2%, respectively. The plantation is composed of trees of the same clone that were planted in May 2003. Spacing between trees at planting was 3.0 x 3.0 m, with a density of approximately 1000 trees per hectare. Ant and weed control was performed manually with pesticides. More information, see Almeida et al. (2013).
Figure 1. Study area location with plot design.
Dendrometric variables were measured in a rectangular plot of forest inventory with an area of 0.0405 ha. Evaluations were performed during the seven-year culture cycle, always during the second month of the year in 2005, 2008 and 2010, corresponding to trees at three, five and seven years old, respectively. In the plot, the diameter at breast height (DBH, in centimeters) and the commercial height (H in meters) of 60 trees was measured. The DBH was measured with a caliper at a height of 1.30 m. The height of each tree was measured using a Suunto height meter at a distance less than 10 meters from each tree. After collecting the inventory data, the volume of each tree with bark (Vtree, in cubic meters) was estimated from biometric models calibrated in eucalyptus plantations located near the study area (Equation 1). More information can be found in the work of Silva et al. (2008).
ξ
+ +
+
= 10.0708 1.8373LnDBH 1.0964LnH
LnVtree − (1)
where:
Vtree, is the volume of each tree (m3); DBH is the diameter at breast height (cm); H is the height of each tree (m); Ln is the natural logarithm; and ξ is the random error.
The mean, minimum and maximum values, standard deviation and coefficient of variation (CV) of the data were calculated. The variability was classified using the CV values low (CV < 10%), medium (10% < CV < 20%), high (20 < CV < 30%) and very high (CV > 30%) according to Pimentel-Gomes and Garcia (2002). The hypothesis of normality of the data was evaluated by the Kolmogorov-Smirnov test.
Geostatistics for an Eucalyptus plantation 485
(
)
[
]
−
N(h) = i ii
+
h
Z(x
)
x
Z
(h)
=
γ
(h)
1 22N
1
(2) where:γ(h) is the semivariogram functio n, Z(xi + h) is the value of the variable at the point xi + h, Z(xi) is the variable value at the point xi, N(h) is the number of pairs separated by a distance h and xi, is a position measurement.
Only isotropic semivariograms were considered in this study. Some theoretical semivariogram models were previously adjusted as spherical, exponential, Gaussian and cubic by the methods set through the Weight Least Squares (WLS). Choosing the best results (through an adjustment method and model) was based on the validation of semivariograms using the jackknife test, which evaluates the consistency of the data estimated by a kriging interpolation based on an adjusted experimental semivariogram. Each point in the data set is used to estimate values, considering its neighbors, and is compared with the actual value. The absolute error is the difference between the observed values of Z(xi), and the estimated values of Z(xi), and the reduced error is the ratio between the absolute error and the standard deviation of the estimate. The estimate is considered appropriate when the mean (μjk) and variance (σjk) of the reduced error are close to zero and one, respectively (VIEIRA et al., 2002; 2010).
The experimental semivariograms were adjusted to the spherical model, expressed by:
a h a h a h C + C =
γ(h) 0 ≤ ≤
− 0 ; 0.5 1.5 3 (3)
a
>
+
C
=
γ
(h)
0C;
h
(4)where:
C0 is the nugget effect, C0 + C is the threshold, h is the distance between two points and A is the range of spatial dependence.
The degree of spatial dependence (DSD) is the percent relationship between the nugget effect (C0) in relation to the sill, given by the sum of the nugget effect and the structured variation (C). Classification of the DSD was performed according to Cambardella et al. (1994) as: high degree of spatial dependence (DSD < 25%), medium
degree of spatial dependence (25 ≤ DSD ≤ 75%) and low degree of spatial dependence (DSD > 75%).
Results and discussion
The results of the statistical analysis and the coefficients of the Kolmogorov-Smirnov test are presented in Table 1. The range between the maximum (ValMax) and minimum (ValMin) increased for all variables over time, except for plant height. The coefficients of variation of DBH and H were less than 12%, which, according to the criteria established by Pimentel-Gomes and Garcia (2002), indicate low variability. This behavior is expected, despite knowing that several factors such as climate, soil, silvicultural practices and population genetics can create disuniformity in a forest. Volume-presented variability was classified as average in all assessments, which may be because this variable was obtained from an equation. The height and volume of the plants showed higher coefficients of variation for the measurements performed at five years of age, followed by a reduction in the last year. Despite the higher CV values, they were still lower than those found by Guedes et al. (2012) in eucalyptus plantations in Minas Gerais State, Brazil.
The maximum differences between the observed and theoretical frequencies were lower than the coefficient of the Kolmogorov-Smirnov test at 5% probability, confirming that these variables have a normal distribution (Table 1). A similar result was found in the study of Kanegae Júnior et al. (2007). Data normality ensures optimal statistical properties, such as maximum likelihood (DIGGLE; RIBEIRO JUNIOR, 2007).
Table 1. Statistical analysis and Kolmogorov-Smirnov test results of the diameter at breast height (DBH), total height (H) and volume (Vtree) of E.grandis x E. urophylla trees at 2, 5 and 7 years old. Maximum (ValMax), minimum (ValMin), standard deviation (StdDev),
coefficient of variation (CV).
DBH2years DBH5years DBH7years H2years H5years H7years Vtree2years Vtree 5yeas Vtree 7years
--- cm --- --- m --- --- m3 ---
Mean 12.22 17.44 17.99 17.78 24.50 25.59 0.12 0.24 0.29 ValMax 16.10 19.50 20.60 19.50 27.20 28.40 0.17 0.34 0.41
ValMin 11.20 13.80 14.10 15.60 21.20 23.00 0.07 0.14 0.17
StdDev 1.03 1.34 1.42 0.84 1.29 1.08 0.02 0.05 0.05 CV (%) 7.26 7.66 7.92 4.71 5.28 4.22 16.99 18.86 17.77
|F(O) - F(t)|MAX 0.076 * 0.096 * 0.082 * 0.123 * 0.143 * 0.099 * 0.073 * 0.084 * 0.062 *
|F(O) - F(t)|MAX = Maximum difference between the observed and theoretical frequency. DKS (p < 0.05) = 0.176. If |F(O) – F(t)|MAX < DKS, accept the hypothesis. *Normal Distribution.
Table 2. Parameters of the adjusted semivariogram for the values of diameter at breast height (DBH), total height (H) and volume (Vtree) of E. urophylla x E.grandis trees at 2, 5 and 7 years old.
Variable C0 C A (m) DSD (%) r 2
jk jk
DBH2years 0.50 0.69 7.8 57.98 0.996 -0.01 0.76
DBH5years 0.80 1.15 7.3 58.97 0.998 -0.02 0.76
DBH7years 1.00 1.20 7.0 54.55 0.987 -0.02 0.73
H2years 0.30 0.52 13.0 63.41 0.976 0.00 0.94
H5years 0.60 1.18 7.3 66.29 0.999 0.01 0.75
H7years 0.60 0.80 9.0 57.14 1.000 0.00 0.81
Vtree2years 0.00015 0.00028 8.5 65.12 0.940 -0.01 0.83
Vtree 5yeas 0.00080 0.00145 7.0 64.44 0.913 -0.01 0.77
Vtree 7years 0.00100 0.00185 7.0 64.91 0.974 -0.02 0.81
Geostatistics for an Eucalyptus plantation 487
In general, parameters of the semivariograms were more similar between years 5 and 7 than years 2 and 5 although, according to the t-test, dendrometric characteristic increases were significant for all variables between measurements.
The degree of spatial dependence, taking into account all variables and measurements, ranged from 33.71 to 45.45% and was classified as average in accordance with the criteria established by Cambardella et al. (1994). These values were higher than those found by Lima et al. (2010), where the DSD was less than 24.3% for exponential and Gaussian semivariogram models. Carvalho et al. (2012) encountered a DSD classified as average when assessing the height of eucalyptus trees, using the Gaussian model to adjust the semivariogram. Kanegae Júnior et al. (2007) reported values ranging from 0.0 to 100% for timber volume at different ages and for various model semivariograms. Variation of the DSD is dependent on several factors, such as the variable studied, age of the plantation and the adjusted semivariogram model.
The coefficients of determination between the theoretical and experimental semivariograms were close to one, indicating good correlation between these semivariograms (Table 2). With respect to the jackknife test, it was found that the reduced error presented mean values sufficiently close to zero and a variance between 0.77 and 0.94, indicating that the spherical semivariogram model adequately represented the spatial distribution of all dendrometric characteristics of Eucalyptus for different ages of the population.
Figure 3 shows the spatial distribution maps of the dendrometric characteristics generated from kriging. It was verified that the largest ranges occured for the DBH and Vtree at 7 years, corresponding to 4.0 cm and 0.155 m3, respectively.
The greatest amplitude for plant height was found at 5 years, where this value was equal to 4.0 m. From a visual analysis of the maps, it can be observed that the DBH and Vtree showed similar spatial patterns in all periods of measurement. Considering an average annual increase in timber of 40 m3 ha-1 year-1, it was found that in the second year, the entire plot presented values exceeding the desired productivity, while in the fifth and seventh year, approximately 5 and 42% of the area was below the desired productivity, respectively.
Figure 3. Spatial distribution maps of the diameter at breast height (DBH), total height (H) and volume of E. grandis x E. urophylla trees in a commercial plantation.
Conclusion
Among the variables analyzed, the highest coefficients of variation were found in timber volume. The geostatistical analysis showed that all of the characteristics analyzed presented an average degree of spatial dependence. The spherical model was adequate to represent the spatial distribution of the dendrometric characteristics for the planted forest.
The applied modeling allowed for estimating the values of diameter at breast height, total height and volume in all assessment periods, as well as the range and magnitude of the spatial dependence of each dendrometric variable, where the use of geostatistical techniques for characterization of the plantation is very important.
Acknowledgements
References
ALMEIDA, A. Q.; RIBEIRO, A.; LEITE, F. P. Modelagem do balanço hídrico em microbacia cultivada com plantio comercial de Eucalyptus grandis x urophylla no leste de Minas Gerais, Brasil. Revista Árvore, v. 37, n. 3, p. 547-556, 2013.
CAMBARDELLA, C. A.; MOORMAN, T. B.; NOVAK, J. M.; PARKIN, T. B.; KARLEN, D. L.; TURCO, R. F.; KONOPKA, A. E. Field-scale variability of soil properties in Central Iowa soils. Soil Science Society American Journal, v. 58, n. 4, p. 1501-1511, 1994.
CARVALHO, M. P.; MENDONÇA, V. Z.; PEREIRA, F. C. B. L.; ARF, M. V.; KAPPES, C.; DALCHIAVON, F. C. Produtividade de madeira de eucalipto correlacionada com atributos do solo visando ao mapeamento de zonas específicas de manejo. Ciência Rural, v. 42, n. 10, p. 1797-1803, 2012.
DIGGLE, P. J.; RIBEIRO JÚNIOR, P. J. Model based geostatistics. Londron: Springer, 2007.
GREGO, C. R.; VIEIRA, S. R. Variabilidade espacial de propriedades físicas do solo em uma parcela experimental.
Revista Brasileira de Ciência do Solo, v. 29, n. 2, p. 169-177, 2005.
GUEDES, I. C. L.; MELLO, J. M.; MELLO, C. R.; OLIVEIRA, A. D.; SILVA, S. T.; SCOLFORO, J. R. S.
Técnicas geoestatísticas e interpoladores espaciais na
estratificação de povoamentos de Eucalyptus sp. Ciência Florestal, v. 22, n. 3, p. 541-550, 2012.
KANEGAE JÚNIOR, H.; MELLO, J. M.; SCOLFORO, J. R. S.; OLIVEIRA, A. D. Avaliação da continuidade espacial de características dendrométricas em diferentes idades de povoamentos clonais de Eucalyptus sp. Revista Árvore, v. 31, n. 5, p. 859-866, 2007.
LIMA, C. G. R.; CARVALHO, M. P.; NARIMATSU, K. C. P.; SILVA, M. G.; QUEIROZ, H. A. Atributos físico-químicos de um latossolo do cerrado brasileiro e sua correlação com características dendrométricas do eucalipto. Revista Brasileira de Ciência do Solo, v. 34, n. 1, p. 163-173, 2010.
MELLO, J. M.; BATISTA, J. L. F.; RIBEIRO JÚNIOR, P. J.; OLIVEIRA, M. S. Ajuste e seleção de modelos
espaciais de semivariogramas visando à estimativa de volumétrica de Eucalyptus grandis. Scientia Florestalis, v. 3, n. 69, p. 25-37, 2005a.
MELLO, J. M.; BATISTA, J. L. F.; OLIVEIRA, M. S.; RIBEIRO JÚNIOR, P. J. Estudo da dependência espacial de características dendrométricas para Eucalyptus grandis.
Cerne, v. 11, n. 2, p. 113-126, 2005b.
MELLO, J. M.; DINIZ, F. S.; OLIVEIRA, A. D.; MELLO, C. R.; SCOLFORO, J. R. S.; ACERBI JÚNIOR, F. W. Continuidade espacial para características dendrométricas (número de fustes e volume) em plantios de Eucaliptus grandis.
Revista Árvore, v. 33, n. 1, p. 185-194, 2009.
MENG, Q.; CIESZEWSKI, C.; MADDEN, M. Large area forest inventory using Landsat ETM+: a geostatistical approach. Journal of Photogrammetry and Remote Sensing, v. 64, n. 1, p. 27-36, 2009.
PIMENTEL-GOMES, F.; GARCIA, C. H. Estatística aplicada a experimentos agronômicos e florestais: exposição com exemplos e orientações para uso de aplicativos. São Paulo: Fealq, 2002.
SILVA, R. F.; SOARES, C. P. B.; JACOVINE, L. A. G.; SILVA, M. L.; LEITE, H. G.; SILVA, G. F. Projeção do estoque de carbono e análise da geração de créditos em povoamentos de eucalipto. Revista Árvore, v. 32, n. 6, p. 979-992, 2008.
VIEIRA, S. R.; CARVALHO, J. R. P.; GONZÁLEZ, A. P. Jack knifing for semivariogram validation. Bragantia, v. 69, suppl., p. 97-105, 2010.
VIEIRA, S. R.; MILLETE, J.; TOPP, G. C.; REYNOLDS, W. D. Handbook for geostatistical analysis of variability in soil and climate data. In: ALVEREZ, V. V. H.; SCHAEFER, C. E. G. R.; BARROS, N. F.; MELLO, J. W. V.; COSTA, L. M. (Ed.). Tópicos em Ciência do Solo. Viçosa: SBCS, 2002. v. 2, p. 1-45.
Received on January 29, 2013. Accepted on June 4, 2013.