Nome: Cátia Andreia Leal da Costa
Endereço eletrónico: [email protected]
Cartão do Cidadão: 14736435
Título da Dissertação de Mestrado:
Assessing the role of climate variability on grape berry quality parameters in Portugal
Orientadores:
Doutor António Rocha Graça
Professor Doutor Hernâni Varanda Gerós
Ano de conclusão: 2018 Designação do Mestrado:
Biologia Molecular, Biotecnologia e Bioempreendedorismo em Plantas
É autorizada a reprodução integral desta dissertação apenas para efeitos de investigação, mediante declaração escrita do interessado, que a tal se compromete.
Universidade do Minho, _____/_____/_________
A
CKNOWLEDGMENTSTo my supervisor, Dr. António Graça, who granted me the opportunity to work in his group in Sogrape Vinhos S. A. company and allowed me to meet and follow other ongoing projects. I have learned a lot from him.
To Prof. Hernâni Gerós for his essential orientation from the University of Minho, but above all for his support and for always believing in me.
A special thanks to Prof. João Santos from UTAD for providing climatic data and for the support and fundamental role during the accomplishment of the work.
To the company Sogrape Vinhos S.A., in particular:
- To the members of R&D department: Natacha Fontes, Sara Silva and Marta Teixeira always willing to help. Thank you for your companionship.
- To Joana Martins for helping me with the geographic information software (QGIS). To Eugénio, for the patience and for always being my first support.
To my parents and sister, for being the first to believe in me, for the patience and the best advice. Without them, this journey would not be possible. A heartfelt thanks.
A vida é feita de nadas: De grandes serras paradas À espera de movimento; De searas onduladas Pelo vento. De casas de moradia Caídas e com sinais De ninhos que outrora havia Nos beirais; De poeira; De sombra de uma figueira; De ver esta maravilha: Meu Pai a erguer uma videira Como uma Mãe que faz a trança à filha.
A
BSTRACTClimate is a strong modulator of grape berry composition. Over the last decades, model projections have shown that ongoing climate changes are to continue in the future, but the direction and degree of climate change impact on fruit composition of winegrape cultivars is puzzling. Thus, the study how climatic variables, namely temperature and precipitation, have impacted berry composition during the last decades is of utmost importance to understand future scenarios.
This was the main idea of the present study that was carried out in three Portuguese wine regions – Douro, Dão and Alentejo – and targeted two varieties with a strong national importance (Touriga Nacional and Aragonez). Berry weight, titratable acidity (TA), pH, probable alcohol (PA), anthocyanins and total phenols index (TPI) data, which were collected two to three weeks after the end of the véraisonuntil technological maturity for > 10 years, since 1991 in Douro, 2004 in Alentejo and 2008 in Dão, were collected and compiled into a database. Climatic data were obtained from automatic weather stations (owned by Sogrape Vinhos S.A.) and from an estimated climatic database (provided by UTAD) at a very-high resolution grid (<1 Km). The influence of climate variables - monthly average (TG), maximum (TX) and minimum (TN) air temperature (November-October) and precipitation totals (April to June and July to September) – on the above-mentioned berry quality parameters was explored through correlation analyses. This approach was a starting point to identify the months/periods more influential in grape berry composition, as well as the most affect vineyards. Next, different statistical approaches were carried out to explore in detail the influence of climate variables in the vineyards identified as most affected previously.
Results showed that, at technological maturity, temperature was negatively correlated to berry weight, TA, anthocyanins and TPI, but was positively correlated to pH and PA. Moreover, in warmer regions the berry weight was lower, and TA, anthocyanins and TPI followed the same trend, while in colder regions, pH and PA were lower than in warmer regions. Besides, a clustering analysis showed significant temperature differences between years where the quality parameter was higher (cluster 1) and years where it was lower (cluster 2). Additionally, results showed that the temperature differences between clusters resulted from differences between warmer and colder years. Moreover, we showed that temperatures at véraison and maturation periods (namely June to August) are more influential in determining grape berry composition at maturity. Regarding precipitation, its influence was dependent on vineyard and variety. Results also suggested that the berry composition from Alentejo vines is more affected by inter-annual climate variability than Douro vines. Furthermore, Aragonez variety seems more resistant to climatic variations than Touriga Nacional.
The obtained results about the role of climate variability on grape berry quality parameters presented here provided important knowledge for the development of forecasting models. These models can predict changes in berry composition in response to changing climate.
R
ESUMOO clima é um forte modulador da composição do bago de uva. Nas últimas décadas, projeções modelo mostraram que as mudanças climáticas presentes devem continuar no futuro, mas a direção e a extensão do impacto das alterações climáticas na composição do bago da uva não são totalmente conhecidas. Assim, a compreensão de como as variáveis climáticas, nomeadamente a temperatura e a precipitação, influenciaram a composição do bago nas últimas décadas é de extrema importância para a compreensão de cenários futuros.
Esta foi a ideia principal do presente estudo que foi realizado em três regiões vitivinícolas portuguesas – Douro, Dão e Alentejo – e em duas variedades de forte importância nacional (Touriga Nacional e Aragonez). Dados de peso do bago, acidez titulável (AT), pH, álcool provável (AP), antocianinas e índice de fenóis totais (IFT) - medidos duas a três semanas após o fim do véraison até à fase de maturação tecnológica durante > 10 anos, desde 1991 no Douro, 2004 no Alentejo e 2008 no Dão - foram recolhidos e compilados numa base de dados. Os dados climáticos foram obtidos a partir de estações meteorológicas automáticas (pertencentes à Sogrape Vinhos S.A.) e a partir de uma base de dados climática estimada (fornecida pela UTAD) numa grelha de resolução muito elevada (<1 Km). A influência das variáveis climáticas - temperatura média (TG), máxima (TX) e mínima (TN) mensal (novembro-outubro) e totais de precipitação (abril a junho e julho a setembro) - nos parâmetros de qualidade do bago foi explorada através de análises de correlação. Esta abordagem constituiu um ponto de partida para identificar os meses/períodos mais influentes na composição do bago, bem como as vinhas mais afetadas. Depois seguiram-se diferentes abordagens estatísticas para explorar em detalhe a influência das variáveis climáticas nas vinhas anteriormente identificadas como as mais afetadas.
Os resultados mostraram que, à maturação tecnológica, a temperatura foi negativamente correlacionada com o peso do bago, AT, antocianinas e IFT, mas positivamente com o pH e o AP. Além disso, nas regiões mais quentes, o peso do bago foi menor, e a AT, antocianinas e IFT seguiram a mesma tendência, enquanto nas regiões mais frias o pH e o AP foram menores do que nas regiões mais quentes. Uma análise de agrupamento mostrou diferenças significativas de temperatura entre os anos em que o parâmetro de qualidade foi maior (grupo 1) e os anos em que foi menor (grupo 2). Adicionalmente, provou-se que as diferenças de temperatura entre grupos resultaram de diferenças entre os anos mais quentes e os mais frios. Mostrou-se ainda que as temperaturas na fase de pintor e na maturação (de junho a agosto) são mais determinantes na composição do bago à maturidade. Relativamente à variável climática precipitação, os resultados mostraram que o seu efeito foi dependente da vinha e da variedade. Os resultados mostraram ainda que a composição do bago das vinhas do Alentejo é mais afetada pela variabilidade climática inter-anual do que as vinhas do Douro. Além disso, a variedade Aragonez parece ser mais resistente às variações climáticas do que a Touriga Nacional.
Os resultados obtidos sobre o papel da variabilidade climática nos parâmetros de qualidade do bago da uva obtidos no presente trabalho constituem uma ferramenta importante para o desenvolvimento de modelos de previsão. Esses modelos podem prever mudanças na composição do bago em resposta às alterações climáticas.
T
ABLE OF CONTENTSAcknowledgments ... iii
Abstract ... v
Resumo ... vii
Figure list ... xi
Table list ... xiii
Abbreviations and acronyms ... xv
1. Introduction ... 3
1.1 Importance of climate change upon the global production of winegrapes and wine ... 3
1.2 Climate variability ... 5
1.3 Grape berry development and key solutes accumulation ... 6
1.4 Impact of environment on grape berry quality parameters ... 9
Phenolic content ... 9
Total soluble solids content ... 10
Titratable acidity ... 11
1.5 Economic and social impacts of climate changes on vineyards and wine industry ... 12
1.6 Objectives ... 13
2. Material and methods ... 17
2.1 Maturation database ... 17
Bunch sampling ... 18
Berry composition analysis ... 18
2.2 Selection of study regions ... 19
2.3 Climate data ... 25
2.4 Relationships of grape berry components with climate variables ... 26
2.5 Maturation data clustering ... 26
2.6 Temperatures analysis between maturation clusters ... 27
2.7 Statistical analysis ... 27
3. Results ... 31
3.1 Relationships of grape berry quality parameters with climate variables ... 31
Titratable acidity ... 32
pH...……… ... 33
Probable alcohol ... 33
Total phenols index ... 34
Anthocyanins ... 34
3.2 Climatic characterization of the studied regions ... 37
3.3 Patterns in grape berry composition at maturity between regions ... 38
3.4 Temperature differences between maturation clusters ... 40
3.5 Daily temperature analysis between maturation clusters ... 41
Berry weight and total phenols index in Alentejo ... 42
Anthocyanins, pH and probable alcohol in Alentejo ... 43
Titratable acidity in Dão ... 45
Probable alcohol in Douro-C ... 46
4. Discussion ... 51
4.1 Climate variables affect berry weight, titratable acidity and pH, probable alcohol, total phenols index and anthocyanins ... 51
4.2 Grape berry composition varies across regions and years ... 54
4.3 Touriga Nacional and Aragonez show different susceptibility to climate ... 55
5. Conclusion... 59
5.1 Work weaknesses and constraints ... 60
5.2 Future perspectives ... 60
6. References ... 63
Annex I – Maturation data clustering ... 69
F
IGURE LISTFigure 1. Global wine regions and 12-22 °C growing season temperature zones (Apr-Oct in the Northern Hemisphere and Oct-Apr in the Southern Hemisphere (Jones et al., 2012). ... 4 Figure 2. Structure of a ripe grape berry (Conde et. al, 2007). ... 6 Figure 3. Grape berry development and ripening. Adapted from Kennedy (2002). ... 7 Figure 4. Location of winemaking regions where data were collected. The borders of the winemaking regions in Portugal are delimited as defined by the Portuguese ‘Instituto da Vinha e do Vinho (IVV)’. .. 17 Figure 5. Douro-A vineyard. Sampling sites are marked in red. Photo taken on 24/04/18. ... 18 Figure 6. Identification of vine blocks in a vineyard of Alentejo, as well as AWS (1, 2 and 3). Obtained in QGIS. ... 20 Figure 7. Identification of vine blocks in vineyard Douro-A, as well as AWS (1). Obtained in QGIS. ... 21 Figure 8. Identification of vine blocks in vineyard Douro-B as well as AWS (1). Obtained in QGIS. ... 22 Figure 9. Identification of vine blocks in vineyard Douro-C, as well as AWS (1, 2 and 3). Obtained in QGIS. ... 22 Figure 10. Identification of vine blocks in vineyard Douro-D, as well as AWS (1 and 2). Obtained in QGIS. ... 23 Figure 11. Identification of vine blocks in a vineyard of Dão, as well as AWS (1, 2 and 3). Obtained in QGIS. ... 24 Figure 12. Wine regions selected to study the influence of climate variables in grape berry quality parameters. 1- Douro-D vineyard, 2-Douro-C vineyard, 3- Douro-A and Douro-B vineyards, 4- Dão vineyard, 5- Alentejo vineyard. ... 31 Figure 13. Correlations between grape berry quality parameters (berry weight, TA, pH, PA, TPI and anthocyanins) at maturity and climate variables for Touriga Nacional (TON) variety. Months are described by their initial letters. TG - average temperature; TX – maximum temperature; TN – minimum temperature; P – precipitation. ... 35 Figure 14. Correlations between grape berry quality parameters (berry weight, TA, pH, PA, TPI and anthocyanins) at maturity and climate variables for Aragonez (ARA) variety. Months are described by their initial letters. TG - average temperature; TX – maximum temperature; TN – minimum temperature; P – precipitation. ... 36 Figure 15. (a) Study areas in Portugal. (b) Douro-C. (c) Douro-C 2 AWS (March 2018 photo). ... 37
Figure 16. Levels of grape berry quality parameters at maturity. Regions are listed from left to right according to average GST (April to October) in decreasing order. Results represent the mean ± SD; the statistically significant differences between clusters are indicated by asterisks (*P≤0.05, **P≤0.01, ***P≤0.001). Different letters indicate statistically significant differences between regions (for cluster 1). ... 39 Figure 17. Daily temperatures evolution from June 1 to August 31 for cluster 1 (a) and cluster 2 (b) of berry weight and total phenols index in Alentejo. (c) shows average of maximum temperatures for cluster 1 and 2 in the indicated period, with their difference represented in (d). ... 42 Figure 18. Daily temperatures evolution from June 1 to August 31 for cluster 1 (a) and cluster 2 (b) of anthocyanins in Alentejo. (c) shows average of maximum temperatures for cluster 1 and 2 in the indicated period, with their difference represented in (d). ... 43 Figure 19. Daily temperatures evolution from June 1 to August 31 for cluster 1 (a) and cluster 2 (b) of pH and probable alcohol in Alentejo. (c) shows average of maximum temperatures for cluster 1 and 2 in the indicated period, with their difference represented in (d). ... 44 Figure 20. Daily temperatures evolution from June 1 to August 31 for cluster 1 (a) and cluster 2 (b) of titratable acidity in Dão. (c) shows average of maximum temperatures for cluster 1 and 2 in the indicated period, with their difference represented in (d). ... 45 Figure 21. Daily temperatures evolution from June 1 to August 31 for cluster 1 (a) and cluster 2 (b) of probable alcohol in Douro-C. (c) shows average of maximum temperatures for cluster 1 and 2 in the indicated period, with their difference represented in (d). ... 46
T
ABLE LISTTable 1. Effect of temperature and precipitation/irrigation on grape berry quality parameters (sugars, anthocyanins, phenolics and acidity) in different phenological stages. ... 12 Table 2. Regions and subregions, number of vineyards, vine blocks and varieties in each subregion in which annual maturation analysis was performed. The seasons from which maturation data were obtained are also indicated. ... 19 Table 3. Maturation data selected for correlation with climatic variables in the present study. The regions, subregions, vineyards and vine blocks, as well as the range of years recorded, and the nearest AWS are presented. ... 24 Table 4. Linear equations used to estimate TG, TN and TX prior to 2011. Determination coefficients of linear regression models are indicated. ... 25 Table 5. Determination coefficient obtained from linear regression models between the estimated and observed total precipitation data. ... 26 Table 6. Climatic characterization of the studied regions during 1991-2017 period. ... 38 Table 7. Difference between the maturation clusters for average monthly TX, TG and TN in June, July and August for Touriga Nacional variety. *P≤0.05, **P≤0.01, ***P≤0.001. ... 40 Table 8. Difference between the maturation clusters for average monthly TX, TG and TN in June, July and August for Aragonez variety. *P≤0.05. **P≤0.01. ***P≤0.001. ... 41
A
BBREVIATIONS AND ACRONYMSARA Aragonez
AWS Automatic Weather Station
GST Growing season temperature
IPCC Intergovernmental Panel on Climate Change
PA Probable alcohol
SV Sogrape Vinhos S.A.
TA Titratable acidity
TG Average temperature
TN Minimum temperature
TON Touriga Nacional
TPI Total phenols index
TSS Total soluble solids
TX Maximum temperature
___________________________________________________________________________
1. Introduction
1. I
NTRODUCTIONGrapevines are one of the most economically important fruit species worldwide. In 2017, world’s vineyard area was of 7.5 million ha and Portugal ranked in fifth and eleventh places as wine producer in Europe and worldwide, respectively (OIV, 2017). Almost all world wine is produced from Vitis vinifera L. native to the area south of the Caucasus Mountains and the Caspian Sea. Nowadays, wine is an integral component of the culture of many countries, a form of entertainment in others, and its health benefits, when consumed moderately, have been recognized (Conde et al., 2007). Wine’s attraction relies not only on strong consistent flavours, but upon a delicate array of shifting sensations that make its charm difficult to define (Bisson et al., 2002).
The wine quality is strongly influenced by berry chemical components and their concentration at harvest (Fontoin et al., 2008). Berry composition is influenced by factors such as genotype, agricultural practices, soil type and climate, with the latter being the most dominant factor (Gladstones, 1992). Therefore, it is of great interest for the wine industry to understand the role of climate variability on grape berry composition to develop and implement optimized agronomic/oenological strategies.
In this context, this master's thesis was developed in the company Sogrape Vinhos S.A. (SV) taking advantage from the access to unique data about the Portuguese vineyards and climates. Grape berry composition data are available since 1991 in some vineyards and climatic data, provided from a network of automatic weather stations (AWS), from 2011 to 2015. We hope this work will be of interest to SV because the scientific knowledge generated will facilitate the implementation of stress mitigation agronomic practices while reducing water, fertilizers and pesticides usage. Also, a better knowledge of the impact of the environment on grape berry quality attributes may potentiate the development of decision support tools for assessing climate change impacts on future climates.
1.1 Importance of climate change upon the global production of winegrapes and wine
Climate is a key factor in the success of all agricultural systems. In viticulture, climate impacts crop production and grape quality, as well as the suitability of a given region for grapevine culture. Thus, the average climatic conditions of wine regions determine the grape cultivars that can be grown there, while wine production and quality are mainly influenced by site-specific factors, management decisions and short-term climate variability (Jones, 2012). Generally, the suitability of a region for grapevine culture is controlled by temperature that should range between 12 and 22 °C for the growing
season (Gladstones, 1992). Large areas of eastern Europe, western Asia, China, the mid-western and eastern United States, south-eastern Argentina, south-eastern South Africa and Southern Australia fall within this temperature range. However, other limiting factors, such as winter minimum temperatures, spring and fall frosts, short growing seasons, and water availability would limit much of these areas mapped (figure 1) (Jones et al., 2012).
Wine can be defined by its character, quality and personality. Character comes from the terroir –
all natural conditions such as the climate, the soil and the landscape, which influence the vine biology and thus the composition of the grape itself, – while the wine quality is largely determined by the winemaker. Wine personality is highly dependent on the weather (Halliday and Johnson, 1994). Therefore, although viticulture/oenological practices have a strong influence on wine production and quality (Santos et al., 2013), climatic conditions, namely air temperature and precipitation, are the main factors influencing grape berry and wine quality (van Leeuwen et al., 2004).
Air temperature plays a central role in determining grapevine phenology (Bonada and Sadras,
2014), influencing the onset of phenological stages like bud break, flowering and véraison and the
phenophase intervals (Fraga et al., 2016). Earlier phenological timings and shorter intervals under future warmer climates are expected (Webb et al., 2007). Other studies have shown that temperature also affects grapevine yield (Bock et al., 2013), wine production (Santos et al., 2013) and quality (De Orduna, 2010).
The main measurable parameter of climate change is a steady global increase in temperature. According to Intergovernmental Panel on Climate Change (IPCC), global temperature is predicted to
Figure 1. Global wine regions and 12-22 °C growing season temperature zones (Apr-Oct in the Northern Hemisphere and Oct-Apr in the Southern Hemisphere (Jones et al., 2012).
increase by from 1 °C to 3.7 °C until the end of the century, compared to the reference period 1985-2005. The total annual amount of precipitation and its distribution are much more uncertain than temperature predictions. IPCC expects increasing water deficiencies in most grape growing regions. Moreover, it is likely that modifications in rainfall will differ from one region to another (IPCC, 2014). However, a warmer climate is also a dryer climate, even when rainfall does not decrease (van Leeuwen and Darriet, 2016). Model projections show that the warming trend in wine regions worldwide is expected to continue in the future (IPCC, 2014), so it is expected that the ripening phase will occur at higher temperatures with increasing frequency, which may impair grape berry and wine quality. In addition, spatial modelling research has also demonstrated potential shifts in the geography of viticulture regions. It is predicted that parts of southern Europe will become too warm to produce high-quality wines, while northern regions will become more stable in terms of consistent ripening climates (Kenny and Harrison, 1992; Jones, 2012).
1.2 Climate variability
While the average climate structure in a region determines the broad suitability of winegrape cultivars as already mentioned, climate variability influences production and quality risk associated with how equitable the climate is year in and year out. Cold temperature extremes during the winter, frost frequency and severity during the spring and fall, high-temperature events during the summer, extreme rain events, and broad spatial and temporal drought conditions are events resulting from climate variability and they influence grape and wine production (Jones et al., 2012).
The inter-annual and inter-seasons temperature variability determines the quality of the wine from a vintage. In cool climates, the warm years are the best, resulting in above-average vintage, because the faster the rate of ripening of grapes between the véraison and harvest, the better will be grape berry quality parameters; accordingly, warm years decrease the number of good vintages in hot climates (Gladstones, 1992). Besides that, short-term temperature variability may significantly affect viticulture. The short-term temperature variability includes diurnal fluctuations (the range between day maxima and night minima) and day-to-day fluctuations within a given season (Ashenfelter and Storchmann, 2014).
Relatively constant and intermediate temperatures during ripening favour the biochemical processes of colour, flavour and aroma development in the grape berries. Provided that the substrate sugar is available, and temperatures are favourable for enzyme activity, these processes will occur continuously. However, excessive day and low night temperatures can negatively influence these
processes. In fact, physiological ripening should be rapid and complete for any given mean temperature, so that the time for environmental insults that impair normal berry development is reduced (Gladstones, 1992).
Portuguese wine production is characterized by a strong inter-annual variability, with adverse consequences for wine business (Cunha et al., 2003). Therefore, understanding the impact of the environment on grape berry quality attributes is of utmost practical importance as it may assist better agricultural management and oenological practices, with efficiency gains for the winemaking sector. Furthermore, a better knowledge of these processes may potentiate the development of an operational forecast system to assess climate change impacts in future climates, thereby reducing instability in production.
1.3 Grape berry development and key solutes accumulation
In order to understand the possible impact of climate variability and change on grape berry quality attributes, it is important to understand how and when specific metabolites accumulate and how the metabolism responds to the environment. Moreover, the relative concentration of many compounds, which determine aroma and flavour along maturation is crucial for producing a specific wine.
Grape berries contain three major types of tissue: skin, flesh, and seeds (figure 2). Modifications in size, composition, colour, texture, flavour and in pathogen susceptibility occur with grape berries development (Conde et al., 2007).
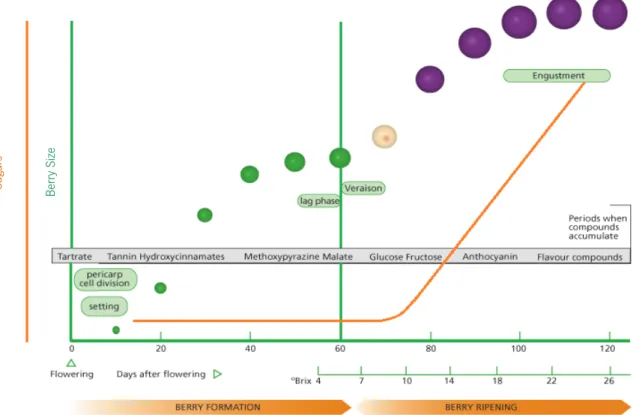
The development of grape berry follows a sigmoid pattern (figure 3) with the first growth phase occurring from flowering to about 60 days later. At this stage, several solutes, namely organic acids, are
accumulated in the green berry. Tartaric acid is accumulated during the initial stages of berry development and malic acid is accumulated at the end of the first growth phase. Wine acidity is mainly conferred by tartaric and malic acid, which together may account for over 90% of titratable acidity of the berry (Ford, 2012). The balanced acid properties help the wine maintain freshness and determine their sensory quality. Moreover, grape juice with high pH often results in unstable musts and wines that are more susceptible to oxidative and microbiological spoilage (Conde et al., 2007).
The first growth phase of the berry is followed by a latency phase in which there is little or no growth.
During the second growth phase, there is a massive accumulation of key quality solutes, namely sugars (glucose and fructose) and anthocyanins. The sugar content is one of the main indicators to be controlled during this phase. Its concentration increases during maturation until it reaches a maximum. After a plateau, sugars are then concentrated by dehydration of the berry. Thus, the berries switch from a status where they are acidic and with little sugar to a status where they are sweeter and less acidic (Conde et al., 2007; Teixeira et al., 2013). The acid/sugar balance is fundamental to build grape flavour, which determines the quality of final wine. Berry sugar concentration is the major contributor for the final alcohol content of the wine (Davies et al., 2012) and one of the most accessible indicators
Figure 3. Grape berry development and ripening. Adapted from Kennedy (2002).
Be rry S ize Sug ar s
of grape and wine quality. Moreover, the sugar status is also important to other grape and wine attributes like colour, flavour and texture, because sugars are precursors of anthocyanins and other phenolic compounds (Pirie and Mullins, 1977; Larronde et al., 1998).
Phenolics are a diverse group of secondary products involved in the protection against biotic and abiotic stresses, and in the response to diverse environmental cues (Castellarin et al., 2012). Berry phenolics contribute to wine quality given its prominent role in determining the colour, flavour, texture and astringency of wine and its antioxidant properties (Teixeira et al., 2013). The phenolic composition depends on the variety and environmental conditions. Three main classes of phenolic compounds are synthesised in grape berries: phenolic acids, stilbenes, and flavonoids. The proanthocyanidins (condensed tannins) and anthocyanins belong to the class of flavonoids - C6-C3-C6 polyphenolic compounds in which two hydroxylated benzene rings (A and B) are joined by a chain of three carbon that is part of a heterocyclic ring (C). The oxidation state of the C ring determines the structural classes of flavonoids (Castellarin et al., 2012).
Proanthocyanidins are the most abundant class of phenolics in grape berries. Synthesis of flavon-3-ols (monomer) and proanthocyanidins begins in flowering phase and proceeds during the fruit growth initial phase. Thus, the content of these phenolics remains stable or decreases a little during fruit ripening (Castellarin et al., 2012). Flavon-3-ols and proanthocyanidins contribute to mouth-feel and smooth sensory perceptions, thereby having a significant impact on wine quality (Cheynier et al., 1997). Moreover, during maturation, proanthocyanidins evolve to softer and more pleasant tastes (Blouin and Peynaud, 2001).
Anthocyanins determine the red, purple and blue pigmentation of grape berries and are
accumulated in berry skins of red varieties from the onset of véraison until full maturity. Anthocyanins
composition is particular to each variety and relatively stable under different growing conditions, however, anthocyanin content is sensitive to environmental effects (Castellarin et al., 2012).
Grape quality is also highly dependent on berry size because changes in size may concentrate (if the size is reduced) or dilute (if the size is increased) berry constituents (Antolín et al., 2003). Changes in the cell number and/or cell volume, which are determined by cell division and cell expansion, respectively, lead to variations in berry weight (Fernandez et al., 2006). Factors such as genotype (Fernandez et al., 2006) and environmental parameters (Ojeda et al., 2001) affect berry weight through modifying cell division and/or cell expansion.
The above mentioned grape berry quality parameters – including total soluble solids (TSS) (namely sugars), anthocyanins, condensed tannins, total phenolics, total acidity, pH and berry weight -
are essential for the production of premium table wines (Francis and Newton, 2005). However, as already mentioned, grapevine growth and development are largely controlled by atmospheric and microclimatic conditions, so berry quality attributes described suffer undesirable irregularity and inter-annual variability.
1.4 Impact of environment on grape berry quality parameters
Grapevines are characterized by phenological growth stages, which are determined by growing season temperatures. In the Northern hemisphere, temperatures should be below 10 °C during the dormancy stage. Winter dormancy affects the vine´s vegetative and berry development and helps synchronizing their growth stages. Temperatures above 10 °C in spring, end the dormancy of the vine and initiate bud break. Accumulation of grape berry compounds is more sensitive to temperature in
certain phenological stages. For instance, during véraison and ripening, temperature has the strongest
impact (Gladstones, 1992). Also, accumulation of TSS is more sensitive to temperature during the onset of accumulation, being less responsive during most of the season (Dai et al., 2011). In contrast, malate accumulation responds to temperature during most of the season (Bonada and Sadras, 2014).
Vine water availability is closely related to the temperature, although other factors are involved. The water balance of vine is mainly determined by the local precipitation, atmospheric humidity and soil water holding capacity (Gladstones, 1992). As few vines in Europe are irrigated, the overall quantity of annual rainfall and its distribution over the growing and non-growing season is crucial. Generally, abundant rainfall during flowering and ripening phases are considered harmful, but during winter and the early vegetative stage, are beneficial. Moreover, under low relative humidity or dry atmospheric conditions, stomata can close in order to conserve moisture, and photosynthesis ceases (Ashenfelter and Storchmann, 2014).
Some reported effects of water stress on grape berry quality attributes are contradictory and/or are strongly dependent on the degree of water stress and on the period in which it is applied. Temperature and water availability effects on the accumulation of grape berry compounds is explored below. Table 1 summarizes these effects.
Phenolic content
Although the mechanisms of phenolic biosynthesis at high temperatures are still poorly understood, high temperature limit for metabolic processes in grapevines is thought to be around 30°C
(Coombe, 1987). It was also reported (Poudel et al., 2009) that optimum temperature for phenolic accumulation is 25 °C; above or below this level, accumulation falls significantly. Therefore, phenolic compounds accumulation decreases in very low and very high temperatures. Nevertheless, further studies are in need to support this thesis.
Regarding the anthocyanins, these are accumulated in berry skins of red varieties from the onset
of véraison until full maturity and the accumulation process is influenced by environmental effects
(Downey et al., 2006; Castellarin et al., 2012). The effect of temperature on anthocyanin content of grape berry has been a target of study over the years in different varieties and regions (Cacho et al., 1992; Ubalde et al., 2010; Lorrain et al., 2011; Barnuud et al., 2013).
Mature berries from Cabernet Sauvignon, Shiraz and Chardonnay varieties cultivated in colder sites accumulate higher levels of anthocyanins than those from warmer climates (Barnuud et al., 2013). High temperatures can reduce anthocyanin accumulation through the impairment of its synthesis (Mori et al., 2005) and/or through the acceleration of its degradation (Mori et al., 2007). In the berry skin of Darkridge (Vitis vinifera L. x Vitis labrusca L.), the PAL and UFGT activities, two enzymes of anthocyanin biosynthetic pathway, were lower in plants cultivated at high night temperatures (30 °C) than at low night temperatures (15 °C) (Mori et al., 2005). Additionally, the expression level of anthocyanins biosynthetic pathway genes at véraison also decreased, although gene expression was not affected in the later stage of ripening.
Under water stress, phenolic compounds, including anthocyanins, can be concentrated because berry size is reduced. On the other hand, depending on the type of phenolic compound, the severity of water deficit and the period when water deficit occurs, the biosynthesis of phenolic compounds can be either positive or negative (Ojeda et al., 2002). A strong water deficit between véraison and maturation increases anthocyanins (Matthews and Anderson, 1988; Ojeda et al., 2002; Castellarin et al., 2007), proanthocyanins and flavonols biosynthesis without affecting total flavan-3-ols biosynthesis (Ojeda et al., 2002). On the other hand, enhanced water availability early in the growing season is beneficial for anthocyanins content because it promotes vegetative growth and, consequently, berry development and its composition at later stages (Keller et al., 2010). However, improved moisture availability late in the growing season is often described to reduce anthocyanins content (Jackson and Lombard, 1993).
Total soluble solids content
As referred elsewhere, berry sugars concentration is the major determinant of final alcohol content in wine (Davies et al., 2012). High temperatures promote sugar accumulation and thus
potential alcohol level (Coombe, 1987; Keller et al., 2010). During growing season, the highest sugar content is associated with drier years, while a lowest is related to rainier years (Ubalde et al., 2010). This can be explained by the effect of water limitation on plant hormonal equilibrium and berry weight - responsible for directing sugar accumulation in grape berries. On the other hand, it was shown that TSS accumulation was greater at higher temperatures (30 °C) than lower temperatures (20 °C) at véraison
and a few days after véraison (Poudel et al., 2009), in agreement with previous results (Mori et al.,
2005).
In irrigated conditions, TSS concentration can be decreased due to the dilution caused by greater berry size (López et al., 2007). In contrast, irrigated vines are associated with higher photosynthetic activity when compared with water-deficit vines, and consequently, the former have improved sugar accumulation (Bartolomé, 1993).
Titratable acidity
Titratable acidity levels are lower in warmer years than in colder years (Ubalde et al., 2010), and it was shown that some of the strongest and most consistent negative associations of TA with temperature regarded maximum temperatures (Barnuud et al., 2013). In general, respiration of tartaric and malic acids, particularly malic acid, increases with increasing temperatures leading to a drop in titratable acidity and increased pH (Buttrose et al., 1971; Ruffner et al., 1976).
Total acidity is normally reduced by the end of véraison due to malic acid respiration and dilution of acids caused by increased berry size, but total acidity values are significantly higher under irrigation than in non-irrigated conditions (López et al., 2007). Moreover, higher levels of malic acid measured under irrigation may be associated with higher malic acid concentrations at the start of ripening, due to greater synthesis during the growth period (López et al., 2007). TA increases with rainfall at maturity (Barnuud et al., 2013). This can be explained by indirect influences via the lowering of air temperature with an increase in rainfall and increased vegetative growth with greater moisture availability, both of
which would favour TA levels.It was found that partial irrigation (simulating predicted climate changes)
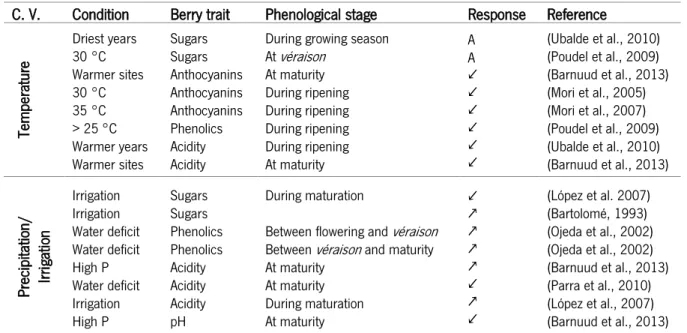
Table 1. Effect of temperature and precipitation/irrigation on grape berry quality parameters (sugars, anthocyanins, phenolics and acidity) in different phenological stages.
↙ - the quality parameter is reduced; ↗ - the quality parameter is increased; A – the quality parameter is accumulated; C. V. – Climate variable; P – precipitation.
1.5 Economic and social impacts of climate changes on vineyards and wine industry
As reported before, grapevine is very sensitive to fluctuations in weather, impacts of global warming on plant physiology and berries’ chemical composition are reflected on yield and on grape berry quality and, consequently, wine quality. Changes in yield, quality, prices, revenues and profits can be seen in the short term. Other impacts will materialize in the long term such as scarcity of resources, changes in wine geography and changes in land values, which leads to the need for new policies and adaptation measures (Pomarici and Seccia, 2016).
The equilibrium between climate, soil and grape variety influences the production of high-quality wines as well as grapes yield. In fact, a suitable climate is crucial to characterize the region´s wine styles, so increased warming with a change in rainfall regime can affect wine quality and can cause loss of wines specificity (Moriondo et al., 2013). Thus, wines price also suffer from climate variability, so any variation in weather results in price fluctuation (Chevet et al., 2011). Revenues and profits of grape growers and winemakers will differ among regions because yield, quality, prices, and costs to bear for the adaptation strategies are dependent of climate variability in different regions (Pomarici and Seccia, 2016).
Climate change and variability can raise important long-term issues for the wine industry, particularly in relation to the scarcity of resources. Water management in semiarid areas will probably
C. V. Condition Berry trait Phenological stage Response Reference
Te m pe ra tu re Driest years 30 °C Warmer sites 30 °C 35 °C > 25 °C Warmer years Warmer sites Sugars Sugars Anthocyanins Anthocyanins Anthocyanins Phenolics Acidity Acidity
During growing season
At véraison At maturity During ripening During ripening During ripening During ripening At maturity A A ↙ ↙ ↙ ↙ ↙ ↙ (Ubalde et al., 2010) (Poudel et al., 2009) (Barnuud et al., 2013) (Mori et al., 2005) (Mori et al., 2007) (Poudel et al., 2009) (Ubalde et al., 2010) (Barnuud et al., 2013) Pre ci pi ta tio n/ Irri ga tio n Irrigation Irrigation Water deficit Water deficit High P Water deficit Irrigation High P Sugars Sugars Phenolics Phenolics Acidity Acidity Acidity pH During maturation
Between flowering and véraison
Between véraison and maturity At maturity At maturity During maturation At maturity ↙ ↗ ↗ ↗ ↗ ↙ ↗ ↙ (López et al. 2007) (Bartolomé, 1993) (Ojeda et al., 2002) (Ojeda et al., 2002) (Barnuud et al., 2013) (Parra et al., 2010) (López et al., 2007) (Barnuud et al., 2013)
be a problem, so new vineyard irrigation techniques will be necessary in order to respond to grapevine water demand caused by high temperatures. Other adaptation strategies will be in order to reduce climate change effects, e.g., changing varieties to adapt to warming temperatures, combined with a need for more information among winegrowers (Pomarici and Seccia, 2016). Changes in the geography of viticulture will occur, some regions will suffer from further warming while others will benefit. Consequently, some areas may be abandoned because they are no longer considered viable for the growth of vineyards. On the other hand, this can lead to an expansion of other suitable areas that could influence global supply and change trade patterns (Ashenfelter and Storchmann, 2014).
The ability of producers to adapt to a changing climate in order to maintain profitability is strongly influenced by social, economic, and political circumstances, including economic capital, education, institutional arrangements and organizational abilities (Hadarits et al., 2010). However, a deep knowledge of future impacts and their main causes can minimize these impacts through better wine management.
1.6 Objectives
Grapevine growth and development are largely controlled by atmospheric and microclimatic conditions, leading to undesirable irregularity and inter-annual variability in berry composition. Thus, the aim of this work was to determine the responses of some key berry attributes – berry weight, titratable acidity, pH, probable alcohol, anthocyanins and total phenols – that are influential for wine quality to changing levels of climate variables.
For this purpose, the study was carried out in vineyards of Douro, Dão and Alentejo for two native varieties with a strong national importance – Touriga Nacional (TON) and Aragonez (ARA). Firstly, a maturation database was created, including quality parameters of grape berry used to assess berry maturation. The data were collected from different vineyards belonging to SV and from farmers associated with SV, located in the main Portuguese wine regions – Alentejo, Bairrada, Douro, Dão and Vinhos Verdes. Next, collection and analysis of climatic data were carried out. These data are available throughout Portugal (provided by UTAD), on a very-high resolution grid (< 1 km), and from a network of automatic weather stations, covering in a total around 750 ha of vineyard’s area over the main Portuguese wine growing regions (provided by Sogrape Vinhos S.A.). Lastly, different statistical approaches were tested and applied to correlate berry quality attributes and atmospheric variables (temperature and precipitation).
Therefore, understanding the impact of environment on berry quality parameters is of utmost practical importance as it may assist better agricultural management and oenological practices, with efficiency gains for the winemaking sector. Thus, in the present study, we aimed to obtain a better knowledge of these processes that may leverage the development of decision support tools for assessing climate change impacts in future climates.
___________________________________________________________________________
2. Material and Methods
2. M
ATERIAL AND METHODS2.1 Maturation database
Grape quality data were collected annually, at different time intervals, in five different winemaking
regions: Alentejo, Bairrada, Douro, Dão and Vinhos Verdes (figure 4). The data were collected from
vineyards of Sogrape Vinhos and from private farmers associated with this company. In each year, most
analyses were performed weekly, two to three weeks after the end of the véraison until harvest. All the
data were compiled into an EXCEL database (Microsoft Corporation, Redmond, WA, EUA) and validation of wet chemical data was performed. The database was then validated and consolidated. The number of vineyards, vine blocks, varieties and the analysed years for the different regions are indicated in table 2. The method of bunch sampling and analysis of berry composition used to obtain these data is presented below.
Figure 4. Location of winemaking regions where data were collected. The borders of the winemaking regions in Portugal are delimited as defined by the Portuguese ‘Instituto da Vinha e
Bunch sampling
The sampling method was adapted from previous reports (Blouin and Peynaud, 2001). Bunches were sampled manually, switching randomly between the side exposed to the sun and the shaded side of canopies. Figure 5 shows a sampling site (vine marked in red) in Douro-A vineyard. Berries were sampled randomly from the top to the tip of each bunch and placed in closed plastic bags and stored in refrigerated and insulated boxes during transport to the laboratory. Analyses of grape berry quality parameters commonly selected for maturation control were performed up to 24 h after collection.
Berry composition analysis
Collected berries were divided into two sets of 200 berries each: one for analysis of berry weight, sugars and acids and another for phenolic compounds analysis. Two hundred berries were weighed and then crushed and decanted. The obtained grape must was used to evaluate sugars, acidity and pH. For sugar analysis, results were expressed in terms of probable alcohol (PA) percentage, considering 1% of probable alcohol as equivalent to 17 g/L of total sugars. Titratable acidity was analysed by titration of the sample with 0.1 M NaOH solution and the results were expressed as g of tartaric acid equivalents per L of juice (g/L). pH was analysed with a digital potentiometer. pH is an important indicator of microbiological stability of musts: grape juice with a high pH often results in biologically unstable musts and in wines that are more susceptible to oxidation and microbiological spoilage (Conde et al., 2007).
Phenolic compounds analysis was carried out with the second sample of 200 grape berries and the results were expressed in terms of extractable anthocyanins (mg/L) (a measure of easily extractable
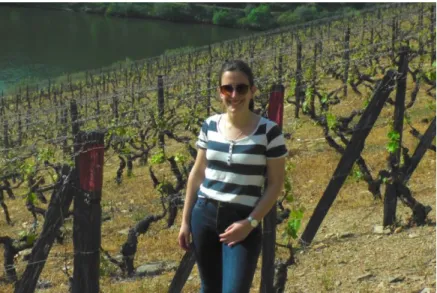
Figure 5. Douro-A vineyard. Sampling sites are marked in red. Photo taken on 24/04/18.
anthocyanins at a pH value similar to the pH of the must) and total phenols index (TPI). TPI is an indirect index of the total polyphenolic abundance in grapes and correlates with other phenolic compounds such as phenolic acids and flavonoids, in addition to anthocyanins. In some cases, other parameters were evaluated: assimilable nitrogen (mg/L), copper (mg/L) and malic acid (g/L).
This work was performed along the years before the present project was set. In the present study, we collected and treated the results obtained over the years indicated in table 2.
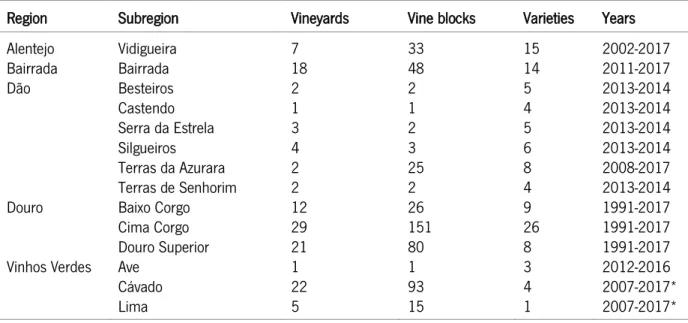
Table 2. Regions and subregions, number of vineyards, vine blocks and varieties in each subregion in which annual maturation analysis was performed. The seasons from which maturation data were obtained are also indicated.
(*) Missing the year 2010.
2.2 Selection of study regions
After assembling the maturation database, a restricted subset of maturation data was selected for correlation with climatic data. Vine blocks of two varieties – Touriga Nacional (TON) and Aragonez (ARA) - were carefully chosen in Douro, Dão and Alentejo regions to study the dynamics of berry weight, titratable acidity, pH, probable alcohol, total phenols index and anthocyanins at maturity. Touriga Nacional produces dark, full-bodied, powerful and aromatic wines with floral notes similar to the scent of purple violet blossoms. It frequently shows blackberry, blueberry, rock rose, and rosemary notes. Aragonez produces full-bodied, inky and highly aromatic wines. The grape has fine and delicate aromas of pepper and berries (Ali et al., 2011).
For a better correlation between climate variables and berry composition, vine blocks were selected based on two criteria: 1) vine blocks should be as close as possible to an automatic weather station and 2) maturity data sets should refer to ten or more years (except for the Alentejo region,
Region Subregion Vineyards Vine blocks Varieties Years
Alentejo Bairrada Dão Douro Vinhos Verdes Vidigueira Bairrada Besteiros Castendo Serra da Estrela Silgueiros Terras da Azurara Terras de Senhorim Baixo Corgo Cima Corgo Douro Superior Ave Cávado Lima 7 18 2 1 3 4 2 2 12 29 21 1 22 5 33 48 2 1 2 3 25 2 26 151 80 1 93 15 15 14 5 4 5 6 8 4 9 26 8 3 4 1 2002-2017 2011-2017 2013-2014 2013-2014 2013-2014 2013-2014 2008-2017 2013-2014 1991-2017 1991-2017 1991-2017 2012-2016 2007-2017* 2007-2017*
where information about Touriga Nacional variety was only available for six years) (table 3). A geographic information system (Quantum GIS) was used to visualize vine blocks of different regions, allowing the selection of those closer to an automatic weather station. This information had already been inserted previously in the software and was kindly provided by Sogrape Vinhos S.A. For reasons of confidentiality, the names of vineyards and vine blocks were anonymised.
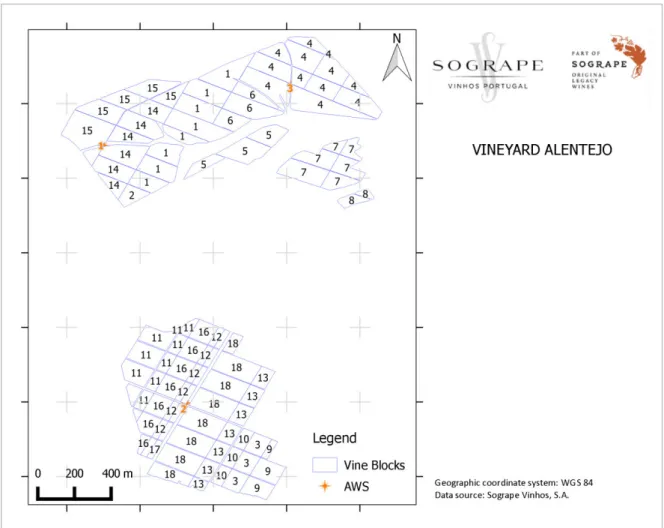
As can be seen in figure 6, in a vineyard of Alentejo, the vine block 18 (Touriga Nacional) is close to AWS 2 and vine block 6 (Aragonez) is close to AWS 3. In these vine blocks a maturation database was previously built over a period > 10 years. The same criteria were used for Douro (vineyard A, B, C and D) and Dão regions and the selected AWS are indicated in table 3.
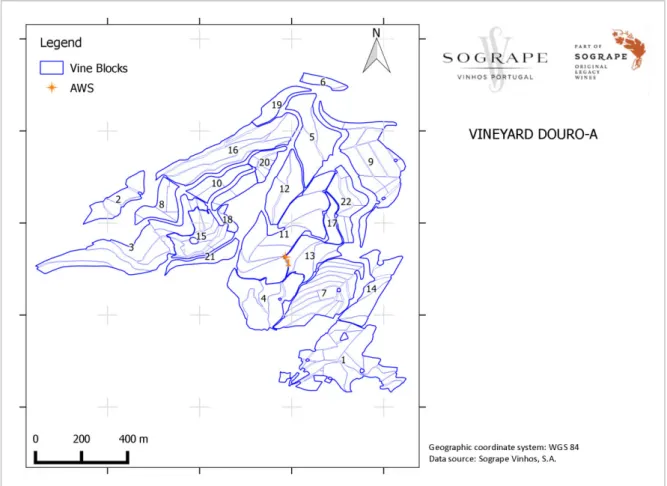
The selected vine blocks in vineyard Douro-A were vine block 9 (TON) and vine block 7 (ARA) (figure 7).
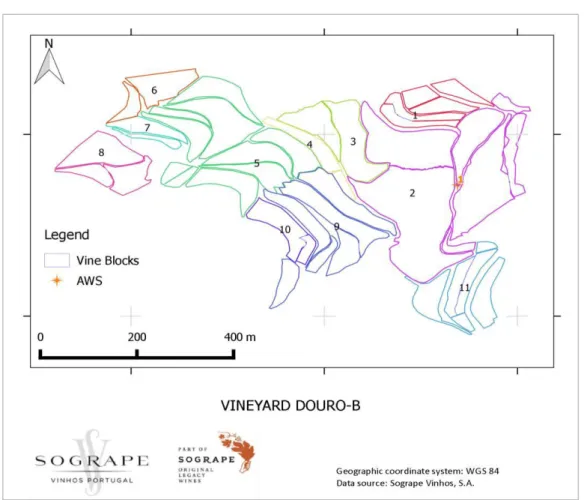
The selected vine blocks in vineyard Douro-B were vine block 1 (TON) and vine block 5 (ARA) (figure 8). For vineyard Douro-C (figure 9) the vine blocks 4 (TON) and 8 (ARA) were selected. Vine block 8 is closer to AWS 2 and vine block 4 is closer to AWS 1.
Figure 9. Identification of vine blocks in vineyard Douro-C, as well as AWS (1, 2 and 3). Obtained in QGIS. Figure 8. Identification of vine blocks in vineyard Douro-B as well as AWS (1). Obtained in QGIS.
In vineyard Douro-D (figure 10), the vine blocks chosen were 8 (TON) and 19 (ARA). Vine block 8 is closer to AWS 2 and vine block 19 to AWS 1.
In a vineyard of Dão, the vine blocks chosen were 8 (TON) and 7 (ARA) which are close to AWS 2. Maturation data from these two vine blocks were recorded for 10 years (figure 11).
Table 3. Maturation data selected for correlation with climatic variables in the present study. The regions, subregions, vineyards and vine blocks, as well as the range of years recorded, and the nearest AWS are presented.
TON – Touriga Nacional; ARA – Aragonez.
Region Subregion Vineyards Variety Vine block Years Nearest AWS
Alentejo Alentejo Dão Dão Douro Douro Douro Douro Douro Douro Douro Douro Vidigueira Vidigueira Terras da Azurara Terras da Azurara Cima Corgo Cima Corgo Cima Corgo Cima Corgo Cima Corgo Cima Corgo Douro Superior Douro Superior Vineyard Alentejo Vineyard Alentejo Vineyard Dão Vineyard Dão Douro-A Douro-A Douro-B Douro-B Douro-C Douro-C Douro-D Douro-D TON ARA TON ARA TON ARA TON ARA TON ARA TON ARA 18 6 8 7 9 7 1 5 4 8 8 19 2012-2017 2004-2017 2008-2017 2008-2017 1991-2017 1991-2017 1993-2017 1994-2017 2007-2017 2007-2017 1999-2017 1999-2017 Alentejo 2 Alentejo 3 Dão 2 Dão 2 Douro-A 1 Douro-A 1 Douro-B 1 Douro-B 1 Douro-C 1 Douro-C 2 Douro-D 2 Douro-D 1 Figure 11. Identification of vine blocks in a vineyard of Dão, as well as AWS (1, 2 and 3). Obtained in QGIS.
2.3 Climate data
Automatic weather stations close to the vine blocks previously selected in Alentejo, Dão and Douro (table 3) provided daily average (TG), minimum (TN) and maximum (TX) air temperatures, as well as daily precipitation totals for the period of 2011-2017. Climatic data prior to 2011 are not available since AWS´s were installed in 2010, so these data were obtained from an estimated climatic
database by a research group of UTAD (PTHRES), available throughout Portugal on a very-high
resolution grid (< 1 km).
For this purpose, statistical relations between observed daily average, minimum and maximum air temperatures and daily precipitation and the same estimated data (PTHRES) was established (in 2011-2015 period). The first ones were used as dependent variables in the linear regression models. As the determination coefficient was high in the linear regression models performed between estimated and observed temperatures, linear equations were used to estimate the TG, TN and TX prior to 2011 (table 4). The determination coefficient was lower in the linear regressions performed between estimated and observed precipitation totals, therefore, this method cannot be used for estimating daily precipitation totals before 2011 (table 5). The multiplicative method was used for this purpose. First, the average of observed and estimated monthly precipitation totals was calculated for each month of the 2011-2015 period. Then, the quotient between the observed data average and the estimated data average was calculated for each month and the daily precipitation totals data prior to 2011 were obtained by multiplying this quotient by the daily estimated data.
Table 4. Linear equations used to estimate TG, TN and TX prior to 2011. Determination coefficients of linear regression models are indicated.
AWS Linear equation (TG) R² Linear equation (TX) R² Linear equation (TN) R²
Alentejo 2 Alentejo 3 Dão 2 Douro-B 1 Douro-C 1 Douro-C 2 Douro-A 1 Douro-D 1 Douro-D 2 y = 1.0001x + 0.1459 y = 0.9929x - 0.4101 y = 1.0276x - 0.0435 y = 1.0204x + 0.5626 y = 0.9861x - 0.8406 y = 0.9698x - 0.1636 y = 0.9686x - 0.3989 y = 1.0844x - 1.4776 y = 1.0772x - 1.4794 0.987 0.971 0.955 0.980 0.980 0.987 0.977 0.979 0.983 y = 1.0866x - 1.5017 y = 1.0602x - 0.2323 y = 1.0833x - 0.6819 y = 1.0526x - 0.5688 y = 0.9954x - 1.8099 y = 0.9955x - 1.3195 y = 0.9686x - 1.4239 y = 1.0841x - 0.5099 y = 1.0712x - 1.1463 0.994 0.992 0.981 0.974 0.976 0.979 0.974 0.974 0.975 y = 1.016x - 0.1484 y = 1.0098x - 1.7713 y = 0.9247x + 0.4509 y = 0.9597x + 0.3643 y = 0.9147x - 0.7594 y = 0.8953x - 0.1773 y = 0.9489x - 0.269 y = 1.0695x - 2.9495 y = 1.0418x - 1.9773 0.990 0.907 0.902 0.955 0.937 0.968 0.940 0.954 0.971
Table 5. Determination coefficient obtained from linear regression models between the estimated and observed total precipitation data.
2.4 Relationships of grape berry components with climate variables
In this study, influences of climate variables on grape berry composition were examined at maturity (last analysis carried out before harvest, up to two weeks before). Thus, the technological maturity level was established based on the winemaker's decision to harvest. The influence of climate variables (average, maximum and minimum air temperature and total precipitation) on berry weight, titratable acidity, pH, probable alcohol, total phenols index and anthocyanins at maturity during vine vegetative cycle (November-October) was explored through correlation analyses. This exploratory correlation analysis aimed to identify the climatic variables and critical periods that affect berry composition. Thus, correlation analyses were performed with monthly averages of TG, TX and TN and monthly precipitation totals between November and October. However, this approach was ineffective for precipitation, because rainfall days were not uniform over each month and in some months did not rain at all. For this reason, precipitation totals were used from April to June (flowering/fruiting phase) and from July to September (maturation phase) to study their influence on grape berry composition. Moreover, this preliminary analysis allowed to identify the regions more affected by inter-annual climate variability, and thus then study these regions in detail.
2.5 Maturation data clustering
Exploratory correlation analyses of climate variables and grape berry composition at maturity allowed to identify the average, maximum and minimum air temperatures of the months of June, July and August as determinants of grape berry quality. The results obtained for precipitation varied significantly between regions and varieties. In addition, this analysis showed that Douro (C and D), Dão
AWS R² Alentejo 2 Alentejo 3 Dão 2 Douro-B 1 Douro-C 1 Douro-C 2 Douro-A 1 Douro-D 1 Douro-D 2 0.917 0.574 0.810 0.728 0.716 0.767 0.773 0.506 0.615
and Alentejo were the regions more affected by climate. Therefore, the subsequent analysis focused only on these regions and on the average, maximum and minimum air temperatures.
Each grape berry quality parameter was divided into two clusters by the median: years where the maturation parameter was higher (cluster 1) and years where it was lower (cluster 2) (annex I). The average of the two clusters for each grape quality parameter, region and variety studied, as well as the difference between the averages was calculated (annex II).
2.6 Temperatures analysis between maturation clusters
The difference between the monthly averages of TG, TX and TN for June, July and August between maturation clusters was calculated for Aragonez and Touriga Nacional varieties in Douro-C, Dão and Alentejo. This analysis allowed the identification of the temperature variation that may explain the average difference in grape quality attributes between clusters. For the largest monthly temperature differences found, daily temperature differences between clusters were calculated from June 1 to August 31. This analysis allowed for the identification of critical days/periods that may have contributed to the inter-annual variability of maturation parameters. Furthermore, the evolution of daily temperatures for each year of the two clusters was plotted from June 1 to August 31 to determine if differences between monthly temperatures found were the result of the difference between warmer and colder years.
2.7 Statistical analysis
The statistical significance of the difference between averages of the two maturation clusters for each parameter and monthly temperature differences between clusters was obtained through the Student’s t-test in software R 3.4.3 (R core team 2017). For each grape quality parameter, cluster 1
averages of each region were compared to each other through by one-way ANOVA analysis in Prism® 6
___________________________________________________________________________
3. Results
3. R
ESULTS3.1 Relationships of grape berry quality parameters with climate variables
Exploratory bivariate correlation analyses between climate variables (precipitation and mean, maximum and minimum air temperature) during the vine vegetative cycle (November to October of the following season) and grape berry attributes at maturity allowed the identification of climate variables and critical periods that were influential on berry composition of Touriga Nacional and Aragonez varieties. This analysis was a starting point to identify inter-annual climatic variability influences on grape berry quality parameters, including berry weight, titratable acidity, pH, probable alcohol, total phenols and anthocyanins in the previously selected regions (figure 12).
Correlation analyses showed that the analysed grape berry quality parameters were mostly influenced by the temperatures of June, July and August. Thus, in figure 13 and 14 only correlations between the temperatures of these months and grape berry quality parameters are presented. The correlations between monthly precipitation totals (November to October) and the grape berry quality parameters were not conclusive because precipitation days are not uniform over each month and in
1 3
4
5 2
Figure 12. Wine regions selected to study the influence of climate variables in grape berry quality parameters. 1- Douro-D vineyard, 2-Douro-C vineyard, 3- Douro-A and Douro-B vineyards, 4- Dão vineyard, 5- Alentejo vineyard.
some months does not rain at all. Thus, precipitation totals were used from April to June and from July to September to study the effect of precipitation on berry composition.
The correlations between the climatic variables and the grape quality parameters in Douro-A and Douro-B vineyards (Cima Corgo subregion) were very weak (data not shown). Therefore, in the following analyses, these two vineyards were not considered.
Berry weight
Touriga Nacional berry weight at maturity was negatively correlated with temperature in the four vineyards – Dão, Alentejo, Douro-C and Douro-D. Particularly, moderate to strong negative correlations were observed with average (-0.50 to -0.83) and maximum temperature (-0.56 to -0.81) in Alentejo, with August temperatures showing more influence in berry weight. Moreover, in Dão and Douro-C, moderate negative correlations were also found with average and maximum July temperatures. In Douro-D, correlations were weak for all temperatures and months analysed. In general, in all regions, the minimum temperature little influenced berry weight, compared with the average and maximum temperature (figure 13). Figure 13 also shows that precipitation during the maturation period (July to September) increased berry weight of Touriga Nacional, except in the Dão region. A strong positive correlation was observed in Alentejo (0.81) (figure 13).
The weight of the Aragonez berries was influenced by temperature much like the berries of Touriga Nacional but, in general, correlations were weak to moderate. Berry weight in Alentejo and Douro-C was mainly affected by the temperature of June, while in Dão, July temperature was more influential. In Douro-D very weak correlations were observed between temperature and berry weight. A strong positive correlation between berry weight and precipitation during the maturation period (July to September) was only observed in Douro-C (0.79) (figure 14).
As a whole, results suggested that high temperatures are associated with a reduction in the weight of the berries of both varieties but Touriga Nacional berries were much more sensitive.
Titratable acidity
Temperature increase negatively impacted titratable acidity (TA) of Touriga Nacional berries at maturity, but in Douro-D vineyard the correlation was weak. In Dão, the strength of correlations increased steadily as the season progressed, becoming very strong in August. TA in Alentejo was mainly
affected by the temperatures of July. In Douro-C, correlations were moderate for all temperatures and months analysed (figure 13).
Temperature negatively impacted TA levels of Aragonez berries at maturity but mainly in Dão region, with a growing trend throughout maturation (figure 14).
Generally, correlations between TA and precipitation variables are positive but weak (figure 13 and 14). Negative correlations with precipitation were found in Alentejo and Douro-D, but in these two vineyards grapevines are irrigated. Results suggested that higher temperatures are associated with low levels of TA, but correlations between precipitation and TA at maturity were not evident.
pH
Generally, the correlations between the berry pH and temperature were opposite to TA and temperature because the pH tends to decrease with the increase of titratable acidity (figure 13 and 14). Correlations of pH with temperatures during all months studied were weak and varied in Douro-D vineyard. In Aragonez berries, temperature had significant positive impacts on pH levels only in Dão vineyard, with stronger correlations in August for all temperature variables.
Negative correlations between berry pH and precipitation were found in Dão and Douro-C for Touriga Nacional and Aragonez varieties. An unexpected positive correlation between pH of Touriga Nacional berries and precipitation in April to June period was observed in Alentejo (figure 13). Therefore, precipitation effect in berry pH is not consistent in all regions.
Probable alcohol
In Alentejo and Douro-C, probable alcohol levels of Touriga Nacional berries were positively correlated with temperature, and the effect of July average and maximum temperatures were more evident. Weak to moderate positive correlations were found between minimum temperature and PA in these regions. In Dão and Douro-D, minimum temperature did not impact probable alcohol levels because correlations were very weak (figure 13). Only the temperature in June consistently affected positively alcohol levels in Aragonez grapes of Dão region (figure 14).
In Dão region, a strong negative correlation between precipitation and PA was observed in Touriga Nacional and Aragonez berries (figure 13 and 14). In the remaining regions, precipitation did not affect PA levels, or the effects were very weak.
Total phenols index
Results showed that temperature negatively impacted total phenols index at maturity in Touriga Nacional berries from Alentejo. However, an opposite effect of temperature on TPI was observed in Douro-D for Touriga Nacional berries (figure 13). Correlations between temperature and TPI in Aragonez grapes were weak to moderate and dependent on the region (figure 14). Precipitation can also increase or reduce phenols level, depending on the region (figure 13 and 14). Analysis of the impact of climatic variables on TPI is ambiguous since the impact on different phenols may be different.
Anthocyanins
Results presented in figure 13 and 14 show that the concentration of anthocyanins in Touriga Nacional and Aragonez berries were negatively associated with all temperature variables. In particular, the correlations were strong in Alentejo where the climatic conditions of July (particularly average and maximum temperatures) showed a great impact on the concentration of anthocyanins at maturity. Moderate correlations between minimum temperatures and anthocyanins at maturity were found for all regions. Correlations between precipitation and anthocyanins in Touriga Nacional berries were weak and depended on the region (figure 13). However, moderate positive and negative correlations were found between precipitation (from April to June) and anthocyanins in Aragonez grapes (figure 14).
Corr el at ion s coeff icie nt s
Figure 13. Correlations between grape berry quality parameters (berry weight, TA, pH, PA, TPI and anthocyanins) at maturity and climate variables for Touriga Nacional (TON) variety. Months are described by their initial letters. TG - average temperature; TX – maximum temperature; TN – minimum temperature; P – precipitation.
Corr el at ion s coeff icie nt s
Figure 14. Correlations between grape berry quality parameters (berry weight, TA, pH, PA, TPI and anthocyanins) at maturity and climate variables for Aragonez (ARA) variety. Months are described by their initial letters. TG - average temperature; TX – maximum temperature; TN – minimum temperature; P – precipitation.