Article
, Vol. 29, No. 8, 1680-1689, 2018Printed in Brazil - ©2018 Sociedade Brasileira de Química
*e-mail: [email protected]
#These authors contributed equally to this work.
De-NO
xPerformance and Mechanism of Mn-Based Low-Temperature SCR
Catalysts Supported on Foamed Metal Nickel
Baozhong Zhu,a,# Guobo Li,a,# Yunlan Sun,*,a Shoulai Yin,a Qilong Fang,a Zhaohui Zi,a
Zicheng Zhu,a Jiaxin Lia and Keke Maoa
aSchool of Energy and Environment, Anhui University of Technology,
243002 Maanshan, Anhui, P. R. China
A series of manganese-based catalysts supported on foamed metal nickel (FMN) with various Mn/Ni ratios was prepared for low-temperature selective catalytic reduction (SCR) of NO with NH3 (NH3-SCR). The effects of calcination temperature, amount of added Mn, optimal operating
conditions, and H2O on the elimination of nitrogen oxides (de-NOx) performance of catalysts were
studied. The catalysts were characterized by scanning electron microscopy, X-ray diffraction, X-ray photoelectron spectroscopy, and temperature-programmed desorption experiments of NH3 analyses. The experimental results revealed that the Mn7.5/FMN catalyst calcined at 350 °C
exhibited the best NO conversion that was ca. 100% at 120-200 °C. Moreover, it had excellent H2O tolerance. The superior activity of the Mn7.5/FMN catalyst, which was calcined at 350 °C,
was attributed to the presence of amorphous manganese oxide, more unsaturated Ni atoms and structural defects, an increase in NH3 adsorbance, and the number of surface acid sites. Based on
these studies, we established that the reaction of the NH3-SCR with Mn7.5/FMN catalyst mainly
exhibits an Eley-Rideal mechanism.
Keywords: de-NOx, low-temperature SCR, MnOx, foamed metal nickel, mechanism
Introduction
Nitrogen oxides (NOx) such as NO and NO2 resulting from fossil fuel combustion are one of the main pollutants in the atmosphere. NOx gases are responsible for acid rain, photochemical smog, and ozone layer depletion. At high levels, they affect the respiratory system, and long-term exposure can damage lung function.1-3 Currently, several methods are used to eliminate NOx (de-NOx). Selective catalytic reduction (SCR) of NO with NH3 (NH3-SCR) is one of the most effective ways to reduce NOx emissions.4-8 The reactions are as follows:5
4NH3 + 4NO + O2 4N2 + 6H2O standard path (1)
4NH3 + 6NO 5N2 + 6H2O slow reaction (2)
4NH3 + 2NO + 2NO2 4N2 + 6H2O fast reaction (3)
4NH3 + 2NO2 + O2 3N2 + 6H2O (4)
As a core link in this technology, the catalyst performance directly affects the de-NOx efficiency of the whole SCR system.9,10 The V
2O5-WO3 (MoO3)/TiO2
catalyst is a commonly used commercial SCR catalyst
for NOx removal with an active temperature range
of 300-400 °C.11,12 However, this catalyst has many disadvantages including the toxicity of vanadium at high temperatures.13 Therefore, significant efforts should be devoted towards the development of non-vanadium catalysts for NH3-SCR processes. Mn-based catalysts have been studied due to their inherent environment-friendly characteristics and excellent SCR activity at low temperatures.14-19 Kapteijn et al.20 studied the single-component MnOx catalyst and established an activity order of MnO2 > Mn5O8 > Mn2O3 > Mn3O4 > MnO at a temperature range of 385-575 K. Moreover, they determined that Mn2O3 exhibited the highest N2 selectivity with an NO conversion rate of ca. 100% at ca. 450 K. Wang et al.21 studied the low-temperature de-NO
x activity of MnOx supported by multi-walled carbon nanotubes. The results revealed an activity order of manganese oxides in different valence states: MnO2 > Mn3O4 > MnO, proving that the different valence states of Mn exhibit different effects on the de-NOx activity of the catalyst.
co-workers22 studied the low-temperature de-NO
x activity of Mn-Ce/TiO2 and Mn-Ce/Al2O3 catalysts. The results indicated that the de-NOx performance of the Mn-Ce/TiO2 catalyst was better than that of the Mn-Ce/Al2O3 catalyst at temperatures of 80-150 °C. Although the Mn-based catalysts exhibit high low-temperature activities, there are significant differences in their low-temperature SCR activity.23-25 Moreover, the role of the carrier should not be ignored.26,27 Foamed metal nickel (FMN) with an excellent structure of three-dimensional all-through mesh is used as a sound absorbing “porous metal”. It exhibits a number of positive characteristics including good stability, high porosity, good thermal shock resistance, small bulk density and a large surface area, and is mainly used as a positive current collector and active carrier in nickel-based batteries.28,29 However, to date, few studies have concentrated on the use of FMN in the field of low-temperature de-NOx.30
In this paper, FMN is used as a de-NOx catalyst carrier. A series of Mn-based catalysts supported on FMN with different Mn/Ni ratios were studied. The effects of calcination temperature, amount of added Mn, optimum operating conditions, and H2O on the de-NOx performance of the catalysts were elucidated and the mechanism was discussed.
Experimental
Catalyst preparation
Mnx/FMN catalysts (x represents the mass ratio of Mn loading and FMN, x = 2.5, 5.0, 7.5, 10.0, 12.5, and 15.0) were prepared by the impregnation method using FMN (commercial foamed metal nickel, 98% purity) as support and manganese nitrate (50% Mn(NO3)2 solution) as precursor,31 both purchased from Sinopharm (China). A certain amount of FMN was added to the manganese nitrate solution according to the ratio of Mn and FMN. The mixture was magnetically stirred for 1 h and then dried in an oven at 105 °C for 12 h. The dried catalyst samples were subsequently calcined at 250, 350, 450, and 550 °C in a muffle furnace for 5 h. The prepared catalysts were sealed and stored until further use in subsequent experiments.
Catalytic experiments
Catalytic measurements were performed in a fixed-bed reactor using 0.3 g catalyst for each experiment.32 The simulated mixed flue gas comprised 500 ppm NO, 500 ppm NH3, 5 vol% O2 and was balanced with N2. The total gas flow rate of the mixed flue gas was 100 mL min-1
and the gas hourly space velocity (GHSV) was 13000 h-1. A thermocouple (K-type) was used to measure the reactive temperature of the catalyst in the fixed-bed reactor. The flue gas concentrations at the inlet and outlet of the system were measured with a flue gas analyzer (ECOM J2KN, Germany). Prior to the initiation of the experiment, the simulated mixed flue gas was fed into the reactor for 0.5 h to ensure stability. Catalytic activity was evaluated from the amount of NO conversion, calculated by equation 5:
(5)
where η is the NO conversion and [NO]in and [NO]out indicate the NO inlet and outlet concentrations at steady state, respectively. The NO2 concentration was negligible.
Catalyst characterization
Scanning electron microscope
A scanning electron microscope (SEM) (Hitachi S-4800, Japan) was used to investigate the microstructural features of the catalyst surface.
X-ray diffraction
X-ray diffraction (XRD) measurements were performed on an X-ray diffractometer with CuKα radiation (Bruker D8 Advance, Germany). The diffraction patterns were recorded in the 2θ range of 10-80° at a scan speed of 10° min-1 and a resolution of 0.02°.
X-ray photoelectron spectroscopy
X-ray photoelectron spectroscopy (XPS; Thermo Scientific K-Alpha spectrometer, USA) was used to study the valence state, elemental content, and energy level structure. Test conditions included an Al Kα excitation source, 30 mA target current, 15 kV target voltage, a vacuum chamber pressure less than 10-7 Pa, and a 0.1 eV scan step size. The binding energies of the samples (O, Ni, and Mn) were calibrated according to contaminant carbon (C 1s = 284.6 eV).
Temperature-programmed desorption analysis of ammonia
Temperature-programmed desorption analyses of NH3 (NH3-TPD) were performed on Micromeritics 2920 (USA) auto-adsorption apparatus and the desorbed amount
of NH3 was also monitored by thermal conductivity
of 80 °C. At the beginning of the adsorption process, the
system was purged with a mixed gas comprising NH3
(10 mL min-1) and N
2 (30 mL min-1). After adsorption was saturated, the system was purged with He at a flow rate of 30 mL min-1 until the TCD detector signal was stable. Finally, the temperature was raised from 100 to 700 °C under He atmosphere (30 mL min-1) and the working curve was recorded.
Results and Discussion
Evaluation of catalytic activity
Effects of calcination temperature and Mn loading on catalytic activity
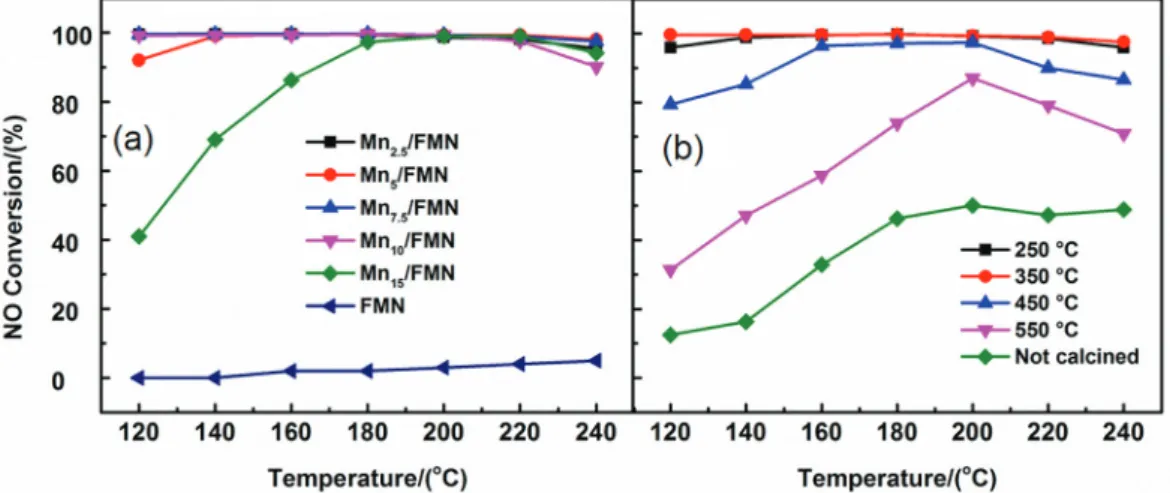
Figure 1a illustrates the NO conversion percentage values of catalysts with different Mn loadings at 120-240 °C. For FMN, the conversions were basically zero at 120-240 °C, indicating its low catalytic activity. NO conversion first increased and then decreased with increasing Mn loading, which reached a maximum at a Mn loading of 7.5% and was ca. 100% at 120-200 °C. A small amount of Mn loading provides less active site and so the activity of the Mnx/FMN catalyst is low. On the other hand, a high amount of Mn loading may cause agglomeration of the active component that in turn deteriorates the catalytic activity. The Mn loading of 7.5% is suitable, so we further studied the Mn7.5/FMN catalyst.
The NO conversion activity of the Mn7.5/FMN catalyst uncalcined and calcined at 250-550 °C is presented in Figure 1b, indicating that the calcination temperature had great influence on the NOx conversion. The NO conversion activity of the Mn7.5/FMN catalyst firstly increased and then decreased with the rise of calcination temperature. The Mn7.5/FMN catalyst exhibited the highest activity at
a calcination temperature of 350 °C. The NO conversions were ca. 100% at 120-220 °C. Many factors may be responsible for the high NO conversions, such as surface area and surface acidity of catalyst.33,34 We will conduct comprehensive studies in our future work.
Effects of the NH3/NO ratio and O2 concentration on catalytic
activity
NH3 plays an important role in the NH3-SCR reaction and is usually adsorbed onto the catalyst surface where it reacts with NO. Excess NH3 molecules may result in secondary pollution in the NH3-SCR reaction and thus, it is necessary to understand the effect of the NH3/NO ratio on catalytic activity. Figure 2a demonstrates the effect of different NH3/NO ratios on the NO conversion activities of the Mn7.5/FMN catalyst calcined at 350 °C. At an NH3/NO ratio < 0.8, NO conversion increased linearly with an increase in NH3/NO ratio. According to reaction 1, it can be known that the amount of NH3 was not enough, so the NO conversion increased linearly with an increase in NH3/NO ratio. However, when the NH3/NO ratio reached 1.0, the NH3 reacted on NO completely, and thus the conversion activity became stable even increasing the amount of NH3.
In NH3-SCR, both O2 and NO have oxidative capacity and thus, the oxidation reaction at the catalyst surface is a very critical step.35 Hence, it is essential to study the effect of O2 concentration on the catalytic activity. Figure 2b demonstrates that although the NO conversion of the Mn7.5/FMN catalyst is only ca. 20% at an O2 concentration of 0 ppm, it increases rapidly with an increase in O2 concentration until it becomes stable at a concentration of ca. 1%. This indicates that the O2 molecules participate in the reaction and the adsorbed and lattice oxygen molecules on the catalyst surface are formed rapidly,
Figure 1. NO conversion activities of (a) Mnx/FMN catalysts with different Mn loadings calcined at 350 °C and (b) Mn7.5/ FMN catalyst uncalcined and
thereby increasing NO conversion. When the adsorbed and lattice oxygen molecules on the catalyst surface reach the saturation point (ca. 1%, Figure 2b), NO conversion remains stable, even if the O2 concentration increases. This further explains why the oxidation capacity of O2 on the catalyst surface is much stronger than that of NO and why the importance role of O2 in the NH3-SCR reaction cannot be ignored.
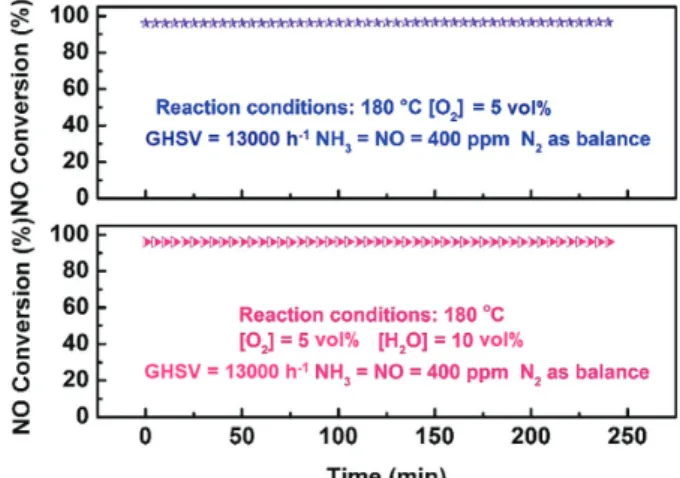
Effect of H2O on catalytic activity
H2O has an inhibition effect on the NH3-SCR of NO.36-38 To investigate whether the Mn7.5/FMN catalyst is affected by H2O, an H2O resistance test was carried out at 180 °C. Figure 3 displays the effect of H2O on the NO conversion activity of the Mn7.5/FMN catalyst. Notably, the Mn7.5/FMN catalytic activity was not affected by H2O, even at 10 vol%. In the presence of H2O, the H2O and NH3 molecules compete for the active sites on the catalyst.39 However, the Mn7.5/FMN catalyst exhibits superior H2O resistance, indicating that the Mn7.5/FMN catalytic activity can be ascribed to the strong adsorption of the NH3 molecules present on the acid sites of the catalyst.
Adsorption performance of the catalyst
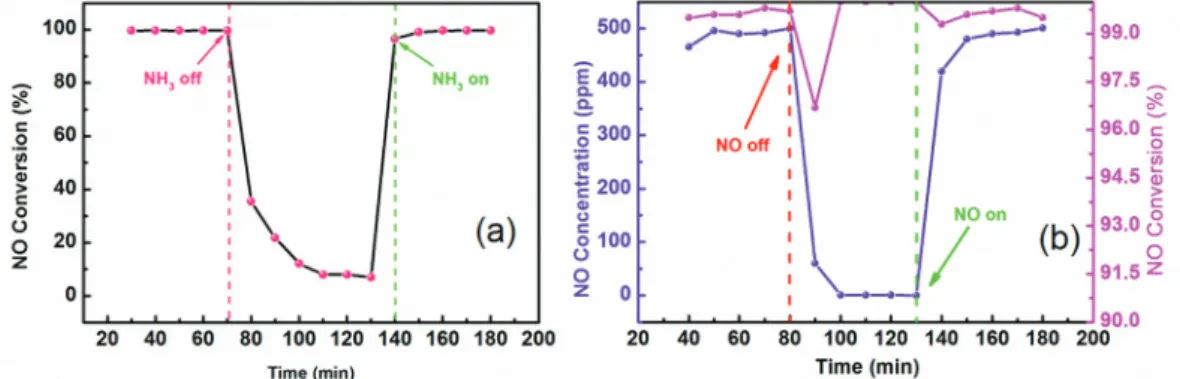
To understand the adsorption characteristics of NH3 on the surface of Mn7.5/FMN catalyst, the transient response characteristics of NH3 were studied at 180 °C. Figure 4a presents the changes of NO conversion activity under different conditions. In the presence of NH3, NO conversion reaches ca. 100% during the first stage, indicating that the more active NH3 species existing on the Mn7.5/FMN catalyst surface can participate in the NO reduction reaction. When the NH3 flow is switched off, NO conversion
rapidly decreases until it stabilizes after half an hour. NO conversion rate is only 10%, suggesting that NO reacts with O2 to produce nitrates and nitrites that are deposited on the catalyst surface, thus, the catalyst maintains lower NO conversion activity.40 When NH
3 is reintroduced into the reaction system, NO conversion rapidly increases and reaches a value close to the original after ca. 10 min. It then increases slowly because the adsorbed NH3 must first react with the nitrate that deposits onto the catalyst surface to regain the active site.41 Finally, NO conversion returns to the original value and remains stable. The NH3 desorption time is therefore longer than its adsorption time, indicating strong adsorption onto the catalytic surface. The reaction cannot occur when NH3 and NO are in the gas phase.42 If the reaction of NO with NH3 occurs, the latter, which should be in the adsorption state, would react with NO. Figure 4a illustrates that the NH3 desorption rate is lower than its adsorption rate, indicating that NH3 can be adsorbed Figure 2. Effects of (a) different NH3/NO ratios and (b) O2 concentrations on the NO conversion activity of the Mn7.5/FMN catalyst calcined at 350 °C.
Reaction conditions: 500 ppm NO, 0-500 ppm NH3, 0-5 vol% O2, balanced with N2.
Figure 3. Effect of H2O on the NO conversion of the Mn7.5/FMN catalyst.
Reaction conditions: 500 ppm NO, 500 ppm NH3, 5 vol% O2, 10 vol%
onto the Lewis acid or Brønsted acid sites present on the catalytic surface.43,44
The transient response characteristics of NO were also studied at 180 °C. Figure 4b presents the changes of NO concentration and conversion under different conditions. When the NO flow was cut off, the NO concentration dropped from 500 to 0 ppm in ca. 20 min and the NO conversion also decreased. When NO was added back to the reaction system, the NO concentration rapidly (in ca. 20 min) returned to the initial level (500 ppm), indicating that the NO adsorption capacity on the Mn7.5/FMN catalyst surface is relatively weak. However, this does not imply that NO cannot be adsorbed onto the catalyst surface. Figure 4b illustrates that the catalyst exhibits high NO conversion activity, indicating that it is capable of adsorbing NO.
SEM analysis
The morphology and structure of the FMN, Mn7.5/FMN and Mn15/FMN catalysts were studied by SEM. The surface of FMN is very smooth and it provides an interconnected porous framework that serves as a support for the active
MnOx species distributed on the catalyst surface (Figure 5). The surfaces of Mn7.5/FMN and Mn15/FMN catalysts are much rougher than that of FMN, indicating that the MnOx species was loaded on the FMN surface. These rough surfaces can easily adsorb a large amount of gas and, thus, the activity of the catalyst increases. Notably, the surface of the Mn7.5/FMN catalyst is rougher than that of Mn15/FMN catalyst, indicating that the excess amount of MnOx loaded can lead to the agglomerate of active substance.
XRD analysis
The overall crystal structure and phase purity of the
Mnx/FMN catalysts were verified by XRD. The XRD
patterns of the different catalysts calcined at 350 °C are illustrated in Figure 6a. The diffraction peaks at 44.7, 52.0 and 76.5° are ascribed to the Ni from the FMN substrate in the FMN, Mn2.5/FMN, Mn7.5/FMN, Mn10/FMN, and Mn15/FMN catalysts (Figure 6a). Only the Ni diffraction peaks were detected and the absence of manganese oxide diffraction peaks was attributed to the amorphous character of manganese oxides.
Figure 4. NH3 (a) and NO (b) transient response curves for Mn7.5/FMN catalyst calcined at 350 °C. Reaction conditions: 500 ppm NO, 500 ppm NH3,
5 vol% O2, balanced with N2.
Figure 6b presents the X-ray diffraction patterns of the Mn7.5/FMN catalyst calcined at different temperatures. Only the Ni diffraction peaks were detected at calcination temperatures of 250 and 350 °C, indicating the presence of amorphous manganese oxides on the surface of the Mn7.5/FMN catalyst. When the calcination temperature reached 450 °C, NiO diffraction peaks were detected at 37.3, 43.3, 55.5, and 62.8° (JCPDS card No. 44-1159), while an α-Mn2O3 diffraction peak appeared at 33.1°. This indicates that part of the Ni was oxidized and the amorphous manganese oxides partially transformed into α-Mn2O3. As the calcination temperature increased further, the intensity of the Ni diffraction peaks decreased, while that of the NiO and α-Mn2O3 peaks increased. This suggests that NiO and α-Mn2O3 formations increase with an increase in temperature. The activity of the Mn7.5/FMN catalyst calcined at 250 and 350 °C was higher than that at 450 and 550 °C (Figure 1b), indicating that for this catalyst, the afforded NiO and α-Mn2O3 exhibit an inhibitory effect on the NO conversion activity of the Mn7.5/FMN catalyst.
XPS analysis
XPS measurements were used to determine the atomic ratios and the valences of the surface components.
Figure 7 displays the O 1s and Ni 2p3/2 XPS spectra of the FMN and Mn7.5/FMN catalysts calcined at 350 °C. The O 1s spectrum was fitted with two characteristic peaks at ca. 529.23 and 530.90 eV ascribed to lattice oxygen (Oα)
and surface-adsorbed oxygen (Oβ), respectively. Notably,
Oα exhibits a higher activity in the redox reaction than
Oβ, thereby promoting NO oxidation and simultaneously
accelerating the “fast SCR” reaction.45,46 Therefore, a study of Oα / (Oα + Oβ) helps to understand the oxidation
performance of the catalyst. Similarly, Ni 2p3/2 spectra were fitted with three characteristic peaks at ca. 853.55, 856.45, and 860.67 eV, ascribed to the main peak and two satellite peaks (represented as sat I and sat II), respectively. Sat I corresponds to Ni3+ species, Ni2+–OH species, and Ni2+ vacancies, while sat II was attributed to ligand-metal charge transfer.47,48
Figure 6. X-ray diffraction patterns of (a) various catalysts calcined at 350 °C and (b) the Mn7.5/FMN catalyst calcined at different temperatures (250,
350, 450 and 550 °C).
The results afforded from the XPS analysis (Table 1) provide a better insight into the effects of each component on de-NOx. A comparison of the results afforded by the Mn7.5/FMN and FMN catalysts reveals an improvement in the sat I and sat II ratios after Mn was added. This indicates the presence of more unsaturated Ni atoms and structural defects on the surface of the Mn7.5/FMN catalyst as well as interactions between the Mn and Ni atoms. In addition, the presence of Oα species is beneficial to NH3-SCR.49,50 These factors contribute towards the increase in activity observed for the Mn7.5/FMN catalyst.
Figure 8 presents the O 1s, Ni 2p3/2 and Mn 2p3/2 spectra for the Mn7.5/FMN catalysts calcined at 350 and 550 °C. The Mn 2p3/2 spectra were fitted with three characteristic peaks at ca. 640.0, 642.0, and 644.2 eV, ascribed to Mn2+, Mn3+, and Mn4+, respectively.51 Mn4+ has been reported to exhibit a strong redox ability that can promote a “fast SCR” reaction.52 Moreover, out of all its valence states the Mn3+ intermediate valence state exhibits better conversion capacity and thus, it can promote the catalytic activity of the catalyst. We therefore concluded that Mn4+ and Mn3+ play very important roles in the low-temperature NH3-SCR reaction.
The results from Mn7.5/FMN XPS analysis are listed in Table 2. The Mn4+ and Mn3+ contents on the catalyst surface exhibit little change with increasing calcination temperature, however, there are significant changes in sat I and sat II. Notably, the sat I (main peak) and sat II (main peak) ratios for the Mn7.5/FMN catalyst calcined at 350 °C are larger than those of the Mn7.5/FMN catalyst calcined at 550 °C, illustrating that there are more unsaturated Ni atoms and structural defects on the surface of the former
catalyst. In addition, the ratio of Oα on the surface of the
Mn7.5/FMN catalyst calcined at 550 °C is larger than that of the Mn7.5/FMN catalyst calcined at 350 °C. As discussed above (sub-section “Effects of calcination temperature and Mn loading on catalytic activity”), the Mn7.5/FMN catalyst calcined at 350 °C exhibits higher activity. This indicates that the Oα ratio does not have a crucial effect on the activity
of the Mn7.5/FMN catalyst. For the Mn7.5/FMN catalysts at different calcination temperatures, sat I and sat II play more important roles in NO conversion. Moreover, a combination of these results with the XRD results demonstrates that when the calcination temperature is raised to 550 °C, the Mn crystallinity of the Mn7.5/FMN catalyst improves, while active Mn decreases. Thus, the presence of active Mn, more unsaturated Ni atoms, and structural defects on the surface of the Mn7.5/FMN catalyst all contribute towards better NH3-SCR performance.
NH3-TPD analysis
Based on the mechanism of the NH3-SCR reaction at low temperature, the surface acidity of the catalyst plays a very important role in the whole process.52,53 Thus, the acid sites on the catalyst surface were investigated via NH3-TPD analysis. Figure 9 illustrates the NH3-TPD profiles of the Mn7.5/FMN catalyst calcined at 350 and 550 °C. The Mn7.5/FMN catalyst calcined at 350 °C exhibits four distinct desorption peaks located at 127.2, 277.1, 421.1, and 645.6 °C. On the other hand, three peaks centered at 127.2, 421.1, and 645.6 °C were observed in the TPD profile of the Mn7.5/FMN catalyst calcined at 550 °C. Desorption peaks at temperatures of 80-150, 150-300, and > 300 °C
Table 1. XPS results of FMN and Mn7.5/FMN catalysts calcined at 350 °C
Catalyst Sat I (main peak) Sat II (main peak) (Oα / Ototal) × 100 / %
FMN 1.73 3.14 41.50
Mn7.5/FMN 3.04 4.68 45.50
Sat I: Ni3+ species, Ni2+–OH species, and Ni2+ vacancies; sat II: ligand-metal charge transfer; Oα: lattice oxygen; FMN: foamed metal nickel.
have been assigned to weak, medium, and strong acid sites, respectively.54,55 Comparison of the TPD profile of the Mn7.5/FMN catalyst calcined at 350 and 550 °C suggests that the peak areas located at the weak and medium acid sites are larger for the catalyst calcined at 350 °C, while the peak areas of its strong acid sites are smaller. This indicates an increase in NH3 adsorbance and in the number of acid sites on the surface of the Mn7.5/FMN catalyst calcined at 350 °C at low temperature. Generally, more acid sites are conducive to the adsorption of reactive gases and thus, the activity of the Mn7.5/FMN catalyst calcined at 350 °C is higher than that of the Mn7.5/FMN catalyst calcined at 550 °C at low temperature. This demonstrates that the surface acidity plays an important role in the low-temperature NH3-SCR reaction of the Mn7.5/FMN catalyst and that NH3 adsorption onto the weak acid sites of the Mn7.5/FMN catalyst calcined at 350 °C is more favorable.
NO removal mechanism
The catalytic mechanism of the Mn7.5/FMN catalyst, based on the data afforded in the above mentioned studies (sections “Adsorption performance of the catalyst” and “NH3-TPD analysis”), is presented in Figure 10. Data from the NH3 and NO transient responses and NH3-TPD analysis confirm that the Mn7.5/FMN catalyst can adsorb NH3 as well as adsorb NO, leading to the conclusion that the NH3-SCR reaction of the Mn7.5/FMN catalyst corresponds
to the Eley-Rideal (E-R) and Langmuir-Hinshelwood (L-H) mechanisms.31,56 For the E-R mechanism, the redox reaction takes place between active NH3 and gaseous NO. The adsorbed NH3 is activated at the weak acid site on the surface of the catalyst, with the adsorption and activation of NH3 as the critical step. On the other hand, for the L-H mechanism, the NO of the gas phase first interacts with O2 and subsequently the NOx is adsorbed onto the surface of the catalyst where it is oxidized to nitrates and nitrites in the role of lattice oxygen. Finally, the adsorbed activated NH3 reacts with the nitrates and nitrites to generate nitrogen and water. However, as discussed above (section “Adsorption performance of the catalyst”), the Mn7.5/FMN catalyst adsorption capacity of NH3 is stronger than that of NO, indicating the E-R mechanism as the main mechanism of the NH3-SCR reaction of the Mn7.5/FMN catalyst.
Conclusions
A series of Mnx/FMN catalysts were prepared by the impregnation method to study the effects of calcination temperature, amount of added Mn, optimal operating conditions, and H2O on low-temperature NO conversion. The Mn7.5/FMN catalyst calcined at 350 °C exhibited excellent NH3-SCR activity of NO and very superior H2O resistance. The Mn2O3 and NiO species were found Table 2. XPS results of the Mn7.5/FMN catalyst calcined at 350 and 550 °C
Calcination
temperature / °C (Mn
4+ / Mn
total) × 100 / % (Mn 3+ / Mn
total) × 100 / % Sat I (main peak) Sat II (main peak) (Oα / Ototal) × 100 / %
350 46.15 33.25 3.04 4.68 45.50
550 46.08 32.51 2.74 2.35 55.38
Sat I: Ni3+ species, Ni2+–OH species, and Ni2+ vacancies; sat II: ligand-metal charge transfer; Oα: lattice oxygen.
Figure 9. NH3-TPD profiles of the Mn7.5/FMN catalyst calcined at 350
and 550 °C.
to exhibit a better crystallinity when the calcination temperature exceeded 350 °C. However, these species brought about a decrease in catalytic activity. The unsaturated Ni atoms, structural defects, and number of surface acid sites on the surface of the Mn7.5/FMN catalyst calcined at 350 °C were greater than those of the Mn7.5/FMN catalyst calcined at 550 °C. This is responsible for the excellent catalytic activity of the former catalyst. The superior H2O resistance of the Mn7.5/FMN catalyst calcined at 350 °C at low temperature can be attributed to the strong NH3 adsorption on the acid sites. The reaction of Mn7.5/FMN catalysts corresponds to both E-R and L-H mechanisms, however, the E-R mechanism plays a role in the NH3-SCR reaction of the Mn7.5/FMN catalyst.
Acknowledgments
We greatly appreciate the financial support provided by the National Natural Science Foundation of China (No. 51676001, 51376007, U1660206), the Anhui Provincial Natural Science Foundation (No. 1608085ME104), the key projects of Anhui province university outstanding youth talent (No. gxyqZD2016074, gxyqZD2017038), the Funding Projects of Back-up Candidates (No. 2017H131) and the Anhui Provincial Education Foundation (No. KJ2016A090).
References
1. Skalska, K.; Miller, J. S.; Ledakowicz, S.; Sci. Total Environ. 2010, 408, 3976.
2. Beirle, S.; Boersma, K. F.; Platt, U. M.; Lawrence, G.; Wagner, T.; Science2011, 333, 1737.
3. Forzatti, P.; Nova, I.; Tronconi, E.; Angew. Chem., Int. Ed. 2009,
48, 8366.
4. Mou, X.; Zhang, B.; Li, Y.; Yao, L.; Wei, X.; Su, D. S.; Shen, W.; Angew. Chem., Int. Ed.2012, 51, 2989.
5. Väliheikki, A.; Kolli, T.; Huuhtanen, M.; Maunula, T.; Kinnunen, T.; Riitta, L.; Keiski, R. T.; Top. Catal.2013, 56, 602.
6. Xue, J.; Wang, X.; Qi, G.; Wang, J.; Shen, M.; Li, W.; J. Catal. 2013, 297, 56.
7. Kim, Y. J.; Lee, J. K.; Min, K. M.; Hong, S. B.; Nam, I. S.; Cho, B. K.; J. Catal.2014, 311, 447.
8. Wang, D.; Zhang, L.; Li, J.; Kamasamudram, K.; Epling, W. S.; Catal. Today2014, 231, 64.
9. Li, P.; Xin, Y.; Li, Q.; Wang, Z. P.; Zhang, Z. L.; Zheng, L. R.;
Environ. Sci. Technol. 2012, 46, 9600.
10. Guan, B.; Zhan, R.; Lin, H.; Huang, Z.; Appl. Therm. Eng. 2014,
66, 395.
11. Kompio, P. G. W. A.; Brückner, A.; Hipler, F.; Auer, G.; Löffler, E.; Grünert, W.; J. Catal. 2012, 286, 237.
12. Wang, X.; Shi, A.; Duan, Y.; Wang, J.; Shen, M.; Catal. Sci. Technol.2012, 2, 1386.
13. Guo, R. T.; Wang, Q. S.; Pan, W. G.; Zhen, W. L.; Chen, Q. L.; Ding, H. L.; Yang, N. Z.; Lu, C. Z.; Appl. Surf. Sci.2014, 317, 111.
14. Yang, S.; Fu, Y.; Liao, Y.; Xiong, S.; Qu, Z.; Yan, N.; Li, J.;
Catal. Sci. Technol. 2014, 4, 224.
15. Zhang, R.; Yang, W.; Luo, N.; Li, P.; Lei, Z.; Chen, B.; Appl. Catal., B 2014, 146, 94.
16. Boningari, T.; Smirniotis, P. G.; Thirupathi, B.; Smirniotis, P. G.; Appl. Catal., B2011, 110, 195.
17. Thirupathi, B.; Smirniotis, P. G.; J. Catal.2012, 288, 74. 18. Peña, D. A.; Uphade, B. S.; Reddy, E. P.; Smirniotis, P. G.;
J. Phys. Chem. B 2004, 108, 9927.
19. Ettireddy, P. R.; Ettireddy, N.; Mamedov, S.; Boolchand, P.; Smirniotis, P. G.; Appl. Catal., B2007, 76, 123.
20. Kapteijn, F.; Rodriguez-Mirasol, J.; Moulijn, J. A.; Appl. Catal., B 1996, 9, 25.
21. Wang, L.; Huang, B. C.; Su, Y. X.; Zhou, G. Y.; Wang, K. L.; Luo, H. C.; Ye, D. Q.; Chem. Eng. J. 2012, 192, 232. 22. Yu, G. F.; Wei, Y. F.; Jin, R. B.; Zhu, H.; Gu, Z. Y.; Pan, L. L.;
J. Environ. Sci.2012, 32, 1743.
23. Smirniotis, P. G.; Sreekanth, P. M.; Pena, D. A.; Jenkins, R. G.;
Ind. Eng. Chem. Res.2006, 45, 6436.
24. Wang, L.; Huang, B.; Su, Y.; Zhou, G.; Wang, K.; Luo, H.; Ye, D.; Chem. Eng. J.2012, 192,232.
25. Jiang, B. Q.; Liu, Y.; Wu, Z. B.; J. Hazard. Mater.2009, 162, 1249.
26. Gao, R.; Zhang, D.; Maitarad, P.; Shi, L.; Rungrotmongkol, T.; Li, H.; Zhang, J.; Cao, W.; J. Phys. Chem. C2013, 117, 10502. 27. Sultana, A.; Sasaki, M.; Hamada, H.; Catal. Today2012, 185,
284.
28. Zhang, J.; Baro, M. D.; Pellicer, E.; Sort, J.; Nanoscale2014,
6, 12490.
29. Zhang, L.; Xiong, K.; Chen, S. G.; Li, L.; Deng, Z. H.; Wei, Z. D.; J. Power Sources2015, 274, 114.
30. Yuan, C.; Wu, H. B.; Xie, Y.; Lou, X. W.; Angew. Chem., Int. Ed.2014,53, 1488.
31. Lin, Z.; Lei, Z.; Qu, H. X.; Zhong, Q.; J. Mol. Catal. A: Chem.
2015, 409, 207.
32. Chen, J.; Zhu, B.; Sun, Y.; Yin, S.; Zhu, Z.; Li, J.; J. Braz. Chem.
Soc. 2018, 29, 79.
33. Wang, J. H.; Dong, X. S.; Wang, Y. J.; Li, Y. D.; Catal. Today 2015, 245, 10.
34. Yoon, D. Y.; Park, J. H.; Kang, H. C.; Kim, P. S.; Nam, I. S.; Yeo, G. K.; Kil, J. K.; Cha, M. S.; Appl. Catal., B 2011, 101, 275.
35. Bosch, H.; Janssen, F. J. J. G.; Kerkhof, F. M. G. V. D.; Jaap, O.; Jan, G. V. O.; Julian, R. H. R.; Appl. Catal. 1986, 25, 239. 36. Liu, F. D.; He, H.; Lian, Z. H.; Shan, W. P.; Xie, L. J.; Asakura,
37. Huang, Z.; Liu, Z.; Zhang, X.; Liu, Q.; Appl. Catal., B 2006,
63, 260.
38. Hu, P. P.; Huang, Z. W.; Hua, W. M.; Gu, X.; Tang, X. F.; Appl. Catal., A2012, 437-438, 139.
39. Turco, M.; Lisi, L.; Pirone, R.; Ciambelli, P.; Appl. Catal., B 1994, 3, 133.
40. Si, Z. C.; Weng, D.; Wu, X. D.; Ma, Z. R.; Ma, J.; Ran, R.;
Catal. Today2013, 201, 122.
41. Kijlstra, W. S.; Brands, D. S.; Smit, H. I.; Bliek, A.; J. Catal. 1997, 171, 219.
42. Larrubia, M. A.; Ramis, G.; Busca, G.; Appl. Catal., B 2000,
27, 145.
43. Lin, S. D.; Gluhoi, A. C.; Nieuwenhuys, B. E.; Catal. Today 2004, 90, 3.
44. Chen, T.; Guan, B.; Lin, H.; Zhu, L.; Chin. J. Catal. 2014, 35, 294.
45. Zhao, B.; Ke, X. K.; Bao, J. H.; Wang, C. L.; Dong, L.; Chen, Y. W.; Chen, H. L.; J. Phys. Chem. C2009, 113, 14440. 46. Zhang, L.; Zhang, D. S.; Zhang, J. P.; Cai, S. X.; Fang, C.;
Huang, L.; Li, H. R.; Gao, R. H.; Shi, L. Y.; Nanoscale2013,
5, 9821.
47. Zhao, B.; Ke, X. K.; Bao, J. H.; Wang, C. L.; Dong, L.; Chen, Y. W.; Chen, H. L.; J. Phys. Chem. C2010, 113, 14440. 48. Cai, S. X.; Zhang, D. S.; Shi, L. Y.; Xu, J.; Zhang, L.; Huang,
L.; Li, H. R.; Zhang, J. P.; Nanoscale2014, 6, 7346. 49. Liu, F. D.; He, H.; J. Phys. Chem. C2010, 114, 16929. 50. Shan, W.; Liu, F.; He, H.; Shi, X.; Zhang, C.; Chem. Commun.
2011, 47, 8046.
51. Pena, D. A.; Uphade, B. S.; Smirniotis, P. G.; J. Catal. 2004,
221, 421.
52. Liu, Y.; Xu, J.; Li, H. R.; Cai, S. X.; Hu, H.; Fang, C.; Shi, L. Y.; Zhang, D. S.; J. Mater. Chem. A2015, 3, 11543.
53. Xu, L.; Li, X. S.; Crocker, M.; Zhang, Z. S.; Zhu, A. M.; Shi, C.; J. Mol. Catal. A: Chem.2013, 378, 82.
54. Roy, S.; Viswanath, B.; Hegde, M. S.; Madras, G.; J. Phys. Chem. C2008, 112, 6002.
55. Xu, H. D.; Wang, Y.; Cao, Y.; Fang, Z. T.; Lin, T.; Gong, M. C.; Chen, Y. Q.; Chem. Eng. J. 2014, 240, 62.
56. Lin, Z.; Zhong, Z. P.; Han, Y.; Wang, C. H.; J. Colloid Interface Sci.2016, 478, 11.
Submitted: October 20, 2017
Published online: March 8, 2018