Genetic diversity analysis of Cuban traditional rice (
Oryza sativa
L.) varieties
based on microsatellite markers
Alba Alvarez
1, Jorge Luis Fuentes
2, Violeta Puldón
3, Pedro Julio Gómez
3, Leonor Mora
1,
Miriam C. Duque
4, Gerardo Gallego
4and Joe M. Tohme
41
Departamento de Radiobiología, Centro de Aplicaciones Tecnológicas y Desarrollo Nuclear,
Ciudad de la Habana, Cuba.
2
Escuela de Biología, Facultad de Ciencias, Universidad Industrial de Santander, Bucaramanga, Colombia.
3Departamento de Mejoramiento Genético, Instituto de Investigaciones del Arroz, Bauta, La Habana, Cuba.
4Centro Internacional de Agricultura Tropical, Cali, Colombia.
Abstract
Microsatellite polymorphism was studied in a sample of 39 traditional rice (Oryza sativa L.) varieties and 11 improved varieties widely planted in Cuba. The study was aimed at assessing the extent of genetic variation in traditional and improved varieties and to establish their genetic relationship for breeding purposes. Heterozygosity was analyzed at each microsatellite loci and for each genotype using 10 microsatellite primer pairs. Between varieties genetic rela-tionship was estimated. The number of alleles per microsatellite loci was 4 to 8, averaging 6.6 alleles per locus. Higher heterozygosity (H) was found in traditional varieties (HTV= 0.72) than in improved varieties (HIV= 0.42), and 68% of the total microsatellite alleles were found exclusively in the traditional varieties. Genetic diversity, repre-sented by cluster analysis, indicated three different genetic groups based on their origin. Genetic relationship esti-mates based on the proportion of microsatellite loci with shared alleles indicated that the majority of traditional varieties were poorly related to the improved varieties. We also discuss the more efficient use of the available genetic diversity in future programs involving genetic crosses.
Key words:genetic diversity, microsatellite, rice, traditional germplasm. Received: November 6, 2006; Accepted: May 17, 2007.
Introduction
In Cuba, the genetic breeding of rice (Oryza sativa) is
mainly conducted at the Cuban Rice Research Institute (Instituto de Investigaciones del Arroz (IIArroz) Cuba) and is characterized by the use of consanguineous parent plants mainly introduced from the International Rice Research Institute (IRRI, Philippines), the International Center for Tropical Agriculture (Centro Internacional de Agricultura Tropical (CIAT), Colombia) and improved varieties devel-oped in our country. These improved rice varieties are char-acterized by a limited genetic base which can be traced back to just six maternal cytoplasm sources. All the improved varieties are grown under irrigated lowland con-ditions and are semi-dwarfO. sativasubspeciesindica
ge-notypes which present a high field genetic uniformity because rice production in Cuba during the last 30 years
was mainly undertaken using an extensive system based on a limited number of these improved varieties (Fuenteset al., 2004).
Since 1996 the profile of the Cuban rice crop has changed, and today nearly 60% of the total rice production comes from local farmers growing traditional varieties of unclear origin or improvedin situvarieties under mainly
ir-rigated lowland conditions. Many of the traditional variet-ies are probably locally adapted farmer’s selections from varieties from the United States (US) that showed good grain quality and local adaptability and were introduced be-fore the beginning of the Cuban rice breeding program. However, the genetic relationship among traditional variet-ies and between these materials and the improved varietvariet-ies released by IIArroz remained unknown.
Molecular marker technologies can assist conven-tional breeding efforts and are valuable tools for the analy-sis of genetic relatedness and the identification and selec-tion of desirable genotypes for crosses as well as for germplasm conservation in gene banks. Single sequence repeats markers (microsatellites) are co-dominant, www.sbg.org.br
Send correspondence to Jorge Luis Fuentes. Escuela de Biología, Facultad de Ciencias, Universidad Industrial de Santander, Apartado Aéreo 678, Ciudad Universitaria, Carrera 27, Calle 9, Bucaramanga, Colombia. E-mail: [email protected] or [email protected].
hypervariable, abundant and well distributed throughout the rice genome (Temnykhet al., 2001). About 2240
micro-satellite markers are now available through the published high-density linkage map (McCouchet al., 2002) or public
database. Moreover, multiplex microsatellite marker pan-els have been designed for high throughput analyses and semi-automated genotyping (Coburnet al., 2002). The
ap-plication of microsatellites markers in rice include charac-terization of the genetic structure of the cultivated riceO. sativaat both the inter and intra-varietal level (Olufowote et al., 1997; Garriset al., 2005), genetic diversity and/or
evolutionary analyses of landraces, weedy and wild rice germplasm (Yanget al., 1994; Vaughanet al., 2001; Niet al., 2002; Gao, 2004, 2005; Gaoet al., 2005), determination
of the purity of breeding material or seed stocks (Olufowote
et al., 1997), prediction of hybrid performance and
hete-rosis (Xiaoet al., 1996a) and the analyses and tagging of
valuable quantitative trait loci (QTL) and genes (Xiaoet al., 1996b; Zouet al., 2000).
Our hypothesis is that traditional rice varieties locally cultivated by farmers that were either not used, or poorly used, as parents in the Cuban rice breeding program repre-sent alternative genetic pools to the improved varieties. To corroborate this hypothesis, microsatellite markers were used for the genetic diversity analysis of a sample of 39 tra-ditional varieties and 11 varieties representing a significant portion of the rice cultivated in Cuba by the extensive sys-tem of state companies. This study was aimed assessing the extent of genetic variation in the traditional and improved rice varieties and establishing their genetic relationships for breeding purposes.
Materials and Methods
Rice materials
We investigated 39 traditional rice varieties (Oryza sativa), collected from 1975 to 1985 at different farms in Cuba and held at the IIArroz Rice Germplasm Bank, and 11 varieties commercially exploited in Cuba (Fuenteset al., 2003) (Table 1).
Microsatellite assay
For each variety, 20 seeds were planted in a green-house and leaves from 20-day old seedlings were collected for DNA extraction (Dellaportaet al.1983). The
polymer-ase chain reaction (PCR) was conducted in a final volume of 20µL containing 20 ng of template DNA, 0.1µL of a 20µM solution of each of the primers presented in Table 2, 250µM of each dNTP, 1.8 mM of MgCl2and 1 unit of Taq
DNA polymerase (Promega, USA). The reaction was pro-cessed at 94 °C for 3 min, followed by 34 cycles of 94 °C for 30 s, 54 °C for 30 s and 72 °C for 1 min and a final 5 min extension at 72 °C. After the reaction, 5µL of stop solution (95% (w/v) formamide, 20 mM EDTA, 0.05% (w/v) bro-mophenol blue and 0.05% (w/v) xylene-cyanol) was added
to the amplification product and 3µL samples loaded onto 6% (w/v) polyacrylamide denaturing gels containing 6 M urea. A silver-staining procedure (Cho et al., 1996) was used to reveal bands after electrophoresis.
Data analysis
Because of the codominance of the markers, micro-satellites were scored as homozygotic and heterozygotic genotypes. The gene diversity or heterozygosity (Nei, 1973) of the polymorphic loci was calculated as:
H Pi i
n = −
=
∑
1 2
1
wherePiis the allele frequency for theith
al-lele and n is the number of alal-leles analyzed. The arithmetic
mean diversity was calculated as:Hav Hi n
i n =
=
∑
1
/ , wheren
is the number of microsatellite primer pairs (loci) analyzed. Heterozygosity values were corrected by the sample size as:Hi =nHi /n−1, wherenthe number of genotypes in the
sample. For each genotype, heterozygosity was expressed as the percentage of loci at which the genotype is heterozy-gous out of the total possible number of 10 loci. The parti-tioning of genetic variation in the total variety sample was studied considering the traditional and improved rice eties as subgroups. The gene frequencies of these two vari-ety subgroups were compared by means of the chi-squared (χ2) test (p < 0.05).
Genetic relationship between genotypes (Sxy) were
calculated as the proportion of microsatellites loci with shared allele (Lynch, 1990), which is equivalent to the F statistic (Nei and Li, 1979). Thus, Sxy= 0 if none of the 10
microsatellite loci had alleles common to both genotypes, whereas Sxy= 0.5 if the genotypes had identical alleles at 5
of the 10 microsatellite loci. In a germplasm collection con-sisting ofnvarieties, each variety can be compared with the other varieties (n– 1) times so that (n– 1) Sxycan be
ob-tained. An average Sxy can be obtained for each variety
from the (n– 1) Sxy(Xuet al., 2004). Therefore, this index
was used for identifying the more genetically diverse vari-eties for breeding purposes. For the diversity representa-tion, a genetic relationship matrix was used to produce a dendrogram in a sequential agglomerative hierarchical nes-ted cluster analysis (SAHN), based on the unweighnes-ted pair group method with arithmetic mean (UPGMA) using the NTSYS-pc package (Rohlf, 1997; Exeter Software, Setauket, USA).
Results
Allele number, allele frequency and heterozygosity
Table 1- Characteristics of the 50 Cuban rice varieties held at the Cuban Rice Research Institute (CRRI) and used in the present study. Heterozygosity (H) expressed as the percentage of loci at which the genotype was heterozygous out of the total of 10 possible loci. Mean proportion of microsatellite loci with shared alleles (Sxy). Ordered by date and province, unless otherwise indicated, all varieties came from Cuba.
Origin and year of collection or release
Variety type and name Origin Year H Sxy Unique alleles
Traditional
Blue Bonnet Introduced from the United States 1971 0.20 42
Cuba C-65 Santiago de las Vegas district, Havana City 1975 0.30 37
Cuba C-103 Santiago de las Vegas district, Havana City 1975 0.10 41
Jabao Consolación del Norte district, Pinar del Rio province 1975 0.20 47
Espiritista Consolación del Norte district, Pinar del Rio province 1975 0.10 43
Negrón Consolación del Norte district, Pinar del Rio province 1975 0.20 33 2
Selección 143 Consolación del Sur district, Pinar del Río province 1975 0.40 24 3
Selección 132 Consolación del Sur district, Pinar del Río province 1975 0.10 25 1
Arroz tres cuartos Bahía Honda district, Pinar del Rio province 1975 0.40 39 1
Caña Verde Bahía Honda district, Pinar del Rio province 1975 0.10 36
Blanquito Perico district, Matanzas province 1975 0.10 43
Selección 138 Ciénaga de Zapata district, Matanzas province 1975 0.00 11 1
Arroz Bolito Florida, district Camagüey province 1975 0.40 35 1
Gloria Florida district, Camagüey province 1975 0.30 38
Nira Chambas district, Camagüey province 1975 0.10 41
Selección 29 Chambas district, Camagüey province 1975 0.30 41
Selección 30 Chambas district, Camagüey province 1975 0.80 31
Amarillón Grande Ciego de Ávila province 1975 0.10 38
Selección 28 Ciego de Ávila province 1975 0.10 36
Mezcla 69 Ciénaga de Zapata district, Matanzas province 1975 0.40 40
Selección 135 Granma province 1975 0.20 16
Selección 142 Granma province 1975 0.60 28
Brasileño Mayajigua district, Villa Clara province 1975 0.40 38
Selección 31 Mayajigua district, Villa Clara province 1975 0.40 38
Siete Estrellas Blanco Mayajigua district, Villa Clara province 1975 0.20 43
Blue Bonnet Amarillo II Mayajigua district, Villa Clara province 1976 0.40 44
Jorge Valladares Cárdenas district, Matanzas province 1976 0.00 18 1
Selección Blanquito Cárdenas district, Matanzas province 1976 0.20 38
Matancero Cárdenas district, Matanzas province 1976 0.40 38
Caña Verde I Unión de Reyes district, Matanzas province 1976 0.00 20
Rexoro Granma province 1976 0.50 47
Selec. Tres Provincias CRRI, Havana. province 1976 0.10 43
Nira II Havana province 1983 0.10 40
M-2 Matanzas province 1983 0.50 39
Pati Prieto II Matanzas province 1983 0.50 35
Selección en IR-880 (II) Matanzas province 1983 0.10 34
M-4 Matanzas province 1983 0.50 28 2
Selección INIFAT Encrucijada district, Villa Clara province 1986 0.30 37 1
Commercial
Jucarito-104 CRRI, Havana. province 1981 0.20 35
Amistad-82 CRRI, Havana. province 1984 0.20 29
Perla de Cuba CRRI, Havana. province 1991 0.00 25
IACuba14 CRRI, Havana. province 1991 0.00 24
IACuba16 CRRI, Havana. province 1991 0.00 24
IACuba19 CRRI, Havana. province 1992 0.20 32
IACuba23 CRRI, Havana. province 1993 0.00 25 1
IACuba20 CRRI, Havana. province 1993 0.10 25
IACuba21 CRRI, Havana. province 1993 0.10 31
IACuba24 CRRI, Havana. province 1993 0.00 24
variant as an allele. The number of alleles per microsatellite loci ranged from 4 in the RM-18 to 8 in the RM-4, RM-167 and RM-202 (Table 3). In accordance with previous studies (Wu and Tanksley, 1993; Niet al., 2002; Luet al., 2005), the
average number of alleles per locus was 6.6, a value higher than that reported by Xiaoet al.(1996b) surveying elite
in-bred lines but slightly lower than those found by Yanget al.
(1994), Xuet al.(2004) and Gaoet al.(2005) studying a
larger sample of landraces and/or commercial varieties. Very frequent alleles were considered to be those oc-curring in more than 10% of the varieties in the collection, while rare alleles were classified as occurring in between 2% and 10% of the varieties in the collection. In our study, alleles at microsatellite loci were detected with very
differ-ent frequencies in the differdiffer-ent genotypes, with 37 very fre-quent alleles being identified at the ten microsatellite loci while 15 rare alleles were identified at 7 microsatellite loci. A total of 14 unique alleles were detected at eight micro-satellite loci (Table 1). Ten of the rice varieties, represent-ing 20% of the collection, had unique alleles for at least one microsatellite locus, 7 of which had a unique allele at only one marker locus. The varieties with the highest number of unique alleles were Negrón (2), Selección 143 (3) and M-4 (2).
The expected total heterozygosity (HT) of the
micro-satellite polymorphic loci was between 0.60 for RM-167 and 0.85 for RM-18 markers, with an average value of HT = 0.75. When heterozygosity for each variety was
Table 2- The microsatellite primers used in this study came from a study of polymorphic microsatellite primer pairs from Latin American rice varieties (G. Gallego, personal communication). The size (bp) of the polymerase chain reaction (PCR) product and number of perfect repeats refer to variety IR-36. Ordered by linkage group.
Locus name
Linkage group
Simple repeat sequences Size (bp)
Primer sequences Source
Forward primer (5’→3’) Reverse primer (5’→ 3’)
RM-5 1 TTAA(GA)14GGCT 113 tgc aac ttc tag ctg ctc ga gca tcc gat ctt gat ggg Panaudet al., (1996)
RM-168 3 CGG(T)15(GT)14TTC 116 tgc tgc ttg cct gct tcc ttt gaa acg aat caa tcc acg gc Wu and Tanksley (1993)
RM-7 3 CCTT(GA)19CCGA 180 ttc gcc atg aag tct ctc g cct ccc atc att tcg ttg tt Panaudet al., (1996)
RM-13 5 ATTA(GA)6TA(GA)TA(GA)16TTGG 141 tcc aac atg gca aga gag ag ggt ggc att cga ttc cag Panaudet al., (1996) RM-225 6 (CT)18 140 tgc cca tat ggt ctg gat g gaa agt gga tca gga agg c Chenet al., (1997)
RM-18 7 ACGT(GA)4AA(GA)(AG)16TGAA 157 ttc cct ctc atg agc tcc at gag tgc ctg gcg ctg tac Panaudet al., (1996)
RM-11 7 GACA(GA)17GAAA 140 tct cct ctt ccc ccg atc ata gcg ggc gag gct tag Panaudet al., (1996)
RM-167 11 GGAA(GA)16GGGG 128 gat cca gcg tga gga aca cgt agt ccg acc aca agg tgc gtt gtc Wu and Tanksley (1993)
RM-4B 11 TCTC(AG)16TTTG 159 ttg acg agg tca gca ctg ac agg gtg tat ccg act cat cc Panaudet al., (1996) RM-202 11 (CT)30 189 cag att gga gat gaa gtc ctc c cca gca agc atg tca atg ta Chenet al., (1997)
RM-4A 12 TCTC(AG)16TTTG 159 ttg acg agg tca gca ctg ac agg gtg tat ccg act cat cc Panaudet al., (1996)
Table 3- Allele number, allele frequency and heterozygosity of the ten polymorphic microsatellite loci studied. Ordered first by total number of alleles
and then by number of frequent alleles.
Microsatellite markers (fragment length in bp)
Alleles Polymorphic loci expected heterozygosity (H)
Total alleles
Frequent alleles*
Rare
alleles† Uniquealleles‡ varieties (HTraditional TV)
Improved varieties (HIV)
All varieties
RM18 (150-173) 4 3 (1) 1 0.46 0.51 0.60
RM13 (134-162) 5 3 (1) 2 0.58 0.27 0.66
RM225 (125-147) 6 5 (2) 1 0.77 0.55 0.80
RM7 (168-184) 6 3 (1) 2 1 0.69 0.55 0.75
RM11 (124-148) 7 5 (3) 1 1 0.70 0.51 0.76
RM5 (108-129) 7 4 (3) 3 0.78 0.00 0.75
RM168 (143-171) 7 3 (2) 2 2 0.69 0.47 0.75
RM202 (160-190) 8 6 (3) 2 0.81 0.58 0.85
RM4 (141-159) 8 3 (1) 3 2 0.72 0.40 0.73
RM167 (128-162) 8 2 (1) 4 2 0.79 0.00 0.72
Mean gene diversity within subgroups 0.70 0.38
Overall gene diversity in the collection 0.74
calculated (Table 1), this ranged between zero and 0.80. As expected for cultivated rice, a high degree of homozygosis was observed. Thus, the majority of rice varieties showed a single allele in their respective microsatellite profiles. Out of a total of 500 amplification profiles (50 genotypes x 10 primer pairs) scored in this study, 109 (22%) showed two alleles and 387 (77%) showed a single allele. Interestingly, four varieties (Jabao, Rexoro, Pati Prieto II and Selection 30) showed three alleles each for the RM-4 primer pair. Since RM-4 locus is duplicated in chromosomes 11 and 12 of the rice genome (Panaudet al., 1996) it is possible to
de-tect up to four alleles for this locus.
Comparison of variability in traditional and improved varieties
In accordance with previous studies (Yang et al.,
1994; Xuet al., 2004), heterozygosity was higher in the
tra-ditional varieties (HTV) than in the improved varieties (HIV)
with HTV= 0.72 > HIV= 0.42 (χ2test, p < 0.05). In terms of
the genetic diversity documented in the entire set of variet-ies, the traditional varieties included 98% (65/66) of the microsatellite alleles detected in this study while the im-proved varieties included 32% (21/66). At microsatellite loci, a total of 45 alleles (68%) were found exclusively in the traditional varieties while only one allele (2%) was found in the improved varieties. Furthermore, 20 (30%) of microsatellite alleles were common to traditional and im-proved varieties, contrasting with the results of Yanget al., (1994) who reported that about 72% of the microsatellite alleles observed in landraces were incorporated into elite varieties. The result obtained in our present study was not surprising because the traditional varieties were either poorly used, or not used, as parents in the Cuban rice breed-ing program.
Genetic relationship between varieties
A cluster analysis based on genetic similarity esti-mates is shown in Figure 1. Considering a truncate level of 0.7, three variety groups (I-III) were obtained. Groups I and III included only traditional varieties, while Group II clus-tered all the improved varieties and a few of the traditional varieties which had probably been derived from the im-proved varieties. The subgrouping of the imim-proved variet-ies within Group II was basically in accordance with their genealogies, with, for example, the related genotypes Juca-rito-104 being placed in the IIa subgroup and Amistad-82 into the IIb subgroup as reported in a previous study (Fuen-teset al., 2003).
Group I may correspond to thetropical japonicasrice
subspecies group since it included some US varieties (i.e.
Rexoro, Blue Bonnet and Nira) previously assigned to this subspecies group by Luet al.(2005). To gain more insight
into this relationship further research needs to be carried out including some international japonica control strains
anal-microsatellite markers with proved diagnose value for dif-ferentiation between the indica andjaponica subspecies
groups (Ni et al., 2002; Coburn et al., 2002; Gao et al.,
2005). We have previously shown that the improved variet-ies in the Cuban rice breeding program, here included in group II, areindicagenotypes (Fuenteset al., 1999, 2004,
2005). Thus, the traditional varieties of this group may also beindicagenotypes, since they are close to the improved
varieties. When an international control forindica
subspe-cies (variety IR36) was included for microsatellite diversity analysis (data not shown) it clustered in group II confirm-ing theindicanature of this genetic group. The traditional
varieties within group III could not be assigned to any spe-cific subspecies groups.
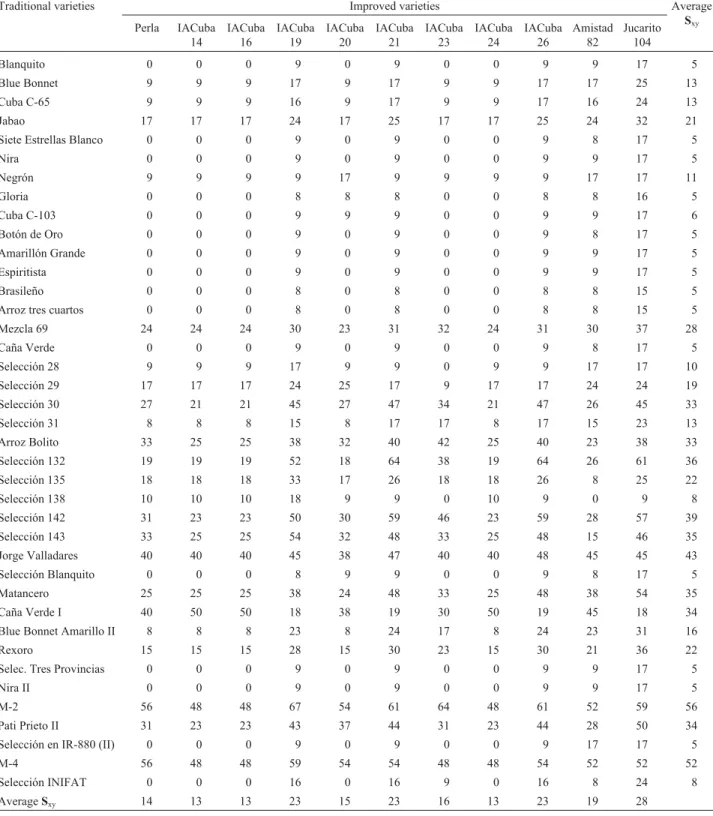
A quantitative estimate of the genetic relationships between the traditional and improved varieties based on the Sxypairwise values was undertaken to assist genetic crosses
using these varieties (Table 4). The most similar varieties shared alleles at all microsatellite loci while the least simi-lar varieties shared alleles at the zero marker loci. Thus, Sxy
values among all traditional/improved varietal pairs were calculated, and subsequently the average values of Sxyfor
each variety were obtained. On average, the 11 improved varieties shared between 13% and 28% of the microsatellite alleles with traditional varieties, while 39 traditional variet-ies shared between 5% and 56%. Out of a total 429 tradi-tional/improved varietal pairs (39 traditional x 11 improved varieties), 95 (22%) shared alleles at the zero microsatellite loci, 228 (53%) shared between 5% and 25% of the total number of microsatellite loci, while 106 (25%) shared more than 25%. No genetic polymorphism could be detected at any microsatellite locus between the varieties IACuba-14, IACuba-16 and IACuba-24 which all trace back to a com-mon parent (CP1-C8), confirming their close pedigree
rela-tionship (Fuenteset al., 2003). A similar result was found
for the IACuba-21 and IACuba-26 varieties, mutant lines derived from Jucarito-104, as well as for the traditional va-rieties Blanquito, Espiritista and Selección Tres Provincias, all of unknown origin.
The average genetic similarity (Sxy) values for each
variety ranged from 11% for Selección 135 to 47% for Jabao and Rexoro, with an overall average Sxyvalue of 34%
(Table 1). When the traditional and improved variety groups were evaluated separately (data not shown) the av-erage Sxyvalues for the traditional group ranged from 10%
for Jorge Valladares to 67% for Blue Bonnet and the overall average Sxyvalue was 40%, while for the improved
variet-ies the Sxyvalues were between 59% for Jucarito-104 and
70% for Perla de Cuba with an overall average value of 65%. This indicated that within-groups varieties were very related genetically.
Discussion
In this paper we present a genetic diversity analysis of traditional and improved Cuban rice varieties based on
microsatellite markers data. The study demonstrated that the variety sample possesses a high level of microsatellite variation (HT= 0.75). This result agrees with previous
stud-ies that showed high microsatellite variation inO. sativa
(Yanget al., 1994; Gaoet al., 2005) and related wild rice
species (Gao 2004, 2005). We used microsatellite se-quences that have previously revealed a high level of poly-morphisms in Latin American rice germplasm (data not shown) and which are mostly located on chromosomes har-boring high level of genetic diversity (Gaoet al., 2005).
Thus, these microsatellite sequences may be useful tools in future genetic studies of rice germplasm.
Based on phenotypic characteristics (data not shown) and information supplied by farmers on the origin of the va-rieties we hypothesize that traditional rice vava-rieties grown by local farmers in Cuba represent alternative genetic pools to those present in the improved varieties. Support is given to this hypothesis by the fact that the mean of the micro-satellite diversity analysis was HTV= 0.72 > HIV= 0.42 (χ2
test, p < 0.05), where 45 microsatellite alleles (68% of the total) were found exclusively in the traditional varieties. The hypothesis was also corroborated by cluster analysis based on genetic relationship estimates (Figure 1). As ex-pected, all the improved varieties grouped in the same genetic group (group II), confirming the close genetic rela-tionship reported for these genotypes in previous studies (Fuenteset al., 1999, 2005). The clustering of some
tradi-tional varieties in group II suggested their close genetic relationship with improved varieties. Considering the col-lection date of these traditional varieties (Table 1) only two, M2 and M4, could be selections from the improved variet-ies surveyed in this work, i.e., Jucarito-104 released for
production in 1981. The remaining traditional varieties in-cluded in Group II (Selección 30, 132, 142 and 143, Arroz Bolito, Matancero, Jorge Valladares and Caña Verde) could be selections from earlier varieties such as IR-880C9, Cica 4 or Naylamp, released by the Cuban breeding pro-gram between 1972 and 1976. These three varieties trace to the same maternal cytoplasm (Cina) of the IACuba-14 and IACuba-16 varieties (Fuenteset al., 2004). The Cica 4
vari-ety is also the grandmother parent of the IACuba-14 varivari-ety (Fuenteset al., 2003). Future studies using a higher number
of microsatellite markers will be necessary to confirm this hypothesis.
A different origin could be expected for traditional varieties from groups I and III. Group I clustered tropical
japonicavarieties such as Rexoro, Blue Bonnet and Nira
(Luet al., 2005), which were introduced into Cuba from the
breed-ing programs applied in Cuba and the US suggests that the US breeding pool contained in group I may serve as reser-voirs of genetic diversity for Cuban varieties. In spite of the attractive traits of the US varieties, only one variety (Cen-tury Patna) has been used as a parent of modern varieties in Cuba (Fuenteset al., 2003).
In this sense, Table 4 provides a guideline for selec-tion of tradiselec-tional/improved parent combinaselec-tions for ge-netic crosses on the basis of their microsatellite diversity. It may be suggested that those varieties sharing alleles at less than 25% of the microsatellite loci are adequate for genetic crosses, assuming 0.25 as the inbred limit value
Table 4- Proportion of shared alleles (Sxy) between traditional and improved varieties pairs expressed in percentage. Average values for each traditional and improved variety is given in the last column and row, respectively.
Traditional varieties Improved varieties Average
Sxy
Perla IACuba
14
IACuba 16
IACuba 19
IACuba 20
IACuba 21
IACuba 23
IACuba 24
IACuba 26
Amistad 82
Jucarito 104
Blanquito 0 0 0 9 0 9 0 0 9 9 17 5
Blue Bonnet 9 9 9 17 9 17 9 9 17 17 25 13
Cuba C-65 9 9 9 16 9 17 9 9 17 16 24 13
Jabao 17 17 17 24 17 25 17 17 25 24 32 21
Siete Estrellas Blanco 0 0 0 9 0 9 0 0 9 8 17 5
Nira 0 0 0 9 0 9 0 0 9 9 17 5
Negrón 9 9 9 9 17 9 9 9 9 17 17 11
Gloria 0 0 0 8 8 8 0 0 8 8 16 5
Cuba C-103 0 0 0 9 9 9 0 0 9 9 17 6
Botón de Oro 0 0 0 9 0 9 0 0 9 8 17 5
Amarillón Grande 0 0 0 9 0 9 0 0 9 9 17 5
Espiritista 0 0 0 9 0 9 0 0 9 9 17 5
Brasileño 0 0 0 8 0 8 0 0 8 8 15 5
Arroz tres cuartos 0 0 0 8 0 8 0 0 8 8 15 5
Mezcla 69 24 24 24 30 23 31 32 24 31 30 37 28
Caña Verde 0 0 0 9 0 9 0 0 9 8 17 5
Selección 28 9 9 9 17 9 9 0 9 9 17 17 10
Selección 29 17 17 17 24 25 17 9 17 17 24 24 19
Selección 30 27 21 21 45 27 47 34 21 47 26 45 33
Selección 31 8 8 8 15 8 17 17 8 17 15 23 13
Arroz Bolito 33 25 25 38 32 40 42 25 40 23 38 33
Selección 132 19 19 19 52 18 64 38 19 64 26 61 36
Selección 135 18 18 18 33 17 26 18 18 26 8 25 22
Selección 138 10 10 10 18 9 9 0 10 9 0 9 8
Selección 142 31 23 23 50 30 59 46 23 59 28 57 39
Selección 143 33 25 25 54 32 48 33 25 48 15 46 35
Jorge Valladares 40 40 40 45 38 47 40 40 48 45 45 43
Selección Blanquito 0 0 0 8 9 9 0 0 9 8 17 5
Matancero 25 25 25 38 24 48 33 25 48 38 54 35
Caña Verde I 40 50 50 18 38 19 30 50 19 45 18 34
Blue Bonnet Amarillo II 8 8 8 23 8 24 17 8 24 23 31 16
Rexoro 15 15 15 28 15 30 23 15 30 21 36 22
Selec. Tres Provincias 0 0 0 9 0 9 0 0 9 9 17 5
Nira II 0 0 0 9 0 9 0 0 9 9 17 5
M-2 56 48 48 67 54 61 64 48 61 52 59 56
Pati Prieto II 31 23 23 43 37 44 31 23 44 28 50 34
Selección en IR-880 (II) 0 0 0 9 0 9 0 0 9 17 17 5
M-4 56 48 48 59 54 54 48 48 54 52 52 52
Selección INIFAT 0 0 0 16 0 16 9 0 16 8 24 8
(Kempthorne, 1969) and that the proportion of micro-satellite bands (Sxy) refers to bands identical by descent and
not by state (Lynch, 1988). Thus, nearly 75% of the tradi-tional varieties could be crossed with almost any improved variety. However, the amplification of the genetic diversity of improved varieties is not an aim of a breeding program, but a consequence of the adequate use of parent genotypes selected for different aims such as introducing resistance genes in varieties, increasing the yield and quality of the crop, etc. For this reason, the information contained in Ta-ble 4 should be used to complement other breeding criteria and agronomic traits such as grain quality, local adaptabil-ity and diseases resistance, all of which are currently being evaluated in these varieties.
In summary, the microsatellite diversity analysis sug-gests two different origins for the traditional Cuban rice va-rieties studied, with most of the vava-rieties originating from US introductions while a relatively smaller number being derived from commercial varieties improved in Cuba. Fur-ther more, compared to the improved varieties clustered in group II, the traditional varieties clustering in groups I and III were genetically more diverse and represent alternative genetic pools for improving Cuban rice varieties. This study demonstrates the usefulness of microsatellite markers for recommending parent genotypes for genetic crosses in rice.
Acknowledgments
The authors wish to thank Dr. Fernando Correa-Vic-toria and Dr. Cesar Martínez (Rice Program, CIAT, Colom-bia) for their kind assistance during this research. We also appreciate the fruitful discussions with Dr. Daniel G. De-bouck from the CIAT Genetic Resources Unit. This work was supported by the CIAT Agrobiodiversity and Biotech-nology unit and the International Atomic Energy Agency (IAEA), Manpower fellowship C6/CUB/99034P.
References
Chen X, Temnykh N, Xu Y, Cho YG and McCouch SR (1997) Development of a microsatellite framework map providing genome-wide coverage in rice (Oryza sativaL.) Theor Appl Genet 95:553-557.
Cho YG, Blair MW, Panaud O and McCouch SR (1996) Cloning and mapping of variety-specific rice genomic DNA se-quences: Amplified length polymorphisms (AFLP) from sil-ver-stained polyacrylamide gels. Genome 39:373-378. Coburn JR, Temnykh SV, Paul EM and McCouch SR (2002)
De-sign and application of microsatellite marker panels for semiautomated genotyping of rice (Oryza sativaL.). Crop Sci 42:2092-2099.
Cuevas-Pérez FE, Guimaraes LE, Berrio I and González DI (1992) Genetic base of the irrigated rice in Latin America and the Caribbean. Crop Sci 32:1054-1059.
Dellaporta SL, Wood J and Hicks JB (1983) A plant DNA mini-preparation: Version II. Plant Mol Biol Rep 1:19-21.
Fuentes JL, Escobar F, Álvarez A, Gallego G, Duque MC, Ferrer M, Deus JE and Tohme J (1999) Analysis of genetic diver-sity in Cuban rice varieties using AFLP, RAPD and isozyme markers. Euphytica 109:107-115.
Fuentes JL, Ramírez IM, Arteche J, Deus JE, Suárez E, Alonso R, Puldón V, Gómez PJ and Cornide MT (2003) Genetic base of Cuban Rice varieties released between 1972 and 1993. Cultivos Tropicales 24:55-61.
Fuentes JL, Arteche J, Suárez E, Gómez PJ, Borges E and Cordine MT (2004) Genetic base and commercial utilization of rice varieties in Cuba. J Genet Breed 58:329-338.
Fuentes JL, Cornide MT, Álvarez A, Borges E and Suárez E (2005) Genetic diversity analysis of rice varieties (Oryza sativaL.) based on morphological, pedigree and DNA poly-morphisms data. Plant Genet Res 3:353-359.
Gao LZ (2004) Population structure and conservation genetics of wild riceOryza rufipogon(Poaceae): A region-wide per-spective from microsatellite variation. Mol Ecol 13:1009-1024.
Gao LZ (2005) Microsatellite diversity and population genetic structure of an endangered wild rice, Oryza officinalis (Poaceae) from China. Mol Ecol 14:4287-4297.
Gao LZ, Zhang CH, Chang LP, Jia JZ, Qiu ZE and Dong YS (2005) Microsatellite diversity ofOryza sativawith empha-sis onindica-japonicadivergence. Genet Res 85:1-14. Garris AJ, Tai TH, Coburn J, Kresovich S and McCouch S (2005)
Genetic structure and diversity inOryza sativaL. Genetics 169:1631-1638
Kempthorne O (1969) An Introduction to Genetics Statistics. Iowa State University Press, Ames, 228 pp.
Lu H, Redus MA, Coburn JR, Rutger JN, McCouch SR and Tai TH (2005) Population structure and breeding patters of 145 U.S. rice cultivars based on SSR marker analysis. Crop Sci 45:66-76.
Lynch M (1988) Estimation of relatedness by DNA fingerprint-ing. Mol Biol Evol 5:584-599.
Lynch M (1990) The similarity index and DNA fingerprinting. Mol Biol Evol 7:478-484.
McCouch SR, Teytelman L, Xu Y, Lobos KB, Clare K, Walton M, Fu B, Maghirang R, Li Z, Xing Y,et al.(2002) Develop-ment and mapping of 2240 new SSR markers for rice (Oryza sativaL.). DNA Res 9:199-207.
Nei M (1973) Analysis of gene diversity in subdivided popula-tions. Proc Natl Acad Sci USA 70:3321-3323.
Nei M and Li WH (1979) Mathematical model for studying ge-netic variation in terms of restriction endonucleases. Proc Natl Acad Sci USA 76:5269-5273.
Ni J, Colowit PM and Mackill D (2002) Evaluation of genetic di-versity in rice subspecies using microsatellite markers. Crop Sci 42:601-607.
Olufowote JO, Xu Y, Chen X, Park WD, Beachel HM, Dilday RH, Goto M and McCouch SR (1997) Comparative evalua-tion of within-cultivar variaevalua-tion of rice (Oryza sativa L.) us-ing microsatellite and RFLP markers. Genome 40:370-378. Panaud O, Shen X and McCouch SR (1996) Development of microsatellite markers and characterization of single se-quence length polymorphism (SSLP) in riceOryza sativaL. Mol Gen Genet 252:597-607.
Temnykh S, DeClerck G, Lukashova A, Lipovich L, Cartinhour S and McCouch SR (2001) Computational and experimental analysis of microsatellites in rice (Oryza sativaL.): Fre-quency, length variation, transposons associations and ge-netic marker potential. Genome Res 11:1441-1452.
Vaughan LK, Ottis BV, Prazak-Havey AM, Sneller C, Chandler JM and Park WD (2001) Is all red rice found in commercial rice reallyOryza sativa? Weed Sci 49:468-476.
Wu XS and Tanksley SD (1993) Abundance, polymorphism and genetic mapping of microsatellites in rice. Mol Gen Genet 241:225-235.
Xiao J, Li J, Yuan L, McCouch SR and Tanksley SD (1996a) Ge-netic diversity and its relationship to hybrid performance and heterosis in rice as revealed by PCR-based markers. Theor Appl Genet 92:637-643.
Xiao J, Grandillo SN, McCouch SR, Tanksley SD and Yuan L (1996b) Genes from wild rice improve rice yield. Nature 384:223-224.
Xu Y, Beachell H and McCouch SR (2004) A marker-based ap-proach to broadening the genetic base of rice in the USA. Crop Sci 44:1947-1959.
Yang GP, Saghai Maroof MA, Xu CG, Zhang Q and Biyashev RM (1994) Comparative analysis of microsatellite DNA polymorphism in landraces and cultivars of rice. Mol Genet Genomics 245:187-194.
Zou JH, Pan XB, Chen ZX, Xu JY, Lu JF, Zhai WX and Zhu LH (2000) Mapping quantitative trait loci controlling sheath blight resistance into rice cultivars (Oryza sativaL.). Theor Appl Genet 101:569-573.