Rev Bras
Cineantropom
Hum
DOI: http://dx.doi.org/10.5007/1980-0037.2017v19n4p469
original article
Exposure to simultaneous sedentary behavior
domains and sociodemographic factors
associated in public servants
Exposição a simultâneos domínios do comportamento
sedentário e fatores sociodemográicos associados em
servidores públicos
Fernanda Cerveira Fronza1
Juliane Berria2
Giseli Minatto3
Edio Luiz Petroski2
Abstract - Exposure to sedentary behavior may contribute to health problems. his study aimed to estimate the prevalence of exposure to simultaneous sedentary behavior domains and verify associated sociodemographic characteristics among technical and administrative servers of a Brazilian university. his is a cross-sectional epidemiological study carried out with 623 technical and administrative servers. Sedentary behavior was identiied through a questionnaire in the following domains: commuting (active / passive), sitting time at work, daily time spent watching television and computer use (≥3 hours / day). Sociodemographic variables were age, sex and educational level. he prevalence of servers that had one, two, three and four simultaneous sedentary behavior was 28.4%, 43.2%, 22.5% and 4.3%, respectively. Women were more likely to have three sedentary behavior simultaneously (OR = 1.61, CI 95% = 1.02, 2.56). Servers with 9-11 years of schooling were less exposed to two (OR = 0.27, CI 95% = 0.17, 0.44), three (OR = 0.39, CI 95% = 0.23, 0.66) and four (OR = 0.22, CI 95% = 0.07; 0.69) sedentary behavior simultaneously and those over 12 years of schooling were less likely of having two (OR = 0.22, CI 95% = 0.10; 0.49) and three (OR = 0.15, CI 95% = 0.05, 0.46) sedentary behavior simultaneously. More than half of servers have two sedentary behavior during the week. Having sedentary behavior in more than one domain simultaneously was associated with sex and educational level.
Key words: Age groups; Educational status; Occupational health; Sedentary lifestyle.
Resumo - A exposição a comportamentos sedentários podem contribuir para diversos agravos a saúde. Este estudo teve como objetivo estimar a prevalência de exposição a simultâneos domínios do comportamento sedentário e veriicar que características sociodemográicas estão associadas, em servidores técnico-administrativos de uma universidade federal brasileira. Trata-se de um estudo epidemiológico transversal realizado com 623 servidores técnico-administrativos. O comportamento sedentário foi identiicado por meio de questionário nos domínios: deslocamento (ativo/passivo), tempo sentado no trabalho, tempo de assistir televisão e utilização o computador por dia (≥ três horas/dia). As variáveis sociodemográicas investigadas foram: idade, sexo e esco-laridade. A prevalência de servidores que apresentaram um, dois, três e quatro comportamentos sedentários simultaneamente foi de 28,4%, 43,2%, 22,5% e 4,3%, respectivamente. As mulheres apresentaram maior chance de ter três comportamentos sedentários simultaneamente (RC: 1,61; IC95%: 1,02; 2,56). Os servidores com 9 a 11 anos de escolaridade estiveram menos expostos a dois (RC: 0,27; IC95%: 0,17; 0,44), três (RC: 0,39; IC95%: 0,23; 0,66) e quatro (RC: 0,22; IC95%: 0,07; 0,69) comportamentos sedentários simultaneamente e aqueles com 12 anos ou mais de escolaridade tiveram menor chance de ter dois (RC: 0,22; IC95%: 0,10; 0,49) e três (RC: 0,15; IC95%: 0,05; 0,46) comportamentos sedentários. Mais da metade dos servidores apresentaram comportamentos sedentários em dois domínios, durante a semana. O comportamento
1 State University of Santa Catarina. Faculty of Education. Florianópolis, SC. Brazil.
2 Federal University of Santa Catarina. Sports Center. Research Center of Kineanthropometry and Human Performance. Florianópolis, SC. Brazil.
3 Educational Faculty of Dois Vizinho. Teaching Union of the Southwest of Paraná. Dois Vizinhos, PR. Brazil
INTRODUCTION
Lifestyle, especially in developed countries, is often associated with sed-entary behavior1, deined as any wakeful behavior characterized by energy expenditure equal to or less than 1.5 metabolic equivalents (METs), whether sitting, reclining or lying down. In addition, it is considered with respect to the time spent in this behavior (example: minutes, hours) and in the diferent contexts (displacement, school, work) in which this behavior can occur2-3
Estimates reveal that individuals can spend 50-60% of their daily time in low-energy expenditure activities. he justiication for these values is that the opportunities for the sedentary behavior repetition are numerous: watching TV, using the computer, sitting in the car, among others1. Re-searchers point out that this trend spread throughout the world is explained by changes in transport systems, modes of industrial production, innova-tions in national communicainnova-tions in workplaces and labor technologies and other aspects of the built environment of cities, leading people to apply less and less energy to perform everyday tasks4.
Sedentary behavior has caused various health hazards and the time spent in this type of behavior seems to be a global tendency 5-8. Studies have indicated that for every two daily hours of television watching, the chance of having some cardiovascular disease increases by 15%. Similar exposure is also observed for other comorbidities, in which the adoption of sedentary behaviors in much of the time increases by 112% the risk of developing diabetes or 72% the chance of having metabolic syndrome1.
In this context, in addition to well-known health-related aspects, soci-odemographic characteristics could also could be important determinants in the sedentary behavior9. In Australia, adults with paid work spend most of their time sitting and working with computer and driving compared to those who do not have paid work10. In the Portuguese population, the time spent in sedentary activities decreases as the educational level decreases1. In Brazil, a research developed in the southern region illustrates that man, younger adults with higher educational level and high socioeconomic status spend more time on sedentary behaviors11. In university labor context, a research conducted in a Brazilian university has shown that technical and administrative servers were more physically active in occupational activities and mobility when compared to teachers 12.
METHODOLOGICAL PROCEDURES
his is an epidemiological cross-sectional study conducted in 2012 in Flo-rianópolis, SC, Brazil. he present paper was developed using data from the “Lifestyle, physical activity, body image perception and health risk factors of technical and administrative servers at the Federal University of Santa Catarina” research. Further details about the study are in previous publication13.
he target population of this study was composed of technical and administrative servers of both sexes working at UFSC, totaling 3,008 people (171 auxiliary-level, 1,823 intermediate-level and 999 higher-level servers), according to data from the Pro-Rectory of Human and Social Development, in 2012.
he sample size calculation was based on the unknown prevalence for the outcome equal to 50%, with sampling error of 3.5 percentage points and 95% conidence level, resulting in a sample size of 621 individuals. About 20% was added for possible losses and refusals, totaling a sample of 746 servers.
he sample selection was performed using the proportional method to ensure that auxiliary-level, intermediate-level and higher-level servers were selected. hus, 43 auxiliary-level, 456 intermediate-level and 250 higher-level servers were randomly and systematically selected. Sample re-placement was scheduled for servers who were removed, absent, assigned to other institutions, dismissed, resigned, retired and also those who could not be reached for lack of information about current workplace. In this sense, any individual who has been selected and was in one of these situations was replaced by another participant, which resulted in 54 replacements. All technical and administrative servers working at UFSC of both sexes were deined as eligible.
Sedentary behavior was investigated from issues related to the time that servers remain seated, considering leisure, labor and commuting domains. he questions used included commuting to work (walking, bicycle, motor-cycle / bus or car), time watching television (TV) (hours / day during the week14, computer usage time during the week (hours / day, excluding at work) and sitting time at work (hours / day). he classiication of sedentary behavior commuting to work was grouped into active (walking or cycling) or little active (car, motorcycle or bus). For TV time, computer time and sitting time at work, cutof of three hours per day or more was considered sedentary behavior.
educa-tion, complete higher education. Data were categorized into: ≤ 8 years (in-complete or (in-complete basic education); 9-11 years (in(in-complete or (in-complete high-school) and ≥ 12 years (incomplete or complete higher education).
In the descriptive analysis, absolute (n) and relative frequency values (%) were calculated. he proportion of servers who presented sedentary be-havior (outcome) in relation to the total number of servers investigated was reported as prevalence, although the outcomes of interest are not diseases.
he associations of sedentary behavior domains with sociodemographic variables were tested using the chi-square test and binary logistic regres-sion. To determine the prevalence of exposure to simultaneous sedentary behaviors, the “simultaneity” variable was created based on the sum of exposure to sedentary behaviors, being categorized into: up to one, two, three and four sedentary behaviors. Six other variables related to possible combinations with two sedentary behaviors were also created: “Commuting (little active) + TV time / day”; “ Commuting (little active) + Computer time / day”; “ Commuting (little active) + Sitting time “; “ TV time / day + Computer time / day”; “ TV time / day + Sitting time”; “Computer time / day + Sitting time”.
For the regression analyses of combinations, six binary logistic regres-sions were performed, estimating the odds ratio and respective conidence intervals (CI 95%), testing associations of combinations of behaviors with sociodemographic variables. he reference category adopted for the com-binations was presenting up to one of two behaviors. In the analysis of the “simultaneity” variable, multinomial regression was performed, also estimating the odds ratios and CI 95%, with reference category presenting “up to one sedentary behavior”. For all analyses, 5% signiicance level was adopted. Data were analyzed using the Statistical Package for the Social Sciences software (SPSS) version 15.0 for Windows.
he study was approved by the Ethics Committee of Research with Human Beings of the Federal University of Santa Catarina (UFSC), protocol No. 27939/13. Participants informed the consent to participate in the study by signing of the informed consent form.
RESULTS
he study included 623 technical and administrative servers of UFSC (83.5% of the estimated sample). During the data collection period, 16 servers did not participate in the survey for being on vacation, 16 for medical leave and 11 could not be contacted due to the lack of information on their workplace, and so 43 losses were obtained. In addition to these, 83 servers refused to participate. Losses and refusals did not difer between sex (male = 18.2%, female = 15.4%, p = 0.321) and occupational level (auxiliary level = 11.1%, intermediate level = 17.5%, and higher level = 16.9%; p = 0.551).
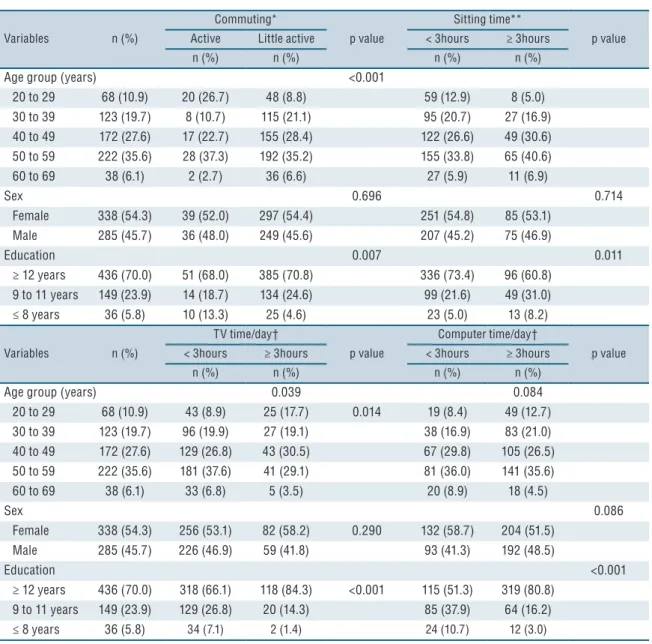
identi-ied in the age group 50-59 years and with schooling higher than 12 years. Watching television for three hours or more is a frequent behavior in the age group 40-49 years and among those who have more than 12 years of schooling, and computer use for three hours or more was prevalent among servers with more than 12 years of schooling (Table 1).
Servers in the age group 20-29 years were less likely to have little active commuting to work compared to servers aged 60-69 years. hose with 12 years of schooling or more were less likely to have little active commuting to work, using computer and remaining seated at work for three hours or more compared to those with eight years of schooling or less. Servers with 9-11 years of schooling were also less likely to show excessive computer
Table 1. Sample distribution in relation to sociodemographic characteristics, according to sedentary behavior domains in technical and
administrative servers. Florianópolis, SC, Brazil, in 2012.
Variables n (%)
Commuting*
p value
Sitting time**
p value Active Little active < 3hours ≥ 3hours
n (%) n (%) n (%) n (%)
Age group (years) <0.001
20 to 29 68 (10.9) 20 (26.7) 48 (8.8) 59 (12.9) 8 (5.0) 30 to 39 123 (19.7) 8 (10.7) 115 (21.1) 95 (20.7) 27 (16.9) 40 to 49 172 (27.6) 17 (22.7) 155 (28.4) 122 (26.6) 49 (30.6) 50 to 59 222 (35.6) 28 (37.3) 192 (35.2) 155 (33.8) 65 (40.6)
60 to 69 38 (6.1) 2 (2.7) 36 (6.6) 27 (5.9) 11 (6.9)
Sex 0.696 0.714
Female 338 (54.3) 39 (52.0) 297 (54.4) 251 (54.8) 85 (53.1) Male 285 (45.7) 36 (48.0) 249 (45.6) 207 (45.2) 75 (46.9)
Education 0.007 0.011
≥ 12 years 436 (70.0) 51 (68.0) 385 (70.8) 336 (73.4) 96 (60.8) 9 to 11 years 149 (23.9) 14 (18.7) 134 (24.6) 99 (21.6) 49 (31.0)
≤ 8 years 36 (5.8) 10 (13.3) 25 (4.6) 23 (5.0) 13 (8.2)
Variables n (%)
TV time/day†
p value
Computer time/day†
p value < 3hours ≥ 3hours < 3hours ≥ 3hours
n (%) n (%) n (%) n (%)
Age group (years) 0.039 0.084
20 to 29 68 (10.9) 43 (8.9) 25 (17.7) 0.014 19 (8.4) 49 (12.7) 30 to 39 123 (19.7) 96 (19.9) 27 (19.1) 38 (16.9) 83 (21.0) 40 to 49 172 (27.6) 129 (26.8) 43 (30.5) 67 (29.8) 105 (26.5) 50 to 59 222 (35.6) 181 (37.6) 41 (29.1) 81 (36.0) 141 (35.6)
60 to 69 38 (6.1) 33 (6.8) 5 (3.5) 20 (8.9) 18 (4.5)
Sex 0.086
Female 338 (54.3) 256 (53.1) 82 (58.2) 0.290 132 (58.7) 204 (51.5) Male 285 (45.7) 226 (46.9) 59 (41.8) 93 (41.3) 192 (48.5)
Education <0.001
≥ 12 years 436 (70.0) 318 (66.1) 118 (84.3) <0.001 115 (51.3) 319 (80.8) 9 to 11 years 149 (23.9) 129 (26.8) 20 (14.3) 85 (37.9) 64 (16.2)
≤ 8 years 36 (5.8) 34 (7.1) 2 (1.4) 24 (10.7) 12 (3.0)
time and sitting time at work, but were more likely to watch television for three hours or more compared to those with eight years of schooling or less. Age was also associated with excessive TV time, computer use and sitting time at work for three hours or more in the crude analysis; however, in the adjusted analysis, this association was not veriied (Table 2).
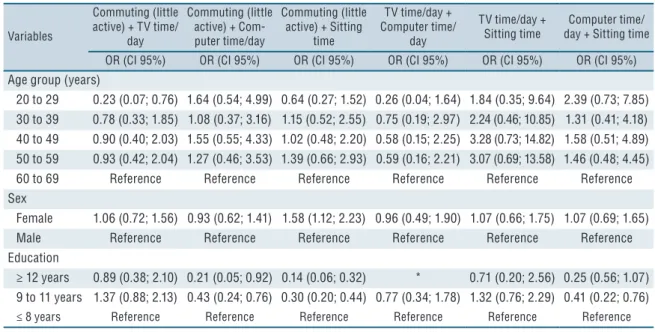
When the association of combination of sedentary behaviors with soci-odemographic variables was analyzed, it was found that servers aged 20-29 years are less likely to have little active commuting to work and television time of three hours or more, compared to servers in the age group 60-69 years. Women were more likely to have little active commuting to work and sitting time at work for three hours or more simultaneously, as compared to men. Servers with 12 years of schooling or more and from nine to 11 years of schooling are less likely to have the following simultaneous sedentary behaviors: little active commuting and using the computer for three hours or more; little active commuting and sitting time at work for three hours or more and using the computer and sitting time at work for three hours or more (9-11 years) compared to servers with eight years of schooling or less (Table 3).
Table 2. Crude and adjusted prevalence ratio (PR) between sedentary behavior domains and
sociodemographic characteristics of technical and administrative servers. Florianópolis, SC, Brazil, in 2012.
Variables
Commuting * (little active)
TV time/day** (≥ 3 hours)
Crude Adjusted Crude Adjusted
OR (CI 95%) OR (CI 95%) OR (CI 95%) OR (CI 95%)
Age group (years)
20 to 29 0.13 (0.03; 0.61) 0.08 (0.02; 0.40) 0.33 (0.12; 0.92) 0.40 (0.14; 1.14) 30 to 39 0.80 (0.16; 3.93) 0.49 (0.09; 2.59) 0.70 (0.31; 1.59) 0.82 (0.35; 1.93) 40 to 49 0.51 (0.11; 2.29) 0.33 (0.07; 1.59) 0.99 (0.45; 2.14) 1.02 (0.46; 2.26) 50 to 59 0.38 (0.09; 1.67) 0.29 (0.06; 1.31) 1.03 (0.48; 2.20) 1.04 (0.48; 2.25)
60 to 69 Reference Reference Reference Reference
Sex
Female 0.91 (0.56; 1.47) 0.97 (0.58; 1.63) 1.07 (0.75; 1.54) 0.97 (0.67; 1.41)
Male Reference Reference Reference Reference
Education
≥ 12 years 0.33 (0.15; 0.73) 0.24 (0.10; 0.57) 1.98 (0.97; 4.05) 1.69 (0.80; 3.60) 9 to 11 years 1.27 (0.68; 2.36) 1.06 (0.55; 2.06) 1.73 (1.15; 2.61) 1.53 (1.00; 2.34)
≤ 8 years Reference Reference Reference Reference
Variables
Computer time/day†
(≥ 3 hours)
Setting time†
(≥ 3 hours)
Crude Adjusted Crude Adjusted
OR (CI 95%) OR (CI 95%) OR (CI 95%) OR (CI 95%)
Age group (years)
20 to 29 3.84 (1.33; 11.10) 2.65 (0.90; 7.88) 2.87 (1.25; 6.56) 1.80 (0.74; 4.41) 30 to 39 1.86 (0.61; 5.22) 1.32 (0.46; 3.80) 2.43 (1.15; 5.11) 1.63 (0.72; 3.67) 40 to 49 2.20 (0.81; 5.99) 1.82 (0.65; 5.06) 1.74 (0.86; 3.53) 1.52 (0.70; 3.28) 50 to 59 1.50 (0.55; 4.06) 1.43 (0.52; 3.96) 1.93(0.97; 3.87) 2.11(0.99; 4.50)
60 to 69 Reference Reference Reference Reference
Sex
Female 0.82 (0.56; 1.19) 0.93 (0.63; 1.38) 1.34 (0.96; 1.86) 1.67 (1.16; 2.40)
Male Reference Reference Reference Reference
Education
≥ 12 years 0.16 (0.04; 0.67) 0.19 (0.04; 0.82) 0.18 (0.09; 0.37) 0.15 (0.07; 0.32) 9 to 11 years 0.42 (0.25; 0.70) 0.44 (0.26; 0.76) 0.27 (0.18; 0.40) 0.25 (0.16; 0.38)
≤ 8 years Reference Reference Reference Reference
* To work; ** At work; † TV and computer usage time per day during the week, without considering use of computer at work; Chi-square test. Values in bold: significant difference.
Table 3. Adjusted odds ratio (OR) and confidence intervals among combinations of sedentary behavior domains and sociodemographic
characteristics in technical and administrative servers. Florianópolis, SC, Brazil, in 2012.
Variables
Commuting (little active) + TV time/
day
Commuting (little active) + Com-puter time/day
Commuting (little active) + Sitting
time
TV time/day + Computer time/
day
TV time/day + Sitting time
Computer time/ day + Sitting time
OR (CI 95%) OR (CI 95%) OR (CI 95%) OR (CI 95%) OR (CI 95%) OR (CI 95%) Age group (years)
20 to 29 0.23 (0.07; 0.76) 1.64 (0.54; 4.99) 0.64 (0.27; 1.52) 0.26 (0.04; 1.64) 1.84 (0.35; 9.64) 2.39 (0.73; 7.85) 30 to 39 0.78 (0.33; 1.85) 1.08 (0.37; 3.16) 1.15 (0.52; 2.55) 0.75 (0.19; 2.97) 2.24 (0.46; 10.85) 1.31 (0.41; 4.18) 40 to 49 0.90 (0.40; 2.03) 1.55 (0.55; 4.33) 1.02 (0.48; 2.20) 0.58 (0.15; 2.25) 3.28 (0.73; 14.82) 1.58 (0.51; 4.89) 50 to 59 0.93 (0.42; 2.04) 1.27 (0.46; 3.53) 1.39 (0.66; 2.93) 0.59 (0.16; 2.21) 3.07 (0.69; 13.58) 1.46 (0.48; 4.45) 60 to 69 Reference Reference Reference Reference Reference Reference Sex
Female 1.06 (0.72; 1.56) 0.93 (0.62; 1.41) 1.58 (1.12; 2.23) 0.96 (0.49; 1.90) 1.07 (0.66; 1.75) 1.07 (0.69; 1.65) Male Reference Reference Reference Reference Reference Reference Education
≥ 12 years 0.89 (0.38; 2.10) 0.21 (0.05; 0.92) 0.14 (0.06; 0.32) * 0.71 (0.20; 2.56) 0.25 (0.56; 1.07) 9 to 11 years 1.37 (0.88; 2.13) 0.43 (0.24; 0.76) 0.30 (0.20; 0.44) 0.77 (0.34; 1.78) 1.32 (0.76; 2.29) 0.41 (0.22; 0.76) ≤ 8 years Reference Reference Reference Reference Reference Reference
CI: confidence interval. * Impossible to estimate OR and CI 95% for having few individuals in the reference category; Values in bold: significant difference.
Figure 1. Exposure to simultaneous sedentary behaviors, in technical-administrative servers.
Florianopolis, SC, Brazil, 2012.
DISCUSSION
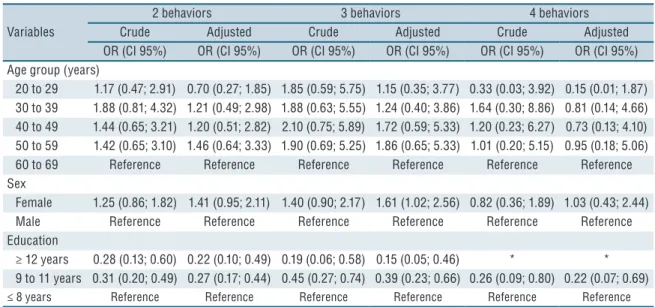
he main results of this study show that about 70% of servers have two or more sedentary behaviors simultaneously. Female servers were more exposed to three sedentary behaviors simultaneously. In addition, servers with nine or more years of schooling were less likely of having two and three sedentary behaviors at the same time. In addition, servers with nine to 11 years of schooling were also less exposed to four sedentary behaviors simultaneously.
he proportions of servers exposed to two or more sedentary behaviors varied from 67.7% for men to 72.7% for women. If we consider only two of the domains that were investigated with respect to the time in sedentary behavior (e.g., sitting time at work and time watching television) and the cutof used to classify sedentary behavior (≥3 hours), much of the sample investigated remains for at least six hours in sedentary behavior per day. Matthews15 mapped the sedentary behaviors of Americans and found that participants spent 54.9% of their time or 7.7 hours / day in sedentary behaviors. he proportion of Brazilian adults who watched TV for three or more hours per day was 28.9%16. In addition, in the city of Pelotas (RS), a study found that, on average, adults reported spending 5.8 hours per day in the sitting position. he adoption of combined sedentary behaviors can be potentially harmful to the general population. In workers, it can lead to conditions for labor disabilities and leaves, impacting costs for companies.
he chance of having little active commuting isolated and the combi-nation of this behavior with TV time / day greater than or equal to three hours was lower among younger servers. Inverse association was observed in the city of Pelotas, whose sedentary commuting time was longer in young adults11. In another study17, with Brazilian adults, using active commuting
Table 4. Crude and adjusted odds ratio (OR) among sedentary behavior domains and sociodemographic characteristics in technical
and administrative servers. Florianópolis, SC, Brazil, in 2012.
Variables
2 behaviors 3 behaviors 4 behaviors
Crude Adjusted Crude Adjusted Crude Adjusted
OR (CI 95%) OR (CI 95%) OR (CI 95%) OR (CI 95%) OR (CI 95%) OR (CI 95%) Age group (years)
20 to 29 1.17 (0.47; 2.91) 0.70 (0.27; 1.85) 1.85 (0.59; 5.75) 1.15 (0.35; 3.77) 0.33 (0.03; 3.92) 0.15 (0.01; 1.87) 30 to 39 1.88 (0.81; 4.32) 1.21 (0.49; 2.98) 1.88 (0.63; 5.55) 1.24 (0.40; 3.86) 1.64 (0.30; 8.86) 0.81 (0.14; 4.66) 40 to 49 1.44 (0.65; 3.21) 1.20 (0.51; 2.82) 2.10 (0.75; 5.89) 1.72 (0.59; 5.33) 1.20 (0.23; 6.27) 0.73 (0.13; 4.10) 50 to 59 1.42 (0.65; 3.10) 1.46 (0.64; 3.33) 1.90 (0.69; 5.25) 1.86 (0.65; 5.33) 1.01 (0.20; 5.15) 0.95 (0.18; 5.06) 60 to 69 Reference Reference Reference Reference Reference Reference Sex
Female 1.25 (0.86; 1.82) 1.41 (0.95; 2.11) 1.40 (0.90; 2.17) 1.61 (1.02; 2.56) 0.82 (0.36; 1.89) 1.03 (0.43; 2.44) Male Reference Reference Reference Reference Reference Reference Education
≥ 12 years 0.28 (0.13; 0.60) 0.22 (0.10; 0.49) 0.19 (0.06; 0.58) 0.15 (0.05; 0.46) * * 9 to 11 years 0.31 (0.20; 0.49) 0.27 (0.17; 0.44) 0.45 (0.27; 0.74) 0.39 (0.23; 0.66) 0.26 (0.09; 0.80) 0.22 (0.07; 0.69) ≤ 8 years Reference Reference Reference Reference Reference Reference
such as walking and cycling was associated with low socioeconomic status. he explanation for these indings may relate to the moment of hiring serv-ers, in which younger individuals have less time for income accumulation and may have better physical conditions to move more actively to their work.
Women are more exposed to sitting time at work, to the combination of this domain with little active commuting and three sedentary behaviors simultaneously, regardless of domain. In an American survey in which sed-entary behavior was directly measured, women were also more sedsed-entary than men in diferent contexts of daily life before the age of 30, but this pattern was reversed after the age of 60 due to retirement and comorbidities associated with aging15. In contrast, in a city in southern Brazil, when only the ield of commuting, Mielke et al11 found that men commuted less actively to work.
Sedentary behavior at work is possibly related to the demands of jobs occupied by these women (e.g. administrative functions), and this is often something that cannot be changed. However, the reduction of total sed-entary time and small changes in work routine such as discontinuation of sedentary behavior (e.g pauses for short stretches) can provide health beneits for workers18, 19. According to an experimental research conducted by Alkhajah et al.20, the introduction of a sitting / standing workstation can substantially reduce the sitting time of oice workers both in the workplace and throughout the week.
In the simultaneity analysis, servers with higher education were less exposed to sedentary behavior regardless of domain. In combinations, associations occurred for little active commuting with computer time and sitting time and combination of computer time and sitting time. Alone, all domains were associated, indicating lower exposure of servers with higher schooling for little active commuting, computer time and sitting time and higher TV time for servers with intermediate schooling.
he associations of diferent domains of sedentary behavior with schooling were also investigated in other studies and the results diverge from the present investigation. In Australian adults, high socioeconomic status (included educational level) was associated with greater total sitting time and computer time10. In Portugal, the higher the educational level of adult, the longer the time spent in sedentary activities. Among Brazilians, those with higher schooling and income were more likely to being exposed to separate or simultaneous sedentary behaviors 22. In another national study conducted in capitals of the northeastern region of Brazil with more than 140 thousand adults over 18 years of age, there was a trend of reduction in active displacement among adults with low and medium schooling23. his indicates that the associated factors, as well as the direction and strength of association, may depend on the behavior investigated. 24 In addition, the diferent instruments used to investigate sedentary behavior have limited the comparison and understanding of studies7.
he main limitation of the study is the impossibility of estimating the total sitting time due to the instrument used. Among strengths of the study, we highlight that the analysis of the simultaneity allowed exploring the sedentary behavior patterns presented by servers, contributing to the discussions about the behavior patterns presented by adults in relation to sociodemographic characteristics. In addition, the representative charac-teristic of the sample allows the extrapolation of results observed for the entire population of servers of Higher Education Institutions.
In practical terms, these results are useful for developing and implement-ing strategies for promotimplement-ing the health of servers. hey also enable workimplement-ing together with the diferent health centers of the university in order to intervene mainly in groups most at risk to sedentary behavior in the various domains.
CONCLUSION
Sedentary behavior was present in approximately all servers. Higher schooling was associated to all domains alone and also the least chance of presenting two or more behaviors simultaneously. he association with sex and age varied according to the domain of the sedentary behavior analyzed.
REFERENCES
1. Sardinha LB, Magalhães J. Comportamento Sedentário – Epidemiologia e Rel-evância. Rev Factores Risco 2012(27):54-64.
2. Sedentary Behaviour Research Network. Standardized use of the terms “sedentary” and “sedentary behaviours”. Appl Physiol Nutr Metab 2012;37(3):540-542.
3. Tremblay MS, Aubert S, Barnes JD, Saunders TJ, Carson V, Latimer-Cheung AE, et al. Sedentary Behavior Research Network (SBRN) – Terminology Consensus Project process and outcome. Int J Behav Nutr Phys Act 2017;14(1):75.
4. Rydin Y, Bleahu A, Davies M, Dávila JD, Friel S, De Grandis G, et al. Shaping cities for health: complexity and the planning of urban environments in the 21st century. Lancet 2012;379(9831):2079-2108.
CORRESPONDING AUTHOR
Fernanda Cerveira Fronza Universidade Estadual de Santa Catarina. Centro de Ciências da Saúde e do Esporte (CEFID). Laboratório de Gênero Sexualidade e Corporeidade (LAGESC). Rua Pascoal Simone, 358, anexo 3. Coqueiros, Florianópolis, SC, Brasil. CEP 88080-350.
E-mail: fernandacerveira@yahoo. com.br
6. Loyen A, Verloigne M, Van Hecke L, Hendriksen I, Lakerveld J, Steene-Johannessen J, et al. Variation in population levels of sedentary time in European adults according to cross-European studies: a systematic literature review within DEDIPAC. Int J Behav Nutr Phys Act 2016;13(71):1-11.
7. Owen N, Bauman A, Brown W. Too much sitting: a novel and important predictor of chronic disease risk? Br J Sports Med 2009;43(2):81-83.
8. World Health Organization. A conceptual framework for action on the social determinants of health. Geneva: World Health Organization; 2010.
9. Stamatakis E, Grunseit AC, Coombs N, Ding D, Chau JY, Phongsavan P, et al. Associations between socio-economic position and sedentary behaviour in a large population sample of Australian middle and older-aged adults: he Social, Economic, and Environmental Factor (SEEF) Study. Prev Med 2014;63:72-80.
10. Mielke GI, Silva ICM, Owen N, Hallal PC. Brazilian Adults’ Sedentary Behaviors by Life Domain: Population-Based Study. PLoS ONE 2014;9(3) e91614.
11. Bernardo AFB, Silva AKF, Napoleão LL, Nalini CD, Rossi RC, Pastre CM, et al. Caracterização das categorias de atividade física e associação com variáveis antro-pométricas de funcionários universitários. Rev Bras Ciên Mov 2013;21(2):89-97.
12. Berria J, Petroski EL, Minatto G. Overweight and obesity and associated factors in technical and administrative staf at a Brazilian Federal University. Rev Bras Cineantropom Desempenho Hum 2013;15(5):535-50.
13. Barros MVG. Atividades físicas no lazer e outros comportamentos relacionados à saúde dos trabalhadores da indústria no estado de Santa Catarina, Brasil. [Dis-sertação de Mestrado – Programa de Pós-Graduação em Educação Física]. Flori-anópolis (SC): Universidade Federal de Santa Catarina; 1999.
14. Matthews CE, Chen KY, Freedson PS, Buchowski MS, Beech BM, Pate RR, et al. Amount of time spent in sedentary behaviors in the United States, 2003-2004. Am J Epidemiol 2008;167(7):875-881.
15. Mielke GI, Hallal PC, Rodrigues GBA, Szwarcwald CL, Santos FV, Malta DC. Prática de atividade física e hábito de assistir à televisão entre adultos no Brasil: Pesquisa Nacional de Saúde 2013. Epidemiol Serv Saúde 2015;24(2):277-286.
16. Reis HFC, Ladeia AMT, Passos EC, Santos FGO, Wasconcellos LT, Correia LCL, et al. Prevalência e variáveis associadas à inatividade física em indivíduos de alto e baixo nível socioeconômico. Arq Bras Cardiol 2009;92(3):203-208.
17. Parry S, Straker L. he contribution of oice work to sedentary behaviour associ-ated risk. BMC Public Health 2013;13(1):296.
18. Katzmarzyk PT, Church TS, Craig CL, Bouchard C. Sitting time and mortal-ity from all causes, cardiovascular disease, and cancer. Med Sci Sports Exerc 2009;41(5):998-1005.
19. Alkhajah TA, Reeves MM, Eakin EG, Winkler EA, Owen N, Healy GN. Sit-stand workstations: a pilot intervention to reduce oice sitting time. Am J Prev Med 2012;43(3):298-303.
20. Malta D, Andrade S, Santos M, Rodrigues G, Mielke G. Tendências dos indi-cadores de atividade física em adultos: Conjunto de capitais do Brasil 2006-2013. Rev Bras Ativ Fís Saúde 2015;20(2):141-151.
21. Garcia LMT, Barros MVG, Silva KS, Del Duca GF, Costa FF, Oliveira ESA, et al. Aspectos sociodemográicos associados a três comportamentos sedentários em trabalhadores brasileiros. Cad Saúde Públic 2015;31(5):1015-1024.
22. Tassitano R, Mielke G, Carvalho W, Oliveira M, Malta D. Tendência temporal de indicadores da prática de atividade física e comportamento sedentário nas capitais da Região Nordeste do Brasil: 2006-2013. Rev Bras Ativ Fís Saúde 2015;20(2):152-164.