Licenciada em Bioquímica
Development of oxidoreductase based
electrochemical biosensors
Dissertação para obtenção do Grau de Mestre em Biotecnologia
Orientadores :
Prof
aDoutora Maria Gabriela Machado de
Almeida, Investigadora associada, FCT-UNL
Prof
aDoutora Sofia de Azeredo Pereira,
Investi-gadora auxiliar, FCM-UNL
Júri:
Presidente: Prof. Doutor Rui Manuel Freitas Oliveira
Arguente: ProfaDoutora Ana Pimenta da Gama da Silveira Viana Semedo,
Professora Auxiliar convidada, Faculdade de Ciências da Univer-sidade de Lisboa
Development of oxidoreductase based electrochemical biosensors
Copyright cPatrícia Raquel dos Santos Rodrigues, Faculdade de Ciências e Tecnologia, Universidade Nova de Lisboa
Acknowledgements
First and foremost, I’d like to thank my supervisor, Prof. M. Gabriela Almeida for all her hard-work and support, the work developed during this year wouldn’t have been the same without her constant presence, commitment and all the opportunities she made possible; I might not always show it but deep down I’m truly grateful for working to/with her. But above all else I’m indebted to her for all the faith she has put in me since the beginning.
I would like to acknowledge all the collaborators, which have contributed for this work and made it possible.
Dr. Michel Kranendonk, from Instituto de Higiene e Medicina Tropical, for providing the CYP samples used during this work.
To Dra. Sofia Azeredo Pereira for all her help and know-how in the early stages of the project.
A huge thank you to Dr. Mathieu Etienne who kindly received me in his lab in Nancy and always had an open door when I needed it.
To the ERASMUS program for enabling me to travel to France and perform such a great part of the work in this thesis.
I can’t help mentioning my appreciation towards my office partners, Claúdia Nóbrega and Humberto Pedroso, for bearing with me even when I’m at my most despicable and can’t stop ranting and venting for the life of me. If indeed someone deserves a place in heaven it’s the both of them for being so patient xD
Like Norma Jean would say “I’m selfish, impatient and a little insecure. I make mis-takes, I am out of control and at times hard to handle. But if you can’t handle me at my worst, then you sure as hell don’t deserve me at my best.” Butterfly you both *
A very special thank you to Célia Silveira, even though she didn’t have any obligation to listen to me, always did so with a lot of patience and helped me in any way she could. I can’t seem to find the right words to thank you enough. I know you like to think of yourself like a cold person but I know the truth, deep down you’re one tiny softy =P
viii
Abstract
This thesis is divided in 2 sections, each describing the development of an oxidore-ductase based biosensor. In the first part human Cytochrome P450 1A2 (CYP1A2) electro-chemistry was studied, while the second is focused on the optimization of immobiliza-tion platforms and operaimmobiliza-tion methods for amperometric biosensors, using cytochrome c nitrite reductase (ccNiR), (Desulfovibrio desulfuricansATCC 27774) as a model enzyme.
The direct electrochemistry of P450s immobilized in water-based sol-gel thin films was described for the first time. The optimization of the film showed that only the com-bination of the inorganic matrix and the PEG400 enabled the direct electron transfer re-action and electrocatalytic activity towards oxygen. The amount of dissolved oxygen in solution revealed itself a significant feature in CYP’s electrochemistry – in anaerobic conditions, when small amounts of oxygen are added the PFeIII/II signal’s intensity in-creased, while in aerobic conditions it disappeared; probably PFeIII is not being regen-erated. However, this was not observed with the CYPOR complex, indicating that the reductase has an essential role in the CYP’s catalytic cycle completion; this was also sus-tained by the fact that only in its presence organic substrates catalysis (caffeine) occurs.
The hybrid sol-gel developed for CYP, was optimized for a nitrite biosensor. ccNiR was successfully incorporated while promptly displaying catalytic currents. Although the bioelectrode’s response decreases after day one, it was able to maintain a reasonable catalytic activity over a time span of 2 weeks. Another electrode modification strategy, studied with ccNiR, was based on the electrophoretic deposition of macroporous assem-blies of single-walled carbon nanotubes. The macroporous structure was created as a result of the presence of polystyrene beads co-deposited with the carbon nanotubes. An increase in the amount of material was correlated with a higher enzyme activity.
x
Keywords: biosensors, cytochrome cnitrite reductase, cytochrome P4501A2, sol-gel,
Resumo
O presente trabalho encontra-se dividido em duas secções, cada um descrevendo o desenvolvimento de um biossensor baseado em oxidorredutases. Na primeira secção, foi estudada a eletroquímica do citocromo P450 1A2 (CYP1A2), enquanto que a segunda se foca na otimização de plataformas de imobilização e métodos de operação para bios-sensores amperométricos, usando a redutase do nitrito multihémica (ccNiR) extraída de Desulfovibrio desulfuricansATCC27774 como um enzima modelo.
A electroquímica direta de P450 imobilizado em filmes à base de filmes de sol-gel aquoso foi descrita pela primeira vez. A otimização da composição do material mostrou que a combinação da matriz inorgânica e o PEG400 facilitava grandemente a transferên-cia de electrões directa. A quantidade de oxigénio dissolvido na solução revelou-se uma característica importante em electroquímica do CYP - em condições anaeróbicas, em que as pequenas quantidades de oxigénio foram adicionados, a intensidade do sinal PFeIII/II aumentou, enquanto que em condições aeróbicas desapareceu; provavelmente o PFeIII não estava a ser regenerado. No entanto, o mesmo não foi observado com o complexo CYPOR, indicando que a redutase tem um papel essencial na conclusão do ciclo catalí-tico do CYP, o que também foi sustentado pelo facto de apenas na sua presença ocorrer a catálise de substratos orgânicos (cafeína).
O sol-gel híbrido desenvolvido para o CYP, foi adaptado para um biossensor de ni-trito no qual a ccNiR foi incorporada com sucesso. Embora a resposta do bioeléctrodo tenha diminuido após o primeiro dia, a atividade catalítica foi mantida a um nivel razoá-vel ao longo de um intervalo de tempo de 2 semanas. Outra estratégia de modificação do eletrodo estudada com ccNiR, foi baseada na deposição eletroforética de nanotubos de carbono macroporosos. A estrutura macroporosa foi criado como resultado da presença de esferas de poliestireno co-depositadas com os nanotubos de carbono. Um aumento na quantidade de material foi correlacionado com o aumento da actividade enzimática.
xii
aberta. O sistema removeu completamente o oxigénio durante mais 1 h e foi aplicado com êxito a um sensor de nitrito baseado na ccNiR.
Palavras-chave: biosensors, reductase do nitrito multihémica, citocromo P4501A2,
Contents
1 Introduction 1
1.1 Electrochemical Biosensors . . . 1
1.1.1 Importance . . . 1
1.1.2 History . . . 1
1.1.3 Biosensor components . . . 4
1.1.4 Immobilization techniques . . . 8
1.1.5 Amperometric biosensors . . . 11
1.2 Nitrite Reductase based electrochemical biosensor . . . 15
1.2.1 Nitrite assessment . . . 15
1.2.2 Nitrite Biosensors . . . 16
1.2.3 Nitrite reductases . . . 18
1.3 Cytochrome P450 based biosensors . . . 24
1.3.1 Cytochromes P450 . . . 24
1.3.2 NADPH-cytochrome P450 reductase. . . 26
1.3.3 Cytochrome P450 1A2 . . . 27
1.3.4 P450 based electrochemical Biosensors. . . 27
1.4 Heme proteins . . . 36
2 Experimental 37 2.1 Part A- Cytochrome P450 1A2 . . . 37
2.1.1 Electrochemical measurements . . . 37
2.1.2 Mediated electrochemistry of cytochrome P450. . . 38
2.1.3 Direct electrochemistry . . . 38
2.2 Part B- Cytochrome c Nitrite Reductase . . . 40
2.2.1 Electrochemical measurements . . . 40
2.2.2 Response to nitrite . . . 40
2.2.3 Hybrid sol-gel matrix . . . 41
xiv CONTENTS
2.2.5 Oxygen scavenger system . . . 42
3 Results and discussion 45 3.1 Cytochrome P450 1A2 . . . 45
3.1.1 Cytochrome P4501A2 in the absence of CPR . . . 45
3.1.2 CYPOR complex . . . 65
3.2 Cytochromecnitrite reductase . . . 69
3.2.1 Hybrid sol-gel matrix . . . 70
3.2.2 Macroporous carbon nanotubes . . . 74
3.2.3 Oxygen scavenger system . . . 78
4 Conclusion 85 4.1 Cytochrome P450 electrochemistry . . . 85
4.2 Cytochrome c nitrite reductase electrochemistry . . . 86
5 Future work 89 5.1 Cytochrome P450 electrochemistry . . . 89
5.2 Cytochrome c nitrite reductase electrochemistry . . . 89
List of Figures
1.1 Clark electrode functioning. . . 2
1.2 Examples for biosensor components and measured analytes1. . . 4
1.3 Key features of amperometric biosensors1.. . . 7
1.4 Sol-gel formation reactions from silica based alkoxide precursors. . . 10
1.5 Schematic representations of surfactants in various forms, the headgroups are represented by the red circles and the hydrophobic tails are in blue. A) Spherical micelles, B) hemimicelles, C) bilayers and D) multilayers on electrode surfaces39.. . . 11
1.6 Direct ET (tunneling mechanism) from the active site of an enzyme to the electrode surface77. . . 13
1.7 Schematic representations of the working principles of enzymatic biosen-sors with a reductase as biologic component: A)Mediated transduction, B)Direct transduction. (medox – mediator in the oxidized form; medred –mediator in the reduced form; enzymeox – reductase oxidized state; en-zymered – Reductase reduced state). . . 14
1.8 Three-dimensional structures of nitrite reductases. (a)Desulfovibrio vul-garis Hildenborough multiheme c nitrite reductase (NrfA4NrfH2 complex); the catalytic subunit (NrfA) is depicted in blue and the electron donor sub-unit (NrfH) in gray; heme groups are shown in dark red.(b)Spinach nitrite reductase; siroheme is shown in dark red and iron-sulfur cluster in yellow. (c)Achromobacter cycloclastes copper nitrite reductase (trimer); the cop-per centres are shown in blue. (d)Pseudomonas aeruginosa cytochrome cd1 nitrite reductase (dimer); heme c is depicted in dark red and heme d in blue125 . . . 18
1.9 Secondary structure of NrfHA viewed parallel to the membrane (grey rect-angle) with haems drawn as red sticks148. . . 24
xvi LIST OF FIGURES
1.11 Model of the conformational equilibrium in CPR177
. . . 26
1.12 The secondary and tertiary structure of human P450 1A2 is shown in two
views. Theα-helices are colored blue, and theβ-strands are colored brown.
These secondary structure elements are designated A-L and 1-4, respec-tively, and are sequentially identified from the N terminus. The heme prosthetic group is represented in sticks and is colored red. The substrate
binding cavity is illustrated as a red mesh surface. . . 27
1.13 schematic representation of electron transfer in microsomal membrane.
Electron transfer from P450 reductase to P450 (adapted from Hara (2000).161). 29
2.1 Surfactant structures. Cationic head group: A) CTAB, B) DDAB; C) DDM
(n-dodecyl-b-D-maltoside). . . 39
2.2 A) structure of sodium silicate; B) structure of poly(ethylene glycol). . . . 39
2.3 Scheme of the experimental device used for the electrophoretic deposition
of carbon nanotubes201. . . . . 42
2.4 Electrochemical cell. . . 42
3.1 Schematic representations of the working principles of a CYP Bioelectrode
with mediated transduction. . . 46
3.2 A) Cyclic voltammograms of methyl viologen in the presence of CYP
mem-brane entraped on a PG electrode, buffer solution 0.1 M MV, 0.1 M KCl and tris-HCl buffer 50 mM pH 7.6. in the presence of varying caffeine
concentrations (0-42mM).Scan rate: 50mV s−1.B Icat variation with nitrite
concentration. . . 47
3.3 3 A) Cyclic voltammograms of methylene blue in the presence of CYP on
a PG electrode, buffer solution 0.1 M MV, 0.1 M KCl and tris-HCl buffer 50 mM pH 7.6. in the presence of varying caffeine concentrations (0–42mM).Scan
rate: 50mV s−1.B. B) Icat variation with nitrite concentration. . . . . 48
3.4 Consecutive cyclic voltammograms of CYP1A2–surfactant films casted on
PG electrodes in 0.1 M KCl and tris-HCl 50 mM pH 7.6; scan rate 50 mV/s.
A) Control electrode with CYP1A2 only, B) DDM C) DDAB, D) CTAB. . . 49
3.5 Variation of the cathodic peak currents on the potential with the scan rate
(5-500 mV/s) (y=-2.48*10-8-4.48*10−10x; r2=0.992) . . . . 51
3.6 Cyclic voltammograms of CYP1A2 casted on PG electrodes, in 0.1 M KCl
and tris-HCl 50 mM pH 7.6 purged electrolyte; scan rate 50 mV/s, in the presence of A only CYP; B CYP/Sodium Silicate; C CYP/Peg400; D
CYP/Sol-gel(sodium silicate and PEG400). . . 53
3.7 Consecutive cyclic voltammograms of PG/CYP1A2–sol-gel film electrode
in 0.1 M KCl and 50 mM tris-HCl buffer pH 7.6 purged with argon. scan
3.8 A) Cyclic voltammograms of PG/CYP1A2–sol-gel film electrode in 0.1 M KCl and 50 mM tris-HCl buffer pH 7.6 purged electrolyte at different scan
rates; from inside to outside: 0.005, 0.01, 0.02, 0.05, 0.1, 0.2, 0.25 V.s−1,
respectively. B) Variation of the cathodic peak currents on the potential
scan rate (y=-0.03-0.017x; r2
=0.98). . . 56
3.9 Consecutive cyclic voltammograms of PG/CYP1A2–sol-gel film electrode
in 0.1 M KCl and 50 mM tris-HCl buffer pH 7.6 aerobic conditions. scan
rate 50 mV/s. . . 58
3.10 Pathways for Biocatalytic Activation of Cyt P450s by Peroxides, Oxygen
Reduction Formed Peroxide.by P450s on Electrodes. . . 59
3.11 Cyclic voltammograms of CYP1A2–sol-gel film casted on PG electrode, buffer solution, 0.1 M KCl and tris-HCl 50 mM pH 7.6 purged with argon. In the presence of varying caffeine concentrations in the absence of oxygen.
Scan rate: 50mV s−1
. . . 60
3.12 Cyclic voltammograms of CYP1A2–sol-gel film casted on PG electrode, buffer solution, 0.1 M KCl and tris-HCl 50 mM pH 7.6 purged with argon. In the presence of varying non-purged caffeine volumes (stock solution 60
mM). Scan rate: 50mV/s.. . . 61
3.13 Cyclic voltammograms of CYP1A2–sol-gel film casted on PG electrode, buffer solution, 0.1 M KCl and tris-HCl 50 mM pH 7.6 purged with argon.
Consecutive additions of non-purged water. Scan rate: 20mV s−1. . . . . . 62
3.14 A) Cyclic voltammograms of PG/CYPOR–sol-gel film electrode in 0.1 M KCl and 50 mM tris-HCl buffer pH 7.6 in a purged electrolyte at different scan rates; from inside to outside: 0.005, 0.01, 0.02, 0.05, 0.1, 0.2, 0.25 V.s-1, respectively. B) Variation of the cathodic peak currents on the potential
scan rate (y=1.85x10⁻¹⁰−8
.39x10−10
x; r2
=0.997). . . 66
3.15 Cyclic voltammograms of films casted on PG electrode in aerobic condi-tions, buffer solution, 0.1 M KCl and tris-HCl 50 mM pH 7.6. Scan rate:
50mV s−1
.of A) CYPOR–sol-gel B) CYP1A2–sol-gel film. a) 1st scan b) 20th
scan. . . 67
3.16 The effect of O2 binding on the electrochemistry of the CYPOR/sol-gel casted on a PG electrode, purged buffer solution, 0.1 M KCl and tris-HCl 50 mM pH 7.6. Consecutive additions of non-purged water. Scan rate:
50mV s−1. . . . . 68
3.17 Cyclic voltammograms of CYPOR/sol-gel films casted on PG electrode in anaerobic conditions, buffer solution, 0.1 M KCl and tris-HCl 50 mM pH 7.6 purged with argon.scan rate, 50 mV/s.(black-line) without sub-strates (red-line) oxygen addition (blue and green lines) caffeine additions
xviii LIST OF FIGURES
3.18 Cyclic voltammograms of ccNiR immobilized on sol -gel films, buffer so-lution, 0.1 M KCl and tris-HCl 50 mM pH 7.6 purged with argon.scan rate, 20 mV/s. A) ccNiR entrapped in a sodium silicate and PEG400 film B)
ccNiR entrapped in a sodium silicate and PEG6000 film. . . 71
3.19 Electrochemical response of PG/ccNiR–sol-gel film(PEG6000) electrode to
varying nitrite concentrations (0-500µM) in 0.1 M KCl and 50 mM tris-HCl
buffer pH 7.6 purged with argon. Scan rate, 20 mV/s. . . 72
3.20 Variation of Icat with nitrite concentration of ccNiR immobilized on sol-gel films A) ccNiR entrapped in a sodium silicate and PEG6000 film B) ccNiR
entrapped in a sodium silicate and PEG400 film. . . 73
3.21 Variation of Icat with nitrite concentration of ccNiR immobilized on sol-gel films A) ccNiR entrapped in a sodium silicate and PEG6000 film B) ccNiR entrapped in a sodium silicate and PEG400 film.A) Variation of Icat with nitrite concentration of ccNiR immobilized on PEG6000 sol-gel films over time. B) Time effects on the biosensor sensitivity for nitrite determination. Sensitivity values were given by the slope of calibration curves performed periodically throughout 80 days. Catalytic currents wer e measured at
-0.8 V vs Ag/AgCl. . . 75
3.22 Electrochemical response of PG/CYP1A2–sol-gel film electrode to varying nitrite concentrations (0-300mM) in 0.1 M KCl and 50 mM tris-HCl buffer
pH 7.6 purged with argon. Scan rate, 20 mV/s. . . 76
3.23 Catalytic current variation of the ccNir/CNT-PS layer as a function of
ni-trite concentration. Macroporous SWCNTs deposition time. (•) 30s; (•)
135s; (•) 180s; (•) 240s. . . 77
3.24 Scheme of the GOx-CAT scavenging system. . . 78
3.25 Cyclic voltammograms of PGE/ccNiR/PEG at 20 mV s -1 in 10 mL of 0.1
M KCl and tris-HCl 50 mM pH 7.6; (a) GOx (12.5µM, 15 UmL -1 ) and CAT
(16.6µM, 2 kU mL -1 ) in solution (b) GOx (12.5µM, 15 UmL-1), CAT (16.6
µM, 2 kU mL-1) and glucose (50 mM) in solution. . . 80
3.26 Cyclic voltammogram with PGE at 20 mV s -1 in 10 mL of 0.1 M KCl and
tris-HCl 50 mM pH 7.6; (a) upon addition of GOx (12.5 µM, 15 UmL -1
) and CAT (16.6 µM, 2 kU mL -1 ) and with the addition of glucose (50
mM).(b) addition of 100 mM Nitrite. . . 81
3.27 Cyclic voltammogram with ccNiR/CAT immobilized in PGE at 20 mV s-1 in s-10 mL of 0.s-1 M KCl and tris-HCl 50 mM pH 7.6; A) ( - ) addition of
GOx (12.5 µM, 15 UmL -1 ) and of glucose (50 mM).(-) after purging the
electrolyte solution with argon for 10 min (-) CAT (16.6 µM, 2 kU mL -1
) (-) 100 mM Nitrite.B) control experiments performed in the absence of ccNiR. (Red line) increasing hydrogen peroxide concentrations (0-3mM);
List of Tables
1.1 Historical landmarks in the development of enzyme based electrochemical
biosensors. . . 3
1.2 Types of receptors used in biosensorsa.35 . . . . 5
1.3 immobilization procedures for enzymes50.. . . 9
1.4 Generations of enzyme based amperometric and voltammetric biosensors MET, mediated electron transfer; DET, direct electron transfer96 . . . 15
1.5 Description and analytical parameters of nitrite reductase based biosen-sors (N.A.—not applicable; N.D.—not determined; . . . 20
1.6 Summary of different electrode types and electrode modifications used to construct CYP electrodes and biosensors165 . . . 31
2.1 Mediators structure and formal reduction potential. . . 38
2.2 Surfactant critical micelar concentrations. . . 39
2.3 Compositions of sol-gel based matrices using TMOS and CTAB. . . 40
2.4 Compositions of sol-gel based matrices using Sodium silicate and CTAB. . 40
1
Introduction
1.1
Electrochemical Biosensors
1.1.1 Importance
The sensitive and selective determination of a large number of compounds is of great relevance, and has always been a problem of the utmost importance scientific research. In the field of health-care, it is indispensable for the diagnosis of diseases. Biotechnology, too, requires the analysis of complex media. High selectivity, even in trace analysis, has been achieved by the considerable progress in analytical instrumentation, as is reflected by modern gas chromatography, high-pressure liquid chromatography, mass spectrome-try and atomic absorption spectroscopy. However, due to the high costs associated with these powerful instrumental techniques they are only used in specialized laboratories. The development of methods highly selective and easy to handle is thus a key issue in analysis. Whereas reliable sensors are available for the determination of physical pa-rameters, e.g. temperature, pressure, or sound energy, the qualitative and quantitative analysis of chemical composition remains difficult. Electrochemical sensors, such as pH electrodes and Clark-type electrodes for oxygen measurement are widely used for this purpose1-3. Biosensors may be the answer to these problems.
1.1.2 History
1. INTRODUCTION 1.1. Electrochemical Biosensors
committee came up with their own definition, comprising Camman’s definition plus sev-eral parameters that must be fulfilled (see below)2
.
Even though Karl Camman was the one who laid claim to the term, Leland C. Clark is considered by many the father of biosensors. He had developed the first bubble oxygena-tor for use in cardiac surgery. Conversely, when he came to publish his results, his article was refused by the editor since the oxygen tension in the blood coming out from the de-vice could not be measured. This instigated Clark to develop the oxygen electrode4, with which he meant to measure the reduction of oxygen with a platinum electrode in order to determine the oxygenation of blood5
. His first sensor failed because the blood compo-nents would adsorb on the electrode’s surface, which in turn distorted the signal. Later on, Clark had the idea, which would change the history of biosensors, of using the cello-phane wrapper of a cigarette packet on his sensor, making it so that only low molecular weight substances, mainly oxygen, could reach the electrode surface and be measured. The reduction current indicated the oxygen concentration, and so the Clark electrode was created2
. Nowadays, Teflon is used as the membrane and this sensor remains a key tool in medicine and environmental monitoring. Afterwards, Clark developed the sensor further by entrapping concentrated glucose oxidase (GOx) with another semi-permeable membrane in front of the electrode, which could then be used for multiple glucose mea-surements based on the monitoring of the reaction described on equation 1.16
.
glucose+O2
glucose oxidase
−−−−−−−−→gluconic acid+H2O2 (1.1)
The enzyme layer became an integrated part of the sensor. Lee Clark went on to coin the term “enzyme electrode”at a meeting of the New York Academy of Sciences in 19622
. It was this electrode arrangement that introduced the new sensor concept - the biosensor. A few years later, hydrogen peroxide reduction was detected on the electrode instead of oxygen, due to limitations concerning this particular system, namely, oxygen fluctua-tions, substrate limitations/sensitivity, electrochemical interferences, among others7
. Clark’s system has been thoroughly studied and modified throughout the years, for several different purposes, one of which – an oxygen scavenging system – will be ex-plored in this thesis.
1. INTRODUCTION 1.1. Electrochemical Biosensors
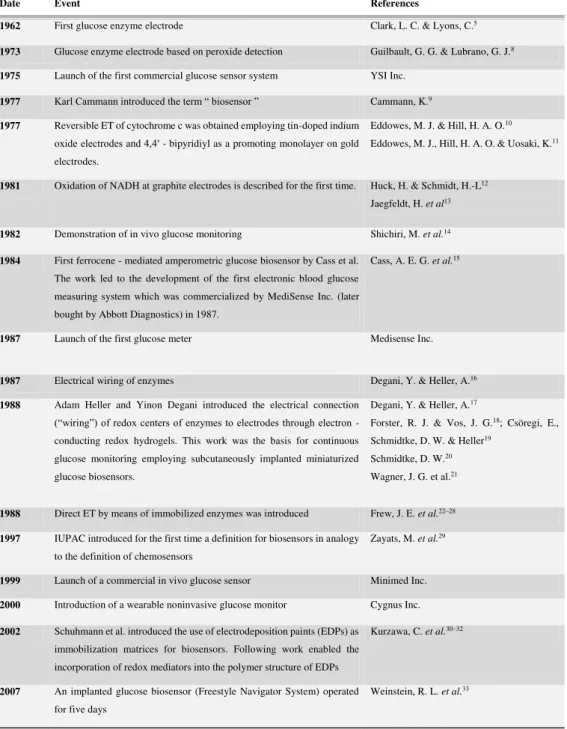
Table 1.1: Historical landmarks in the development of enzyme based electrochemical biosensors.
Date Event References
1962 First glucose enzyme electrode Clark, L. C. & Lyons, C.5
1973 Glucose enzyme electrode based on peroxide detection Guilbault, G. G. & Lubrano, G. J.8
1975 Launch of the first commercial glucose sensor system YSI Inc.
1977 Karl Cammann introduced the term “ biosensor ” Cammann, K.9
1977 Reversible ET of cytochrome c was obtained employing tin-doped indium
oxide electrodes and 4,4′ - bipyridiyl as a promoting monolayer on gold electrodes.
Eddowes, M. J. & Hill, H. A. O.10
Eddowes, M. J., Hill, H. A. O. & Uosaki, K.11
1981 Oxidation of NADH at graphite electrodes is described for the first time. Huck, H. & Schmidt, H.-L12
Jaegfeldt, H. et al13
1982 Demonstration of in vivo glucose monitoring Shichiri, M. et al.14
1984 First ferrocene - mediated amperometric glucose biosensor by Cass et al.
The work led to the development of the first electronic blood glucose measuring system which was commercialized by MediSense Inc. (later bought by Abbott Diagnostics) in 1987.
Cass, A. E. G. et al.15
1987 Launch of the first glucose meter Medisense Inc.
1987 Electrical wiring of enzymes Degani, Y. & Heller, A.16
1988 Adam Heller and Yinon Degani introduced the electrical connection
(“wiring”) of redox centers of enzymes to electrodes through electron - conducting redox hydrogels. This work was the basis for continuous glucose monitoring employing subcutaneously implanted miniaturized glucose biosensors.
Degani, Y. & Heller, A.17
Forster, R. J. & Vos, J. G.18; Csöregi, E.,
Schmidtke, D. W. & Heller19
Schmidtke, D. W.20
Wagner, J. G. et al.21
1988 Direct ET by means of immobilized enzymes was introduced Frew, J. E. et al.22–28
1997 IUPAC introduced for the first time a definition for biosensors in analogy
to the definition of chemosensors
Zayats, M. et al.29
1999 Launch of a commercial in vivo glucose sensor Minimed Inc.
2000 Introduction of a wearable noninvasive glucose monitor Cygnus Inc.
2002 Schuhmann et al. introduced the use of electrodeposition paints (EDPs) as
immobilization matrices for biosensors. Following work enabled the incorporation of redox mediators into the polymer structure of EDPs
Kurzawa, C. et al.30–32
2007 An implanted glucose biosensor (Freestyle Navigator System) operated
for five days
1.1.3 Biosensor components
Nowadays, biosensors are characterized by the direct spatial combination of a matrix-bound biologically active substance - the so-called receptor - with a transducer compo-nent. For molecular recognition, biosensors may also be equipped with other biologic elements instead of enzymes. Besides nearly all kinds of electrodes, various other signal transducers have been combined with the immobilized bio-material34
. Examples of these components are given in Figure 1.2; this compilation helps one to understand which pa-rameters change during a biological recognition event in a biosensor. The choice of the transduction process and transduction material is dependent on this knowledge as well as the chemical approach to construct the sensing layer on the transducer surface.
Figure 1.2: Examples for biosensor components and measured analytes1.
1. INTRODUCTION 1.1. Electrochemical Biosensors
electrochemical measurement techniques linked to them29.
Enzymes are by far the most commonly used biological components in biosensors. Furthermore, electrochemical transduction is the most popular signaling method, with amperometry (measurement of electric current) the favored configuration. It is advan-tageous if the chemical structure of the enzyme allows the introduction of additional functionalities for chemical modification with redox mediators, binding, or crosslinking with the immobilization matrix. In addition, the potential for tuning the properties of the redox enzyme by means of genetic or chemical techniques can be helpful for biosensor optimization. An important factor, especially with respect to potential commercializa-tion, is that the redox enzyme is available at reasonable costs and effort. This work will focus on membrane-bound enzymes as the bioreceptor, therefore they will be given spe-cial attention in this section.
The main advantages of employing enzymes in biosensor architectures are the fol-lowing:
i) They can exhibit a very high catalytic activity with a turnover on a per mole basis which makes them not only exceptional bioelectrocatalysts for effective signal am-plification in biosensors but also for biofuel cells. Good turnover frequencies kcatare
in the range of up to, at least, 100 s-1.
ii) Typically, enzymes have a high selectivity for their substrates.
iii) The driving force - redox potential needed to achieve enzymatic biocatalysis - is often very close to that of the enzyme’s cofactors. Therefore, biosensors can operate at moderate potentials.
1. INTRODUCTION 1.1. Electrochemical Biosensors
Figure 1.3: Key features of amperometric biosensors1.
Knowing the most influential parameters on a specific biosensor is the basis to un-derstand and fine tune the performance of these devices in a rational manner. Figure 1.3 summarizes several analytical features of typical biosensors; selectivity, sensitivity, ac-curacy, response and recovery times, as well as operating lifetime are some of the most significant key factors.
recognition reaction (e.g., inhibitors or other enzyme substrates). Additional problems such as leakage from the sensing layer, loss of enzyme activity or electrode fouling may occur. Therefore, changes in sensitivity and baseline drifts are bound to arise during biosensor operation. Suitable strategies are needed to ensure reproducible and quantita-tive results38. For applications aimed for the general public, it is imperative to character-ize and optimcharacter-ize the biosensor architecture under actual measuring conditions.
Besides dictating the efficiency of electrochemical transduction, the biosensor design also plays a fundamental role in defining the response features. For example, sensitivity and response time, which strongly depends on mass transfer limitations, are particularly influenced by the characteristics of the immobilization matrix39.
1.1.4 Immobilization techniques
The main limitation for successful applications comes from the difficulty to elaborate reagentless devices in which all components enabling the bioelectrochemical detection (i.e. enzyme(s), cofactor and electro-catalytic system for cofactor detection and regenera-tion) are immobilized in a durable and active form40. The immobilization of biomolecules permits the re-use of costly biological molecule and allows a significant simplification of the analytical apparatus.
Controlled immobilization techniques are useful to more than allowing the re-use or continuous use of industrial enzymes. The immobilization and subsequent post-immobilization techniques can be very advantageous to greatly increase activity–stability properties of enzymes41. For example, inactivation of multimeric enzymes may be strongly influenced by the dissociation of subunits. On the other hand conformational changes promoted by any denaturing agent (heat, pH, organic solvents) on the small fraction of dissociated monomers could be much more rapid and intense42,43.
The use of biological species such as proteins, peptides, nucleic acids and even whole cells in biosensors relies largely on the successful immobilization of the bioreceptor in a physiologically active form. Typical methods to immobilize bioreceptor onto inor-ganic, organic or polymeric surfaces have been based on physical adsorption44, cova-lent binding45, entrapment in semi-permeable membranes46and microencapsulation into polymer microspheres and hydrogels47,48. Notwithstanding problems such as leaching and desorption44, denaturation and difficulty controlling the orientation of the biomolecule49, these methods have proven to be amenable to the immobilization of a large number of biomolecules.
Various methods have been described for protein immobilization (Table 1.3). In gen-eral, biosensors using adsorbed enzymes or proteins are insensitive and unstable, except for a few cases, this procedure alone is rarely used in biosensor construction.
1. INTRODUCTION 1.1. Electrochemical Biosensors
Table 1.3: immobilization procedures for enzymes50.
preparation displays a decrease in stability. Chibata51reports that, of 50 enzyme immo-bilizations studied, 60% showed an increase in stability, 24% were unaffected and 16% showed a decrease in stability.
As it is, in this thesis, special attention will be given to sol-gel immobilization and surfactant films. The interest ofsol–gelchemistry for bioencapsulation has been largely discussed in the literature52 for several types of biosensors, but most importantly it has been successful in protein immobilization on electrode surfaces53,54. Sol-gel matrices are produced from a starting colloidal suspension of sol-gel precursors –the sol – which un-dergoes hydrolysis and condensation reactions to form the gel (Figure 1.4).
The sol-gel entrapment can be a relatively gentle chemical procedure that is carried out at room temperature so that many of the molecules can endure the entrapment. The sol-gel methodology has been extensively used to immobilize soluble proteins showing that the majority of them can be encapsulated with retention of their native structure and functionality and an enhanced stability52,55–58.
Bioencapsulation within these materials is usually obtained from the hydrolysis of alkoxide precursors (usually tetraethyl orthosilicate, TEOS, or tetrametyl orthosilicate, TMOS) resulting in a colloidal sol solution. Subsequently, a buffered aqueous solution containing the biomolecule of interest is added to the sol producing a polycondensation reaction that leads to the formation of a transparent highly porous gel that encloses the species within its pores. The popularity of sol-gel materials can be attributed to this and other significant factors, namely54:
display both the mechanical stability of a rigid inorganic framework and the particu-lar reactivity (e.g., selective recognition, optical properties) of the organic component;
(b) The fact that sol-gel-derived materials can be used to encapsulate biomolecules (e.g., enzymes, antibodies, or other proteins) in a functional state;
(c) The discovery of the supramolecular template approach, which can generate ordered mesostructures over long length scales.
Figure 1.4: Sol-gel formation reactions from silica based alkoxide precursors.
Surfactantsare surface active agents composed of a charged or polar head group and
1. INTRODUCTION 1.1. Electrochemical Biosensors
Figure 1.5: Schematic representations of surfactants in various forms, the headgroups are represented by the red circles and the hydrophobic tails are in blue. A) Spherical micelles, B) hemimicelles, C) bilayers and D) multilayers on electrode surfaces39.
Electrochemistry mainly takes advantage of two properties associated with these sur-face active agents: their ability to adsorb at intersur-faces and to generate membrane-like structures61. In particular the membrane bound proteins incorporated in surfactant films are expected to experience a more natural environment, closer to the physiological sur-roundings they are taken from. Accordingly, surfactant films can help to promote and enhance protein electrochemistry and catalysis. Obvious cases are membrane-bound proteins62, such as the enzyme employed in this thesis. Various soluble proteins have also shown enhanced electron transfer in surfactant films61,64-66. Myoglobin and some cytochrome P450 isoforms, for example, have showed good reversible electrochemistry in surfactant films of DDAB (Dodecyldimethylammonium bromide) at PG electrodes, as opposed to the bare ones, where no DET was observed. According to spectroscopic stud-ies, both proteins were also able to keep their native conformations while embedded in the films62,63,67.
The good performance of proteins in surfactant films has been associated to the strong adsorption of the surfactant at the electrofilm interface, therefore avoiding the de-naturative adsorption of proteins or of other macromolecules that could block electron transfer63. Also, the well-defined microstructure and dynamics of the surfactant films al-lows good diffusion within the layer. These films can also help to guide the orientation of immobilized proteins. Which may not be related with the surfactant headgroup charge but with the interaction between the protein and the hydrophobic bilayers68.
Heme transfer proteins: flavocytochromes72, engineered mutants73, as well as bacterial74 and mammalian75variants, have been investigated.
1.1.5 Amperometric biosensors
As previously mentioned, a biosensor is generally defined as a sensing device consisting of a biological recognition element in intimate contact with a suitable transducer which is able to convert the biological recognition reaction, or eventually the biocatalytic process, into a measurable electronic signal. In the particular case of an amperometric sensor, the redox species in the sensing layer are oxidized or reduced at the transducer surface generating a current through the electrode. Assuming an enzyme catalyzed oxidation of a substrate (e.g. glucose, lactate, alcohol, etc.), either a prosthetic group integrated within the enzyme (e.g. FAD, PQQ, heme, transition metals) or a co-substrate (e.g. FMN, NAD+, NADP+) has to be reduced, intermediately storing the transferred redox equivalents. A measurable current through the electrode is related to the re-oxidation of the prosthetic group or the co-substrate in order to regenerate the enzyme and make it available for further substrate recognition and conversion reactions. Hence, a signal is only obtained if the transfer of electrons between the intermediately reduced enzyme (i.e. the prosthetic group or the co-substrate) and the electrode is possible. From this discussion it is evident that the specific features of the biosensor are highly dependent on the kinetics of this electron transfer process. Consequently, an essential prerequisite for the development of amperometric biosensors with high sensitivity and fast response characteristics is to establish a fast electron transfer (ET) from the biological component to the electrode.
1.1.5.1 Electron transfer
1. INTRODUCTION 1.1. Electrochemical Biosensors
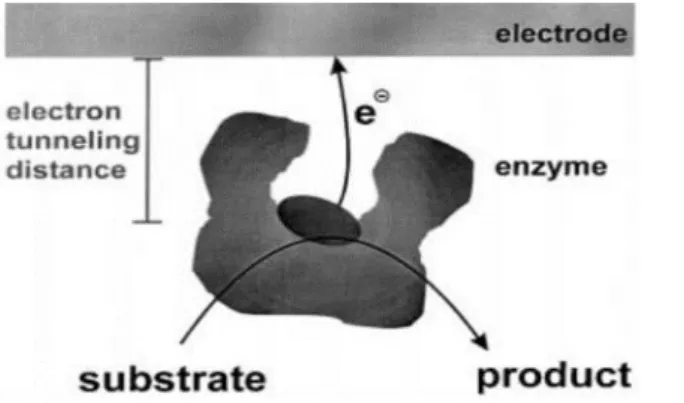
Figure 1.6: Direct ET (tunneling mechanism) from the active site of an enzyme to the electrode surface77.
Thus, the main aim in the design of optimized amperometric biosensors is to en-sure fast ET processes based on electrode architectures with predefined ET pathways interconnecting the redox site within the enzyme and the electrode surface. The elec-tron transfer in biology usually involves initial protein-protein complex formation based on the complementarity of the docking sites. Efficient protein-electrode reactions ap-pear to have some similarities to the way in which proteins act with their natural redox partner78. Therefore, methods for chemically modifying electrode surfaces as to mimic the biological situation were developed. The heterogeneous electron transfer between proteins and electrodes may be coupled with other reactions where the proteins act as vectorial mediators79,80.
The principle of direct electrochemistry of redox proteins, can be explained by com-paring this technique to the more traditional solution essays of enzyme activity. In homo-geneous enzyme kinetics, the enzyme may be mixed in a cuvette with its substrate and a redox partner (otherwise called a mediator or co-substrate), providing a source/sink of electrons for the redox transformation of the substrate and whose absorbance depends on its redox state. In the steady state, the rates of substrate and co-substrate transforma-tions are equal to the turnover rate of the enzyme and can therefore be determined by following the absorbance change of the solution81.
Figure 1.7: Schematic representations of the working principles of enzymatic biosensors with a reductase as biologic component: A)Mediated transduction, B)Direct transduc-tion. (medox – mediator in the oxidized form; medred –mediator in the reduced form; enzymeox – reductase oxidized state; enzymered – Reductase reduced state).
Nowadays is still common to think that oxireductases are too large and too fragile to interact directly with a solid electrode without being at least partly denaturated. It is usu-ally held that because the active site of these enzymes is deeply buried in the protective protein matrix, direct electron exchange at an electrode can only occur under exceptional conditions. However, more than 20 years have passed since it was shown that direct electron transfer (DET) can occur between an electrode and a large, catalytically active enzyme,82,93and about one hundred examples have already been reported81,94.
1. INTRODUCTION 1.2. Nitrite Reductase based electrochemical biosensor
fewer interfering species are reduced or oxidized95,97,98. In mediated electrochemistry, the consumption of the redox partner is detected as a current wave resulting from its electrochemical recycling on the electrode; only the mediator interacts with the electrode, and the homogeneous catalytic process which occurs in the bulk of the electrochemical cell is fundamentally the same as that in solution assays81.
Biosensors can be grouped into generations according to the modes of signal trans-fer between a redox enzyme and an electrode, i.e., via the natural secondary substrates or products of the enzyme reaction (first generation), via artificial (either synthetic or biological) electron mediators (second generation) or via direct electronic contact (third generation)34,99,100. A typical first generation biosensor is a glucose sensor with gel en-trapped glucose oxidase on a Clark-type electrode101,102and also many variants of cou-pled enzymes on oxygen-sensitive electrodes103.
Table 1.4: Generations of enzyme based amperometric and voltammetric biosensors MET, mediated electron transfer; DET, direct electron transfer96
.
1.2
Nitrite Reductase based electrochemical biosensor
1.2.1 Nitrite assessment
Nitrate (NO−
3) and nitrite (NO−2) are rarely found without each other, because their chemistries
are practically indissociable.
Nitrate occurs naturally in soils containing nitrogen-fixing bacteria, decaying plants, septic system effluents, and animal manure. Among the artificial sources of nitrate there are nitrogenous fertilizers and airborne nitrogen compounds emitted by industry and motor vehicles. Nitrate penetrates through the soil and remains in groundwater for decades104; groundwater is the source for >50% of drinking water supplies, 96% of pri-vate water supplies, and an estimated 39% of public water supplies105.
environmental problems in recent years106,107. The health implications of exposure to ni-trate in drinking water were first reported in 1945 by Comly after observing cyanosis in infants in Iowa, where well water was used in formula preparation108. These implica-tions made it so that nitrite has been considered an important toxic agent109. However, as of late, there have been many new findings that imply the nitrite’s role in the human organism may not be so straightforward, the main controversy is that nitrite’s ingestion might be beneficial for human health despite it’s being considered solely hazardous since the 1940’s110-122.
In order to manage environmental and health risks, deriving from exposure to these ions, governmental agencies have implemented rules and directives to restrict the levels of NO−
3 and NO−2 in drinking waters and food products. European directive 98/83/EC
has established the maximum admissible levels of nitrate and nitrite in drinking water at 50 and 0.1 ppm, respectively. Likewise, the World Health Organization has set these limits at 50 ppm (NO−
3) and 3 ppm (NO−2) (WHO/SDE/WSH/07.01/16). More recently,
following the European Food Safety Authority recommendations, 2006/52/EC directive has reduced the authorized levels for these ions in meat and other food products, which should be controlled on the basis of added rather than residual amounts (e.g. 150 mg/kg of nitrites in meat products). Furthermore, the determination of nitrite in human physio-logical fluids is also commonly used for clinical diagnosis. As a result, there is a growing demand to detect nitrite in food, drinking water and environmental samples123.
1.2.2 Nitrite Biosensors
In the last decades, biosensor technology has been exploited as a route to provide reliable nitrite quantification in complex samples. Hence, several protein electrodes and optical devices are described in the literature2,34,39,124-130.
When it comes to nitrite biosensors, the bulk of the approaches make use of mediated electron transfer by employing redox mediators (e.g. viologen derivates) that display a fast and reversible electrochemical response and are able to shuttle electrons rapidly to the redox centers of the proteins39.
1. INTRODUCTION 1.2. Nitrite Reductase based electrochemical biosensor
have become a common configuration. More advanced strategies operating in the un-mediated mode via DET131 and exploiting nanostructured materials as electrodes inter-faces were recently proposed35. In parallel, stability has been substantially improved through the construction of leak free devices and the use of protecting coats. Very re-cently, the screen printing technology was successfully employed, opening up the route for miniaturization132.
The less used, mediatorless approaches the ones on which this thesis will focus -are based on the direct electron transfer between the nitrite reductases and the electrode material.
Table 1.5 summarizes some of the most recent and representative works done in the field. A detailed analysis of this table clearly demonstrates that although electrode mod-ifications are made with all sorts of materials, combined with polymers, silicates, surfac-tants or ionic liquids, the systems share many common features. Direct electron transfer between proteins and electrodes is frequently promoted by the modifying matrix and the intensity of the catalytic currents is correlated with nitrite concentration; amperometric transduction is a frequent option; and the working electrodes are always made of carbon materials (usually, glassy carbon (GC)).
1.2.3 Nitrite reductases
Nitrite reducing enzymes (NiRs) are the natural candidates for playing the role of bionition element in the nitrite biosensing devices. Four classes of NiRs have been recog-nized so far (Figure 1.8), all of which have already been used in biosensor applications. They can be grouped according to the type of co-factors and reaction product133,134.
Figure 1.8: Three-dimensional structures of nitrite reductases.(a)Desulfovibrio vulgaris Hildenborough multiheme c nitrite reductase (NrfA4NrfH2 complex); the catalytic sub-unit (NrfA) is depicted in blue and the electron donor subsub-unit (NrfH) in gray; heme groups are shown in dark red. (b)Spinach nitrite reductase; siroheme is shown in dark red and iron-sulfur cluster in yellow. (c) Achromobacter cycloclastes copper nitrite re-ductase (trimer); the copper centres are shown in blue. (d) Pseudomonas aeruginosa cytochrome cd1 nitrite reductase (dimer); heme c is depicted in dark red and heme d in blue125
.
There are two types of ammonia forming nitrite reductases: cytochrome c nitrite re-ductases (ccNiRs), which are multi-heme enzymes isolated from sulfate or sulfur reduc-ing bacteria, and sirohemic nitrite reductases, which contain a siroheme and an iron-sulfur cluster and are commonly purified from photosynthetic organisms such as plants, algae and cyanobacteria. This group of enzymes is able to catalyze the six electron reduc-tion of nitrite to ammonia, according to the following equareduc-tion:
N O−
2 + 8H +
+ 6e−→N H+
4 + 2H2O (1.2)
1. INTRODUCTION 1.2. Nitrite Reductase based electrochemical biosensor
N O−
2 + 2H +
+e−→N O+H2O (1.3)
21 | P a g e
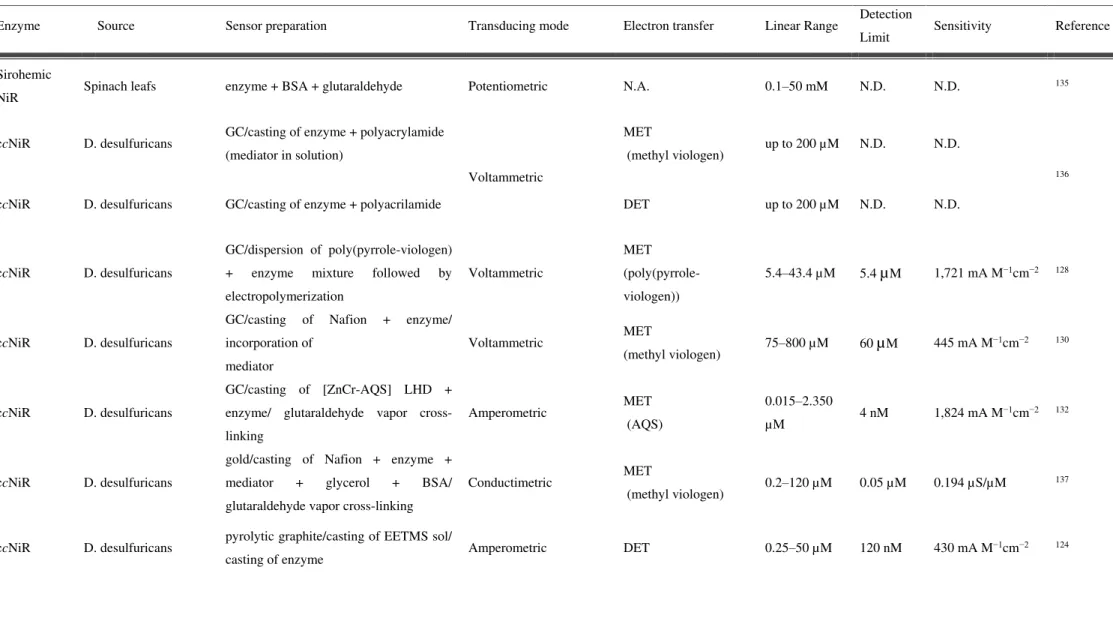
Table 1-5 Description and analytical parameters of nitrite reductase based biosensors (N.A.—not applicable; N.D.—not determined;
Enzyme Source Sensor preparation Transducing mode Electron transfer Linear Range Detection
Limit Sensitivity Reference
Sirohemic
NiR Spinach leafs enzyme + BSA + glutaraldehyde Potentiometric N.A. 0.1–50 mM N.D. N.D.
135
ccNiR D. desulfuricans GC/casting of enzyme + polyacrylamide
(mediator in solution)
Voltammetric
MET
(methyl viologen) up to 200 µM N.D. N.D.
136
ccNiR D. desulfuricans GC/casting of enzyme + polyacrilamide DET up to 200 µM N.D. N.D.
ccNiR D. desulfuricans
GC/dispersion of poly(pyrrole-viologen)
+ enzyme mixture followed by
electropolymerization
Voltammetric
MET
(poly(pyrrole-viologen))
5.4–43.4 µM 5.4 µM 1,721 mA M−1cm−2 128
ccNiR D. desulfuricans
GC/casting of Nafion + enzyme/
incorporation of
mediator
Voltammetric MET
(methyl viologen) 75–800 µM 60 µM 445 mA M
−1cm−2 130
ccNiR D. desulfuricans
GC/casting of [ZnCr-AQS] LHD +
enzyme/ glutaraldehyde vapor
cross-linking
Amperometric MET
(AQS)
0.015–2.350
µM 4 nM 1,824 mA M
−1cm−2 132
ccNiR D. desulfuricans
gold/casting of Nafion + enzyme +
mediator + glycerol + BSA/
glutaraldehyde vapor cross-linking
Conductimetric MET
(methyl viologen) 0.2–120 µM 0.05 µM 0.194 µS/µM
137
ccNiR D. desulfuricans pyrolytic graphite/casting of EETMS sol/
casting of enzyme Amperometric DET 0.25–50 µM 120 nM 430 mA M
22 | P a g e
ccNiR D. desulfuricans graphite/casting of SWCNTs
dispersion/casting of enzyme Voltammetric DET up to 150 µM N.D. 2,400 mA M
−1cm−2 138
ccNiR S. deleyianum
graphite and mediator composite/casting
of enzyme + poly(carbamoyl sulfonate)
hydrogel membrane
Amperometric MET (phenosafranin) up to 250 µM 1 µM 446.5 mA M−1cm−2 139
cd1NiR P. denitrificans
graphite/enzyme entrapment through
dialysis membrane
(mediator in solution)
Amperometric MET
(1-methoxy PMS)
4.35–65.2
µM* N.D. N.D.
140
cd1NiR P. denitrificans
graphite/enzyme entrapment with dialysis
membrane
(mediator in solution)
Amperometric MET
(1-methoxy PMS) up to 750 µM 10 µM 33 mA M
−1cm−2 139
cd1NiR P. pantotrophus enzyme incorporated in bulk sol-gel
monoliths of TEOS Optical N.A.
0.075–1.250
µM 0.075 µM N.D.
141
cd1NiR P. pantotrophus enzyme in controlled pore glass beads of
isothiocyanate Optical N.A. 0–4 mM 0.93 µM 19.5 nM
−1 142
cd1NiR M.
hydrocarbono-clausticus
graphite/casting of polyvinyl alcohol +
enzyme + mediator followed by
photopolymerization
Amperometric MET
(cyt-c552) 10–200 µM 7 µM 2.49 A cm
2 µM−1 129
CuNiR R. sphaeroides GC/electropolimerization of PPB/ casting
of enzyme + PBV Voltammetric MET (PPB) up to 50 µM 1 µM 789 mA M
−1cm−2* 143
CuNiR R. sphaeroides
GC/casting of poly(vinyl alcohol) +
mediator + enzyme/ casting of
poly(allylamine hydrochloride)/
casting of hydrophilic polyurethane
Amperometric MET
(methyl viologen) 1.5– 1.5 µM 170 mA M
23 | P a g e
CuNiR A. faecalis
gold/enzyme entrapped with dialysis
membrane
(mediator in solution)
Amperometric MET
(1-methoxy PMS) 0–22 µM* 0.22 µM* N.D.
145
CuNiR A. faecalis
gold/dip-coating in (cysteine) thiolated
hexapeptide
(enzyme and mediator in solution)
Voltammetric
MET (pseudoazurine)
200–1,500
µM N.D. N.D.
146
gold/dip-coating in (cysteine) thiolated
hexapeptide
(enzyme and mediator in solution)
MET (ruthenium
1. INTRODUCTION 1.2. Nitrite Reductase based electrochemical biosensor
1.2.3.1 Cytochrome c Nitrite Reductase
The cytochrome c nitrite reductase fromD. desulfuricanswas used as biorecognition ele-ment, in the experiments addressed in this thesis. This enzyme is involved in the path-way of dissimilatory nitrite reduction to ammonia thereby playing a crucial role in the biogeochemichal nitrogen cycle.
As mentioned above, ccNiR catalyzes the six-electron reduction of nitrite to ammonia (NH+4) using electrons from the oxidation of formate or hydrogen, mediated through a
menaquinone and a quinol- oxydizing system147.
ccNiR also catalyzes the reduction of nitrite oxide and hydroxylamine to ammonia and of sulfite to sulfide It is usually found as a membrane associated complex with a transmembrane subunit. The physiological form of the enzyme is believed to be a dou-ble trimer of 2 NrfA and 1 NrfH subunits148 (Figure 1.9) in vitro, the protein complexes associate each other forming large aggregates (min. 890 kDa)149.
Periplasm
Cytoplasm
Figure 1.9: Secondary structure of NrfHA viewed parallel to the membrane (grey rectan-gle) with haems drawn as red sticks148.
The catalytic subunit NrfA (61 kDa), which is associated to the periplasmic mem-brane, is a pentaheme cytochrome c-type where the short distances between hemes allow a fast and efficient electron transfer150,151. It can be assessed by two channels that reach the protein surface.
They were proposed to be the substrate and product channels because they have an overall electrostatic charge opposed to the anion NO−
2 substrate and cation NH +
4 product
1. INTRODUCTION 1.3. Cytochrome P450 based biosensors
1.3
Cytochrome P450 based biosensors
1.3.1 Cytochromes P450
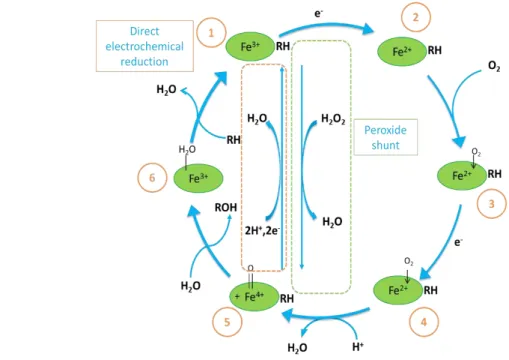
he cytochromes P450b (CYP) are a ubiquitous superfamily of mixed function oxidases. They play an important role in the detoxication of bioactive compounds and hydrophilic xenobiotics being formed inside cells in living organisms (cholesterol, saturated and unsaturated fatty acids, steroids, prostaglandins and others) or from external souces (medicines, drugs, food supplements, and environmental pollutants)166,167. These en-zymes represent a superfamily of b-type hemeproteins with a catalytic activity towards two substrates: oxygen and organic substances The general monooxigenase reaction by which the CYPs metabolize their substrates is the following.
RH+O2+N A(P)H+H+ →ROH+H2O+N AD(P)H+ (1.4)
The generic reaction catalyzed by P450 (Figure 1.11) implies the reduction of molecu-lar oxygen with two electrons that are supplied by various redox partners168.
These enzymes are unique in being able to hydroxylate non activated carbon atoms (C-H bonds)156,166,167. The products of substrates’ metabolism usually serve as regu-lators in cells or are excreted from organisms. Cytochromes P450 are capable of metab-olizing over 1,000,000 chemicals and involve about 60 distinct classes of biotransforma-tion reacbiotransforma-tions, e.g. hydroxylabiotransforma-tion, N-, O- or S-demethylabiotransforma-tion, dealkylabiotransforma-tion, epoxydabiotransforma-tion among others169,170. This particular feature of P450s makes them one of the most studied proteins as they are highly promising for use in farmaceutical drug assays and in stereo-directed synthesis of steroids171. For eukaryotic microsomal P450, the membrane-bound form of NADPH cytochrome P450 reductase (CPR) is the primary source of electrons168. Electrons from NAD(P)H flavins ferric form of cytochrome P450 (Fe3+
). Resting P450s are in the ferric form (Fe+3), one electron reduction of ferric form leads to ferrous state
(Fe+2) of hemoprotein, which can bind oxygen172. During reduction of P450s according to
the schemeF e+3+e−→F e +
2 NADPH or NADH are exhausted159. The P450s share a
com-mon fold that is unique to this enzyme class. P450s are mainlyβ-helical, with the heme cofactor sandwiched between a larger helix-rich (alpha) domain and a smallβ-sheet-rich (beta) domain. A core structure around the heme cofactor provides the scaffold that al-lows oxygen activation by the P450s. The heme iron is equatorially coordinated by four pyrrole nitrogens from the heme b macrocycle, and axially coordinated by a conserved cysteine as the proximal ligand and typically by a water molecule as the distal ligand (in the P450 resting state).
1.3.2 NADPH-cytochrome P450 reductase
As previously mentioned, for eukaryotic microsomal P450s, the membrane bound form of cytochrome P450 reductase (CPR) orchestrates the stepwise electron transfer from NADPH to the cytochrome P450 heme center168,173,174. NADPH-cytochrome P450 oxi-doreductase transfers electrons from NADPH to cytochrome P450 and catalyzes the one-electron reduction of many drugs and foreign compounds. CPR is a 78 kDa membrane anchored multidomain enzyme composed of a FMN-containing flavodoxin like domain associated with a FAD-containing ferrodoxin reductase like domain175 probably origi-nating from horizontal gene transfer or exon fusion. A folded connecting domain joins the two sections. By using its two flavin cofactors and a peculiar electron transfer cycle, CPR is able to split the dielectronic flux of NADPH by sequential electron transfer to external acceptors176.
1. INTRODUCTION 1.3. Cytochrome P450 based biosensors
Figure 1.11: Model of the conformational equilibrium in CPR177
.
1.3.3 Cytochrome P450 1A2
Human CYP1A2 is one of the major CYPs in human liver; it metabolizes a variety of clin-ically important drugs (e.g., clozapine, tacrine, tizanidine, and theophylline), a number of procarcinogens (e.g. benzo[a]pyrene and aflatoxin B1), and several important endoge-nous compounds (e.g. steroids and arachidonic acids). Like many other CYPs, CYP1A2 is subject to induction and inhibition by a number of compounds, which may provide an explanation for some drug interactions observed in clinical practice. A large inter-individual variability has been observed in the expression and activity and in the elimi-nation of drugs that are mainly metabolized by CYP1A2. This is largely caused by genetic (e.g., Single-nucleotide polymorphisms) and epigenetic (e.g., DNA methylation) and en-vironmental factors (e.g., smoking and comedication). CYP1A2 is primarily regulated by the aromatic hydrocarbon receptor (AhR). It is induced through AhR-mediated transacti-vation following ligand binding and nuclear translocation. To date, more than 15 variant alleles and a series of subvariants of the CYP1A2 gene have been identified and some of them have been associated with altered drug clearance and response to drug therapy180.
1.3.4 P450 based electrochemical Biosensors
Figure 1.12: The secondary and tertiary structure of human P450 1A2 is shown in two views. Theα-helices are colored blue, and theβ-strands are colored brown. These sec-ondary structure elements are designated A-L and 1-4, respectively, and are sequentially identified from the N terminus. The heme prosthetic group is represented in sticks and is colored red. The substrate binding cavity is illustrated as a red mesh surface.
from different viewpoints. On the one hand, the enzyme P450-electrodes are power tools for investigation of the catalytic properties of P450s towards new chemicals (i.e. for the search of new drugs with the properties of substrates or inhibitors). On the other hand, the stoichiometry of the P450’s catalytic cycle and the thermodynamics of electrochem-ical reduction of P450s can also be assessed. Additionally, electrochemistry can allow the investigation of the peroxide shunt pathway with the help of bifunctional electrodes, therefore permitting the direct registration of hydrogen peroxide consumption by the hemeprotein155.
1. INTRODUCTION 1.3. Cytochrome P450 based biosensors
human drug metabolizing P450 enzymes157: oxygen and NAD(P)H are largely used by these enzymes to produce hydrogen peroxide and superoxide anion radical or water.
The relevance of such an approach is obvious: cytochrome P450 and P450-based en-zyme electrodes may be used as biosensors in patient-tailored (personalized) medicine, high- throughput screening and drug interference studies.The biotechnological interest related to these enzymes in the development of biocatalysts or biosensors158-160 is due to their versatility in the recognition of a vast array of compounds, many of which are relevant to the development of fine chemicals, new drugs and drug products and even environmentally important compounds (detected or degraded through bioremediation). However, in spite of the huge biotechnological interest, their use in bioelectrochemical devices has proven to be highly challenging.
The progression of P450-electrode systems into amperometric biosensors is largely dependent on the efficiency of the electrode-driven P450 activity and therefore the im-mobilization. Which is why a large part of this work is centered on immobilization strategies. However, there are two technical difficulties in handling P450s based elec-trochemical biosensors. The first problem is the complexity in the measurement of their enzymatic activity.
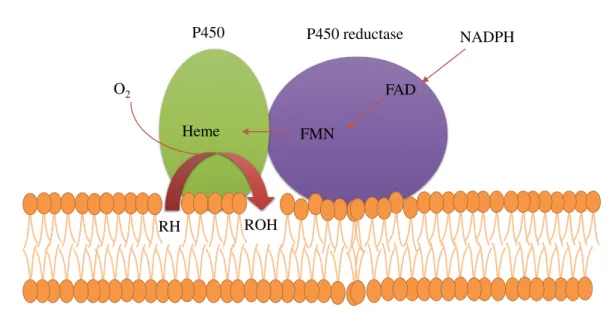
Most P450s need another redox protein as an electron donor for their activity be-sides the lipophilic substrate, O2 and NADPH or NADH. Pathways of electron transfer
to P450s are shown in Figure 1.10.
NADPH
FMN Heme
ROH RH
FAD O2
P450 P450 reductase
Figure 1.13: schematic representation of electron transfer in microsomal membrane. Elec-tron transfer from P450 reductase to P450 (adapted from Hara (2000).161).
through P450 reductase containing both FAD and FMN as shown in the upper part of this scheme.
Kinetic parameters such as Michaelis constant (KM) of the substrate highly depend on the microenvironment of the lipid membrane on which the P450 is bound. Both iso-lated P450 and P450 reductase should be coreconstituted into the same liposomes for expressing its full enzymatic activity.
The second problem is the stability of the enzyme. Many P450s, especially membrane-bound enzymes from microsomes or mitochondria are labile. Some can be partly stabi-lized in the presence of glycerol161.
The types of electrode modifications used in CYP biosensor studies vary, as shown in Table 1.6, ranging from thin films with opposite charge adsorbed onto graphite to conductive polymers deposited onto noble metals such as gold or platinum. Most of these studies rely on a combination of electrochemical and analytical techniques to show that the CYP biosensor is electroactive and can detect different drug compounds via electrochemically-driven catalysis. Nevertheless, a number of recent studies character-izing the active site structure and redox potential of CYPs immobilized on electrodes have shown that much of the CYP immobilized on the electrode is in an inactive form and call into question the results from previous CYP biosensor studies162-164.
33 | P a g e
Table 1-6 Summary of different electrode types and electrode modifications used to construct CYP electrodes and biosensors165.
CYP enzyme Electrode material Electrode modification Result Reference
Adsorption to bare electrodes
CYP101 (P450CAM) Edge-Plane Pyrolytic
Graphite
None Reversible peaks for FeIII/FeII seen in anaerobic CV
Increased reduction peak area in presence of D-(þ )-camphor
Kazlauskaite et al., 1996
CYP101 Mutant SCF-K344C
Gold None Enhanced electroactivity of the SCF-K344C mutant Lo et al., 1999
CYP2E1 Gold None Reversible peaks for FeIII/FeII seen in anaerobic CV,
ks=5 s-1
Fantuzzi et al., 2004
CYP199A2 Basal-Plane Pyrolytic
Graphite
None Quasi-reversible peaks for FeIII/FeII seen in anaerobic
CV, ks=550 s-1
Fleming et al., 2007
CYP101 Glassy Carbon None Increased reduction peak area in presence of D- (þ
)-camphor, ks=0.016 s-1
Mhaske et al., 2010
Layer-by-Layer Adsorption
CYP101 Gold Multilayer films of PSS and PDDA
on an MPS SAM
Reversible peaks for FeIII/FeII seen in anaerobic CV
Electrochemically-driven styrene epoxidation
(turnover 9.3 h-1)
Lvov et al., 1998
CYP3A4 Gold MPS SAM followed by PDDA Reversible peaks for FeIII/FeII seen in anaerobic CV
Electrochemical detection of the 3A4 substrates verapamil and midazolam
Joseph et al., 2003
CYP1A2 Carbon Cloth Alternate adsorption of PSS and 1A2 Reversible peaks for FeIII/FeII seen in anaerobic CV
Electrochemically-driven styrene epoxidation
(turnover 39 h-1)
Estavillo et al., 2003
CYP1A2 and CYP3A4 microsomes
Pyrolytic Graphite Multilayer films of PEI and PSS Reversible peaks for FeIII/FeII seen in anaerobic CV
Electrochemically-driven styrene epoxidation
Sultana et al., 2005
CYP1A2 and CYP2E1 Basal-Plane Pyrolytic
Graphite
Multilayer films of CYP and CPR/b5 Reversible reduction and oxidation peaks visible in anaerobic CV
34 | P a g e
Electrochemically-driven catalysis of NNK to HPB by 2E1 electrode
Adsorption to Thin Films
CYP101 Glassy Carbon Pretreated sodium montmorillonite
clay colloid
Reversible peaks for FeIII/FeII seen in anaerobic CV
Fast electron transfer (5 to 152 s-1 for scan rates of 0.4
to 12 V/s)
Lei et al.,2000
CYP2B4 Glassy Carbon Mixture of sodium montmorillonite
clay colloid, 2B4, and Tween 80
Reversible peaks for FeIII/FeII seen in anaerobic CV
Amperometric detection of the 2B4 substrates aminopyrine and benzphetamine
Shumyantseva etal., 2004
CYP101 Pyrolytic Graphite DDAB or DMPC Reversible peaks for FeIII/FeII seen in anaerobic CV
Relatively fast electron transfer with DDAB (ks=26 s
-1) and DMPC (k
s=25 s-1)
Zhang etal.,1997
CYP2C9, 2C18, and
2C19
Edge-Plane Pyrolytic
Graphite
DDAB Reversible peaks for FeIII/FeII seen in anaerobic CV
for all three enzymes Weak signal-to-background
current and only 1–3% of enzyme is electroactive
Shukla etal.,2005
CYP2C9 Edge-Plane Pyrolytic
Graphite
DDAB Reversible peaks for FeIII/FeII seen in anaerobic CV
Anodic shift in redox potential with 2C9 substrates torsemide, warfarin, and tolbutamide and with CO
Johnson etal.,2005
CYP27B1 Edge-Plane Pyrolytic
Graphite
DDAB Reversible peaks for FeIII/FeII seen in anaerobic CV
(ks=3.5 s-1)
Rhieu etal.,2009
No product formation observed during electrolysis with 27B1 substrate 25(OH)D3
CYP3A4 fusion protein Glassy Carbon PDDA Electrochemically-driven catalysis with the 3A4
substrate erythromycin
Dodhia etal.,2008
CYP101 Glassy Carbon Covalent attachment to thin film of
pyrene maleimide
Increased reduction peak area in the presence of D-(þ )-camphor
Mhaske etal.,2010