•
Joana Margarida Bendada Domingos
B.Sc in Applied Chemistry
Acidogenic digestion of effluents of the cheese industry
in packed bed biofilm reactors
Dissertation for the Master degree in Biotechnology
Supervisor: Fabio Fava, Professor, Università di Bologna
Co-Supervisor: Lorenzo Bertin, Assistant Professor, Universtià di Bologna
Jury:
President: Prof. Dr. Pedro Miguel Calado Simões
Examiner: Post-Doc Researcher Anouk Ferreira de Freitas Baptista Duque
Pascoal dos Santos Duque
Joana Margarida Bendada Domingos
B.Sc in Applied Chemistry
Acidogenic digestion of effluents of the cheese
industry in packed bed biofilm reactors
Dissertation for the Master degree in Biotechnology
Supervisor: Fabio Fava, Professor, Università di Bologna
Co-Supervisor: Lorenzo Bertin, Assistant Professor, Università di Bologna
September 2013
Jury:President: Prof. Dr. Pedro Miguel Calado Simões
Examiner: Post-Doc Researcher Anouk Ferreira de Freitas Baptista Duque
Pascoal dos Santos Duque
Título: Acidogenic digestion of effluents of the cheese industry in packed bed biofilm reactors
Copyright em nome de Joana Margarida Bendada Domingos, da FCT/UNL,
A Faculdade de Ciências e Tecnologia e a Universidade Nova de Lisboa têm o direito, perpétuo e
sem limites geográficos, de arquivar e publicar esta dissertação através de exemplares impressos
reproduzidos em papel ou de forma digital, ou por qualquer outro meio conhecido ou que venha a ser
inventado, e de a divulgar através de repositórios científicos e de admitir a sua cópia e distribuição
com objectivos educacionais ou de investigação, não comerciais, desde que seja dado crédito ao
Acknowledgments
I would like to express my very great appreciation to Professor Maria Ascensão Reis for provide
me the great opportunity to develop my thesis in Alma Mater Studiorum Università di Bologna in a
research group lead by Professor Fabio Fava, whom I would like to thank for receiving me so well.
An enormous thanks to my supervisor, prof. Lorenzo Bertin, for all the guidance given during the
experimental work. With it I could performed the various experiments described in this work.
I am grateful for all the help and good moments passed during this thesis provided by my Italian
colleagues Stefano Rebecchi, Matilde Monti and Andrea Negroni.
Also my ERASMUS friends: Catarina Vasconcelos, Sofia Pantaleão, Rita Agostinho and Catarina
Cardoso.
To my parents, Margarida Domingos and Manuel Domingos for all the effort economical and
emotional support offered during all the time I was in ERASMUS program. But I would like to thank
especially for patience and comprehension while I was at home writing the thesis, not giving them
sufficient attention.
I would like to offer my special thanks to Gonzalo Agustin Martinez who was with me during all
thesis process. With his vast knowledge, he gave me procedure advices and taught me many things
Resumo
O principal objectivo do presente trabalho foi o estudo de produção de ácidos gordos voláteis
(VFAs) num bioreactor de leito empacotado (PBBR) utilizando soro de leite liofilizado (CW) num
processo acidogénico.
Os primeiros ensaios foram realizados em frascos Pyrex de 100 mL de forma a realizar o estudo
dos perfis do processo acidogénico, nomeadamente, consumo de lactose, produção de VFAs bem
como de biogás e sua composição. Estes ensaios foram realizados com células em suspensão
(controlo experimental) e com células imobilizadas utilizando como suportes carvão activado granular
(AC) e cubos de cerâmica Vukopor S10. O inoculo utilizado – uma cultura mista acidogénica –
pertence a um processo de digestão análogo em que um sistema de cultura diferente tem vindo a ser
estudado. Assim, as condições de incubação foram as mesmas utilizadas nesse sistema de cultura:
20 g/L de CWP (que corresponde a 15 g/L de lactose), 37ºC e pH 6. Observou-se que o processo
consistia no consumo de lactose, formação de ácido láctico (produto intermediário) e a através deste
a produção de VFAs. O melhor rendimento foi obtido quando Vukopor foi utilizado (87% contra 30%
no AC). Após de 9 dias de batch a composição em VFAs era (g/L) ácidos acético (1.6), propiónico
(2.4); butírico (6.6).
Os estudos preliminares mencionados permitiram a selecção do tempo de retenção hidráulico
(HRT) a ser operados nos bioreactores.
Dois PBBR de 1 L, um empacotado com Vukopor e outro com AC, foram desenvolvidos. A
concentração de CWP, pH e temperatura foram as mesmas utilizadas nos ensaios em pequena
escala. Ambos foram operados em batch e continuo. No primeiro batch realizado no PBBR-Vuko
atingiu-se uma produção de 6 g/L de ácido propiónico. No entanto, a perda de capacidade de
produção deste ácido foi observada durante a operação em continuo. Esta perda foi atribuída a um
wash-out do microrganismo responsável pela produção. Com PBBR-Vuko foram testados dois HRT, 9 e 6 dias, enquanto que com PBBR-AC apenas um de 9 dias. Os rendimentos obtidos em PBBR-Vuko
foram semelhantes aos obtidos anteriormente em menor escala, 80% para os diferentes HRT. Por
outro lado, o rendimento PBBR-AC foi de apenas 20%. Este valor é a confirmação de que AC não é
um suporte de imobilização adequado nem mesmo em escala de 1L.
Adicionalmente ao estudo de imobilização, foi ainda operado um reactor sem imobilização. Neste
último, ao ser operado com HRT de 6 dias o rendimento, em VFAs, diminuiu para 44%.
Conclui-se então que o método de imobilização com material de cerâmica é uma vantagem para
a produção de VFAs.
Termos chave: Ácidos gordos voláteis, cultura mista acidogénica, reactor de leito empacotado, soro
Abstract
The main goal of the present work was to study the production of volatile fatty acids (VFAs) from
cheese whey powder (CWP) by employing a packed bed bioreactor (PPBR) for the anaerobic
acidogenesis.
First experiments were performed in 100-mL Pyrex bottles to study the acidogenesis trends,
namely: lactose consumption, VFAs and biogas production and composition. These tests were done
with freely suspended-cells (control experiment) and with immobilized cells using granular activated
carbon (AC) and ceramic cube Vukopor S10 supports. The utilized inoculum – an acidogenic mix
consortium- belongs to an analogous CWP digestion process in which a different culture system is
being studied. Therefore, the incubations conditions were the same as for that culture system: 20 g/L
of CWP (corresponding to 15 g/L lactose), 37ºC and pH 6. The observed trend consisted on lactose
consumption, lactic acid formation (as an intermediate product) and from this VFAs production. The
best yield was obtained when Vukopor was used (87% against 30% for AC); after 9 days the VFAs
was (g/L): acetic (1.6), propionic (2.4); butyric (6.6) acids.
The mentioned preliminary studies allowed selecting the operational hydraulic retention time
(HRT) for the bioreactors.
Two recirculate 1-liter PBBR one filled with Vukopor and other with AC were developed. CWP
concentration, pH and temperature were the same as in the microcosm experiment. Both were
operated in batch and continuous. In first batch performed in PBBR-Vuko it was achieved 6 g/L of
propionic. However a loss of capability of producing it was observed during continuous operation. It
was ascribed to a wash-out of related strains. With PBBR-Vuko were tested two different hydraulic
retention times (HRT), 9 and 6 days, instead for AC only HRT of 9 days. The yields for
PBBR-Vuko were the same as at the microcosms scale, 80% for both HRT. On the other hand, the yield for
PBBR-AC was 20%, this is a confirmation that AC was not the proper support even at a 1-L scale.
Additionally to immobilization study, it was also set up a bioreactor with freely suspended cells. In
this last mentioned bioreactor when a HRT of 6 days was set up it was observed a decrease in the
VFAs yield to 44%. From this, it was concluded that the immobilization is an advantage for the VFAs
production.
Keywords: Acidogenic mixed culture, Ceramic support,Cheese Whey, Packed-bed bioreactor, Volatile
Fatty Acids
General Index
ACKNOWLEDGMENTS ... I
RESUMO ... III
ABSTRACT ... V
FIGURES INDEX ... IX
TABLES INDEX ... XI
ABBREVIATIONS ... XIII
1 INTRODUCTION ... 1
1.1 CW AND ITS CHARACTERIZATION ... 5
1.2 BIOLOGICAL TREATMENT OF CW WITH VALORIZATION ... 6
1.3 VFAS AND ITS APPLICATIONS ... 8
1.4 IMMOBILIZATION ... 9
2 GOALS ... 11
3 MATERIAL AND METHODS ... 15
3.1 MATERIALS ... 17
3.1.1 Inoculum and culture media ... 17
3.1.2 Immobilization material ... 17
3.2 EXPERIMENTS SET-UP ... 18
3.2.1 Batch trials at microcosm scale ... 18
3.2.1.1 Freely suspended cells study ... 19
3.2.1.2 Batch trials at microcosm scale: immobilization supports study ... 19
3.2.1.2.1 Experiment 2 - Preliminary immobilization supports study ... 20
3.2.1.2.2 Experiment 3 - Improved immobilization supports study ... 20
3.2.1.3 Experiment 4 - Batch production for consortia characterization ... 21
3.2.2 Continuous process ... 22
3.3 ANALYTICAL METHODS ... 24
3.3.1 Liquid analysis ... 24
3.3.2 Biogas analysis ... 24
3.3.3 Microbiological features of Vukopor-attached-cells analysis ... 26
4 RESULTS ... 27
4.1 BATCH TRIALS AT MICROCOSM SCALE ... 29
4.1.1 Freely suspended cells study ... 29
4.1.2 Immobilization supports study ... 30
4.1.2.1 Experiment 2 - Preliminary Immobilization supports test ... 31
4.1.2.2 Experiment 3 - Improved immobilization support test ... 33
4.1.3 Experiment 4 - Batch production for consortia characterization ... 37
4.1.4 Experiment 5 - VFAs production with different initial substrate concentration ... 40
4.2 BIOREACTORS ... 41
4.2.2 PBBR-AC ... 50
4.2.3 Freely suspended cells ... 51
4.3 RESULTS RESUME FOR CERAMIC MATERIAL AND FREELY SUSPENDED CELLS ... 53
4.4 VFAS MIXTURE OBTAINED IN BATCH EXPERIMENTS AND BIOREACTOR WITH CERAMIC MATERIAL AND FREELY SUSPENDED CELLS ... 53
5 DISCUSSION ... 57
5.1 MICROCOSM EXPERIMENT EMPLOYING FREELY SUSPENDED CELLS ... 59
5.2 MICROCOSM EXPERIMENTS EMPLOYING VUKOPOR S10 AS SUPPORT MATERIAL ... 60
5.3 CONSORTIA CHARACTERIZATION ... 61
5.4 MICROCOSM EXPERIMENTS EMPLOYING GRANULAR ACTIVATED CARBON AS SUPPORT MATERIAL .... 61
5.5 PACKED BED BIOREACTORS ... 62
5.6 FREELY SUSPENDED CELLS BIOREACTOR ... 65
6 CONCLUSIONS ... 67
7 FUTURE WORK ... 71
8 PUBLICATIONS ... 75
9 BIBLIOGRAPHY ... 79
Figures Index
Figure 1.1. Cheese production registered in World and Europe in the last 10 years ... 3
Figure 1.2. Milk-Production share by type of milk-derivate product in the world ... 3
Figure 1.3. Contribution of each continent for the production of cheese ... 3
Figure 1.4. An example scheme of wastes valorization ... 4
Figure 1.5.Scheme representing the different possible pathways during anaerobic digestion. ... 6
Figure 1.6 Scheme of two types of immobilization ... 10
Figure 3.1. Immobilization supports used during the experiments ... 18
Figure 3.2. Microcosms preparation ... 21
Figure 3.3. Pictures of the three bioreactors ... 23
Figure 3.4. Scheme in which is represent a PBBR connected to the “Mariotte” system ... 25
Figure 4.1. Concentration profiles of main monitored compounds during microcosm experiment with freely suspended cells ... 30
Figure 4.2. Concentration profiles of main monitored compounds during experiment 2 with Vukopor . 32
Figure 4.3. Concentration profiles of main monitored compounds during experiment 2 with AC ... 33
Figure 4.4. Concentration profiles of main monitored compounds during experiment 3 with Vukopor . 34
Figure 4.5: Concentration profiles of main monitored compounds during VFAs accumulation batch in experiment 3 with Vukopor ... 35
Figure 4.6. pH values obtained during experiment 3 ... 35
Figure 4.7. Concentration profiles of main monitored compounds during experiment 3 with AC ... 36
Figure 4.8. Concentration profiles of main monitored compounds during experiment 4 ... 37
Figure 4.9. Concentration profiles of main monitored compounds during VFAs accumulation batch in experiment 4 ... 38
Figure 4.10. DGGE analysis of the bacterial communities that compose the biofilm attached to the ceramic material at different time in experiment 4 ... 39
Figure 4.11. Concentration profiles of main monitored compounds during experiment 5 ... 41
Figure 4.12. Concentration profiles of main monitored compounds during the first batch performed in PBBR-Vuko. ... 42
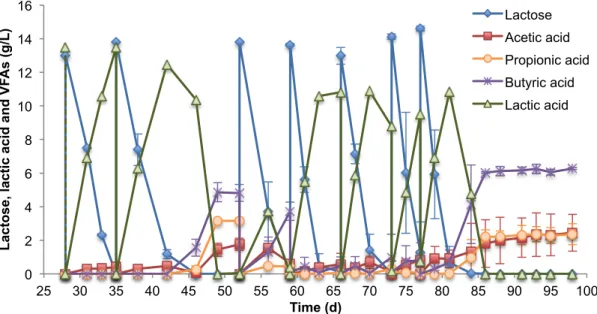
Figure 4.13. VFAs profile obtained during PBBR-Vuko operation with HRT 9 days. ... 43
Figure 4.14. Concentration of lactose, lactic acid and mainly VFAs during 10 days of 2nd and 3rd batches performed in PBBR-Vuko. ... 44
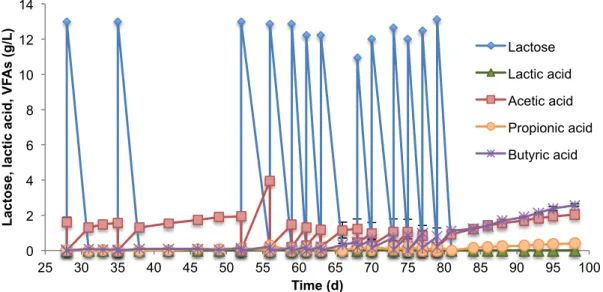
Figure 4.15. Concentration profiles of main monitored compounds during PBBR-Vuko operation with HRT 6 days ... 45
Figure 4.16. Overall COD values CWP solution (in) and outlet (out) in PBBR-Vuko as a function of time during steady state when operated with HRT of 6 days. ... 46
Figure 4.17. Total protein content in CWP solution (in) and outlet (out) in PBBR-Vuko as a function of time during steady state when operated with HRT of 6 days ... 49
Figure 4.19. Concentration profiles of main monitored compounds during freely suspended cells
bioreactor operated with HRT 6 days ... 52
Figure 4.20. VFAs mixture composition in %(gVFA/gTotalVFAs) obtained in experiment 2 ... 53
Figure 4.21. VFAs mixture composition in %(gVFA/gTotalVFAs) obtained in VFAs accumulation batch
in experiment 3. ... 54
Figure 4.22. VFAs mixture composition in %(gVFA/gTotalVFAs) obtained in experiment 1 ... 54
Tables Index
Table 1.1. General characterization of CW 5
Table 3.1. Cheese Whey Powder characterisation. All these values were provide by Lactogal 17
Table 3.2. Volumes determined for microcosm preparation as the final volumes added. 20
Table 3.3. Volumes determined for 1 L Pyrex bottles preparation and final volumes of CWP solution
and incolum added. 22
Table 3.4. Stages in which PBBR-Vuko was operated with respective time as also the inoculation. 23
Table 4.1. Dice coefficient obtained from previous DGGE profile 39
Table 4.2. Results obtained during PBBR-Vuko operation 50
Table 4.3. Results from acidogenic fermentation in microcosm experiments and bioreactors with
Abbreviations
% w/w CWP – percentage mass of compound per mass of cheese whey powder
COD – chemical oxygen demand
CODin - COD content in CWP solution feed
CODout - COD content in bioreactor outlet
𝐶𝑂𝐷!"!"!"!"#$#"$ - COD content in inlet supernatant
𝐶𝑂𝐷!"#!"!"!"#$#"$ – COD content in outlet supernatant
𝐶𝑂𝐷!"!"# - COD content in inlet mixture
𝐶𝑂𝐷!"#!"# - COD content in outlet mixture
CO2 – Dioxide Carbon
CW – Cheese whey
CWP – Cheese whey powder
GC – Gas chromatograph
H2 – Hydrogen
HPLC - high-performance liquid chromatography
HRT – Hydraulic retention time
in mix – inlet mixture
in supernatant - inlet supernatant
YVFAs % (C-mol/C-mol) – yield of volatile fay acids respecting to lactose
FID - Flame Ionization Detector
MBR – Membrane Bioreactor
msupport – mass of support NaOH – Sodium hydroxide
out mix – outlet mixture
out supernatant - outlet supernatant of bioreactor
PBBR - packed bed bioreactor
PBBR-AC – packed-bed Bioreactor packed with granular activated carbon
PBBR-Vuko – packed-bed Bioreactor packed with Vukopor S10
PHA – pollyhydroxyalcanoates
µGC – micro-GC
VFAs – Volatile Fatty Acids
Dairy industry is practised all over the world for the production of milk, butter, yogurt, ice cream,
cheese, and other milk derivate. From this activity big amounts of high COD content waste are
generated as effluents. With fast growth of human population and a respond to the nutrition needing
brings to and increase of milk derivate production in the last years (Fig. 1.1). Cheese is the milk
derivate most produced around the world (Fig. 1.2) and is in Europe where is observed the greatest
production of cheese, representing 57% of world production.
Figure 1.1. Cheese production registered in World and Europe in the last 10 years [data from FAO].
Figure 1.2. Milk-Production share by type of milk-derivate product in the world [data from FAO].
Figure 1.3. Contribution of each continent for the production of cheese [data from FAO]. Africa, 3,96% America, 29,78% Asia, 6,27% Europe, 57,15% Oceania, 2,84% Butter 42,5% Cheese 57,4% Yogurt 0,2%
y = 1,30E+05x - 2,51E+08 y = 3,49E+05x - 6,81E+08
0 5 10 15 20 25
2000 2002 2004 2006 2008 2010 2012
Of all wastes resulted from the dairy industry, cheese whey (CW) is the major and most
contaminated waste generated in the cheese production. As rule of thumb it can be said that for
production of 1 kg of cheese 10 kg of milk are used and 9 kg of CW are obtained as by-product
[Prazeres et al., 2012]. From this, 92 M tons of cheese whey are generated per year in Europe [FAO]
since 10 M tons of cheese are produced on an annual base.
Since CW is harmful for the environment it must be treated before being discharged in the
ecosystems. Otherwise it would cause serious pollution problems for the surrounding environments.
CW can cause an excess of oxygen depletion, reducing aquatic life, impermeabilization, decreasing
crop yield, eutrophication, toxicity, etc. in the receiving environments. With a high COD content and
hard biodegradability of lipids and proteins, a small variation on the content of these in the effluent
can generate problems in a conventional treatment plant. From this it is difficult or almost impossible
to treat it with other wastes. Therefore, instead of doing and investment on a conventional biological
treatment without valorization, the situation could be interpreted as an opportunity to implement a
technology with which the by-products are valorised by the production of added values [Kosseva et
al., 2009]. In other words, this is the situation for applying the bio-refinery concept: maximization of
each stream value. In this way, one option for valorising the effluent is the anaerobic fermentation. In this process, microbial consortiums promote bioconversion of dissolved organic compounds present
in the waste, like lactose, into valuable compounds; i.e: acetic, propionic, butyric, lactic, etc. These
last so called Volatile Fatty Acids (VFAs) are by there on fine chemicals and also can be the
substrates for others microbial conversions: methane, PHAs [Albuquerque et al., 2011; Bengtsson et
al., 2010] among others.
1.1 CW and its characterization
Cheese industry generates three types of effluents: CW which is the result of cheese production,
from cottage cheese production results second CW and from washing water that contains different
fractions of CW and/or second CW generates CW wastewater. The CW effluent can be in several
forms: raw, diluted, pasteurized, deproteinized, powder, etc. [Prazeres et al., 2012]. Cheese whey
powder (CWP) consists in CW lyophilized and despite lyophilization costs, this way of CWP is easily
storage and transported since has a reduced volume and long-term stability [Kargi and Ozmihi, 2006].
CW characteristics depend on the milk used, which varies with: animal source (goat, cow, sheep
and buffalo) and state (animal breed, feed, health and lactation station. It also depends on the
process technic to remove the casein protein, present in the milk composition. However, in general
terms it can be said that is a green, due to riboflavin (vitamin B2) content, yellowish liquid resulting
from the precipitation and removal of milk casein in cheese production process [Prazeres et al., 2012].
In the following table (Table 1.1) is represented the range of values of CW composition. However, it is
mainly composed by lactose, proteins (β-lactoglobulin (50%), α-lactalbumun (12%), immunoglobulins
(10%), serum albumin (5%) and proteose peptones (0.23%), lipids and minerals. [Siso et al.,1996].
pH of CW depends on the procedure used for precipitation of casein protein. An acidic CW has a
pH<5 and have a lower protein content while sweet CW has a pH 6-7 [Prazeres et al., 2012].
Table 1.1. General characterization of CW [Prazeres et al., 2012]
Compound Range of values
Lactose 39-60 kg/m3
Minerals 0.46-10%
Total Suspended Solids 0.1-22 kg/m3
pH 3.3-9.0
Phosphorus 0.006-0.5 kg/m3
Total Kjeldahl Nitrogen 0.01-1.7 kg/m3
Organic load 0.6-102 kg/m3
COD 50-102 kg/m3
From previous statements it is obvious that CW must be treated before being discharged to the
environment. For minimize the negative effects of CW discharge an alternative was promote the
dilution with other wastewater, considered less polluted, like domestic wastewater [Gannoun et al.,
2008]. There are several techniques to treat it like aerobic digestion. But, because of its high COD
content, the implementation of a conventional sewage treatment plants is difficult; requiring in most
cases a separated treatment plant.
Instead of doing and investment on a conventional biological treatment without valorization, the
situation could be interpreted as an opportunity to implement a technology with which the by-products
are valorised by the production of added values [Kosseva et al., 2009]. In another words the situation
for applying the bio-refinery concept: maximization of each stream value.
1.2 Biological treatment of CW with valorization
Anaerobic digestion is a collection of processes by which microorganisms convert biodegradable
compounds in the absence of oxygen. In Figure 1.5 is represented the different pathways which
compose this complex process. After hydrolysis of organic polymers such as carbohydrates, during
acidogenesis, acidogenic bacteria convert organic matter as sugars and amino acids into dioxide
carbon, alcohol and organic acids [Horiuchi et al., 2002; Itoh et al., 2012]. The last step is
methanogeses in which organic acids are convert to methane and carbon dioxide.
The mentioned processes can be carried out by the implementation of a pure or mixed culture.
The advantage, of a pure culture, is the high productivity achieved. In other hand, when a mixed
culture is employed costs with energy are save due to no sterilization needs. These culture are
composed by many different members of bacteria giving it robustness to support feed variations and
synergies effect when extra supplements are needed [Agler et al., 2011].
In which respect to anaerobic digestion of cheese whey is normally carried out at mesophilic
conditions (25-38ºC). During this process lactose is bioconvert to lactic acid, VFAs, ethanol, among
others. From proteins polypeptide, aminoacids and ammonia are produced. CW has a low quantity of
proteins but a high content of lactose. This last is characterized as a disaccharide sugar derived from
condensation of galactose and glucose.
Microorganisms species know which are able to metabolize lactose are notably less then
microorganisms able to perform the conversion of other simple sugars like glucose [Siso, 1996]. In the
first group is, for example, K. marxianus specie of yeast capable to produce lactase enzyme and from
it use lactose to produce ethanol. Ethanol production has been already reported in several studies in
which were used diverse types of CW: raw CW [Zafar and Owais, 2006], CWP solution [Kargi and
Ozmihci, 2006], CW permeate from ultrafiltration [Domingues et al., 1999] and even CW
deproteinized [Dragone et al., 2011]. However, from all of these studies it was seen that ethanol
production using CW as substrate is not economically competitive respecting to when other wastes
like cane sugar or cornstarch and also, when lactose is used as substrate, the HRT decreases from
days to hours when the processes is aerobic instead of anaerobic. Biogas production is another
possibility for valorization of CW with anaerobic digestion. Hydrogen is a clean energy and the
production from wastes, like CW, is an economical viable option to produce it. After hydrogen
production, the effluent generated has a significant COD vlaue since is manly composed by VFAs,
alcohols and carbohydrates not being possible to be discharge without an adequate treatment
[Prazeres et al. 2012]. Thus, those compounds can be used in other fermentations and this way, after
CW valorization, also hydrogen effluent is valorize.
There are also some works in the literature which report some species able to bioconvert the
lactose content in CW into lactic acid either as mixed cultures [Plessas et al. 2008] as pure cultures
[Arasaratnam et al., 1996; Vasala et al., 2005]. Lactic acid is a carboxylic acid with pKa value of 3.86,
one unit less than acetic acid (4.75) and it is involved in several biochemical reactions and can be
used in food or pharmaceutical industry [Plessas et al., 2008]. Besides lactic acid, also VFAs
production from CW has been study [Bengtsson et al., 2008]. VFAs represent a group of carboxylic
acids with perspectives for production of another add-value products.
A possible drawback, of production of add-value products from CW, is being a nutrient deficient
and so, supplementation is needed to avoid slow microorganisms growth. It was observed that with
nutrient supplementation or used of mixed cultures the lactic acid productivity increased significantly
[Prazeres et al., 2012]. Bioreactor configuration can also contribute for increasing the productivity, for
example the employ of immobilization. Few experiences about CW anaerobic acidogenic digestion for
the production of ethanol and lactic acid with immobilized cells by employing a membrane-based cell
recycle or fibrous-bed reactors were already described [Kosseva et al., 2009]. However, almost no
experiments for VFAs production with immobilization in a packed-bed reactor, from CW, have been
1.3 VFAs and its applications
As it was said before, with the continuous population growth an increase of alimentary production
is needed. Because of that, the waste generated also increase representing a threat to the
environment. However some wastes are composed by sugars with potential for valorization like
glucose and xylose present in sugarcane bagasse [Zhu et al., 2012] or lactose that compose the CW.
Microbial consortiums use those sources of energy to perform the conversion into other compounds,
for example, VFAs.
VFAs are fatty acids with a carbon chain of six or less carbon atoms, which can be distillate at
atmospheric pressure [Lee et al., 2013]. Acetic acid (C2H4O2), propionic acid (C3H6O2), isobutyric and
butyric acids (C4H8O2), isovaleric and valeric acids (C5H10O2), isocaproic and caproic (C6H12O2) acids
are the molecules that compose the VFAs group. Actually the production of these compounds are by
employing chemical processes and using non-renewable petrochemicals as raw materials [Lee et al.,
2013]. In the last years “green technologies” have been studied intensely in order to be economical
and environmental feasible in large-scale activity avoiding the use of non-renewable resources.
Biological production of VFAs is an anaerobic process with conversion of sugars by microorganisms.
From those mentioned VFAs not all have the same application interest. During the fermentative
process the operational parameters like pH, temperature, HRT or organic load, can influence the
quality, quantity and yield of VFAs produced [Lee et al., 2013]. So, in order to favour the production
into the most interest VFAs the process must be carefully controlled.
The optimal pH for VFAs production is usually in range 5.25-11 since in very acidic (pH 3) or
alkaline (pH 12) values, acidogenesis cannot survive [Lee et al., 2013]. There are some studies about
the influence of pH values in type of VFAs produced [Horiuchi et al., 2002; Bengtsson et al., 2008].
When CW is used it was observed that working with pH between 5.25 and 6 propionic increased its
production while acetic and butyric acids decreased [Bengstonn et al., 2008]. Yet it was also observed
higher production of propionic and acetic acids, respecting to butyric acid, when pH was increased
from 6 to 8 but when a waste rich in glucose was use as substrate [Lee et al., 2013]. From all these,
and others, researches it suggests that the optimal pH for a production of particular VFA depends
also on the kind of waste used.
Another parameters with a huge impact in VFAs production is the HRT. Bengtsson and co-works
[Bengtsson et al., 2008] performed an interesting study in which compared the influence of HRT by
using two different wastewaters: CW and paper mill effluent. The increment in amount of propionic
acid was obtained when HRT was increased from 20 h to 65 h when CW was substrate while in the
case of paper mill effluent this increment was observed when the HRT was increasing from 10 to 20h.
However in both cases when propionic acid increments its concentration, butyric acid decreased in
the same proportions. This shift observed between butyric and propionic is a competition of those
types of fermentations: butyrate type fermentation resulting in acetate and butyrate as main products
and propionate type fermentation with acetate and propionate production [Cohen et al., 1984].
VFAs are compounds used as substrate in diversity applications (Figure. 1.4) being
biologically [Albuquerque et al., 2011]. Numerous bacterial species produce these biodegradable
polymers as intracellular carbon and energy reserves from renewable resources such as VFAs. PHAs
have chemical and physical proprieties similar to conventional plastics but its biodegradable
characteristic makes them a promising green alternative to the conventional plastics, which used
petrochemical products as raw material Despite of industrial PHA production is already a realty
[Fradinho et al., 2013] is still limited by the high production cost. High cost is related with carbon
substrate, which represents 31% of the total process cost [Lee et al., 2013]. From this, VFAs
produced from low-value substrates as dairy or paper wastewaters [Bengtsson et al., 2008] have
been contribute to decrease cost of PHAs production.
The composition and proprieties of PHA is depended on type of VFAs which it has resulted.
Acetic and butyric acids favour the production of 3-hydroxybutyrate (3HB) whereas propionic and
valeric acids promote the synthesis of 3-hydroxyvalerate (3HV). Since some PHAs are too rigid, as
Poly(3-hydroxybutyrate), the combination between polymers is an advantage. The incorporation of
3HV into P(3HB) leads to the formation of copolymer P(3HB-co-3HV) which is more stretchy and
tougher. Besides is less permeable to oxygen as compared to the commercial polyethylene and
polypropylene, making it a suitable food packing material [Lemos et al., 2006].
Those are the motives why is so important to control the operation parameters, during acidogenic
digestion, in order to obtain the VFAs with most industry interest.
1.4 Immobilization
The immobilization of enzymes, animal cells or microorganisms, is a strategy used in several
bioprocess. Is defined as “the enzymes/microbial cells physically confined or localised in a certain
defined region of space with retention of their catalytic activities, and which can be used repeatedly and continuously”. Nevertheless, in general, the objective of this practise is to promote the using of the cells for longer periods in continuous process. When is performed physically it calls entrapment,
otherwise is attachment (Figure 1.6). Calcium alginate or membranes are the materials usually used
for a physically immobilization. Since the cells are physically trapped in a matrix this method is
employed in most of the times due to its facility performing spherical particles by dripping a
polymer-cell suspension into a medium containing precipitate-forming counter ions or though thermal
polymerisation. This method is suitable particularly for processes that the substrate is inhibitory since
the cells are not in contact direct with the environment. A limitation can be the mass-transfer which
effect negatively the speed of reactions promoting decrease in the velocity. Instead, attachment
consists cells bound, forming the biofilm. Biofilm is defined as colonies of microbial cells encased in a
porous matrix or attached to a surface with the polysaccharides segregated by the microorganisms
[Brock]. Because of that, the huge advantage is the fact that is simple to carry out since only depends
on microorganisms activity and the conformation applied to the bacterial consortium has few
related to the fact that binding forces, between the microorganisms and the surface, can be weak
[Kosseva et al., 2009].
Figure 1.6 Scheme of two types of immobilization. On the left is represented adsorption - some cells are attached to a surface. On the right entrapment – the cells are physically inside of a material [Kosseva et al., 2009].
Despite all these referenced differences, in general, the immobilization method has several
advantages respecting to suspended culture processes. The principal is the fact that it prevents the
culture washout when continuous process is employed due to a higher cell density as well as its
robustness formed by the consortium [Keskin et al., 2012]. With this stronger culture is also possible
to work with lower hydraulic retention times (HRT). Another advantage is an easier downstream
process since, during the bioconversion the mostly of the cells are separated from the liquid.
From all of this a several supports can be employed in a packed-bed bioreactor (PBBR), which
the most common are porous materials composed by silica, ceramic or activated carbon.
Vukopor® S, produced by Igor-Lanik – Techservis Boskovic company, is a three-dimensional cube
structure composed by a ceramic matrix and formed by interconnected system cells. This material,
due to its ability to increase the degree of purity of the metals, is generally used in foundry industry for
filter of molten material like iron, bronze or brass. Is characterized for having thermal conductivity,
stability and resistance to sudden temperature changes. The ceramic structure is composed by high
quality material of Silicon carbide (SiC) and Aluminium oxide (Al2O3) which gives an excellent stability
at temperatures until 145°C [Igor-Lanik – Techservis Boskovic].
Activated Carbon (AC) is composed by microcrystals of graphite randomly arrange with an
unclogged pours. There are some forms of AC: powder, granular (GAC), cloths, fibbers and felts
[Da˛browski et al., 2005]. Its surface is nonpolar giving it an enormous capability of adsorption for
organic compounds with a low molecular weight like VFAs or phenols. Furthermore is widely used in
industry, for be a low-cost material being applied as organic acids recovery, phenols removal or even
to absorb compounds, like lactic acid, which inhibits fermentative processes [Gao et al., 2011].
Besides its absorbent capacity of interest fermentation products, like VFAs, those compounds can be
The main goal of this thesis was the production of VFAs from CWP by employing a packed bed
bioreactor, in which an acidogenic mixed culture was employed to bio-convert the lactose present in
the CWP to produce these VFAs. In order to compare two different packing materials, and the
influence of such a parameter in VFAs profile production, a ceramic material, Vukopor S10, and an
activated carbon were employed in the formation of the reactor packed beds.
The present work was divided in two parts:
- Experiments carried out at a micro-scale, by developing microcosms prepared in
100mL-Pyrex bottles, for both immobilizing materials. This first approach was dedicated to study
operational parameters to be used in the next step.
- Experiments carried out with two lab-scale (about 1 L of empty volume) PBBR, which were
packed with Vukopor S10 and with Granular Activated Carbon, respectively, and which were
operated by applying parameters values determined during microcosm experiments.
Furthermore, a freely suspended cells bioreactor was also set up and used to compare the
performance of freely suspended microorganisms, so to understand the role of the
immobilization material during anaerobic acidogenic process using CWP as substrate.
Although the metabolic capability of the employed acidogenic mixed culture of biocoverting
cheese whey into VFAs was already known, since the same culture was collected from a membrane
bioreactor (MBR) employed for the same aim, the process configuration could significantly influence
the microorganisms behaviour and thus the effluent features, mainly in terms of VFA relative
concentration. In this respect, microcosm experiments were considered a determinant step to study
the immobilized cell process parameters, especially HRT, to be employed in the PBBRs.
VFAs produced should be use as substrate for other processes, like PHA production. Due to the
different characteristics and composition of VFAs some have more applicability than others. Propionic
acid is one of the VFAs with more perspective in PHA industry and because of that along the
3.1 Materials
3.1.1 Inoculum and culture media
The inoculum used in the present work was an acidogenic mixed culture recovered from a
membrane bioreactor (MBR) that was also producing VFAs from CWP (20 g/L) in a continuous
production process at 37ºC. A concentrated sample of the consortia was cultured in a 500 mL-Pyrex
bottle in order to generate enough active biomass for all experiments. The culture started by
inoculating the culture media - consisting on 20 g/L of CWP as in the MBR - at 10% of the working
volume 200 mL. It was maintained in the incubator at 37ºC (as in MBR) stirring 150 rpm and sampled
every 2-3 days, as described in (see 3.2.1). In order to maintain the inoculum in activity, culture broth
was changed on a week basis by centrifugation at 7,500 rpm and pellet suspension in 200 mL of a
new culture media. In this way, lactose was added when it was exhausted.
The CWP used during the work was kindly provided by Lactogal1 - Portugal. All experiments,
except where mentioned, were done with the same culture media: a CWP solution (20 g/L) prepared
with distilled water, corresponding to 15 g/L of lactose. Lactose quantity was decided in base of the
quantity of lactose content in this CW before lyophilisation, which is 15 g/L. Since during lyophilisation
process all the water is removed, all components became more concentrated. Knowing the
characterization of the powder is possible to add more or less water according to final lactose
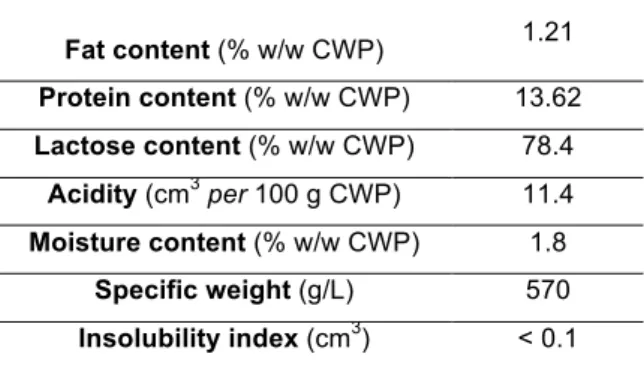
concentration desired. The characterisation of CWP, provide by Lactogal, can be consulted in Table
3.1.
Table 3.1. Cheese Whey Powder characterisation. All these values were provide by Lactogal
Fat content (% w/w CWP) 1.21
Protein content (% w/w CWP) 13.62
Lactose content (% w/w CWP) 78.4
Acidity (cm3per 100 g CWP) 11.4
Moisture content (% w/w CWP) 1.8
Specific weight (g/L) 570
Insolubility index (cm3) < 0.1
3.1.2 Immobilization material
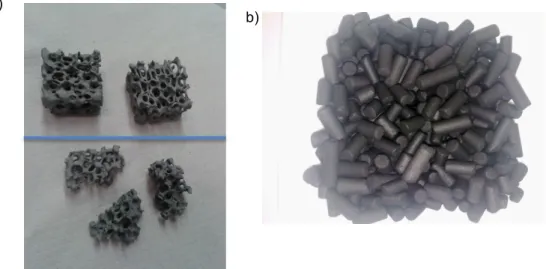
During the work, two different packing materials were study: Ceramic Cubes (Vukopor S10
product, Lanik, Boskovice, CZ) (Figure 3.1 a) ) whose dimensions, porosity and density were 25 x 25
x 18 mm, 10 ppi and 2.38 g/mL, respectively; and Granular Activated Carbon (CP4-60 product,
Chemviron Carbon, Feluy, Belgium) (Figure 3.1 b) ), consisting of cylinders of about 3 mm diameter
and 10 mm length, whose density was 1.32 g/mL.
For the preliminary tests, which were carried out in microcosms Vukopor S10 supports were used
in a smaller size, than that described before (Figure 3.1 a) ). The original ceramic cubes were broken
into a size sufficient enough to fit them inside the bottle. During the breaking step the weight and
similarity shape between the pieces were took into consideration, in order to get supports with similar
dimensions. In the case of the experiment with 1 L bottle the employed ceramic material was the
original one, which was broke in half.
Figure 3.1. Immobilization supports used during the experiments. a) Comparison of size and shape between the
supports used to pack the PBBR-Vuko (a.1) and the supports used in the microcosm experiments with
immobilization (a.2). b) Granular Activated Carbon used as immobilizing support during the work, either
PBBR-AC as microcosm experiments.
3.2 Experiments set-up
3.2.1 Batch trials at microcosm scale
The experiments were carried out in 100-mL Pyrex bottles (55 mL of working volume) equipped
with two stacked silicone stoppers (thickness 2.5 mm each) tightly closed to the bottleneck through a
modified Pyrex-cap to allow gas sampling. Cultures were started by inoculating with a 10% of the
working volume. Incubation conditions were 37°C and 150 rpm. Sampling for biogas and metabolites
production measurements were made every 2-3 days. After biogas sampling (see 3.3.2), the bottles
were opened under nitrogen gas sparging, to keep anaerobiose and 1 mL of liquid phase was taken
for analysing lactose, lactic acid and VFAs concentrations. Thereafter, pH was controlled and
corrected to 6 by adding some drops of NaOH 10 M solution. a)
3.2.1.1 Freely suspended cells study
Microcosms with freely suspended cells were performed in order to study the bioconversion
trends. This is lactose consumption, lactic acid production and consumption and VFAs production.
The experiment was done in quadruplicate, using the CWP culture media – Experiment 1.
A preliminary experiment, also using freely suspended cells, was done to study the influence of
the carbon source quantity on the VFAs composition profile. This experiment was done in
quadruplicate, using 30 g/L of CWP - Experiment 5.
For both experiments it was performed two sequential batches. At the end of the first batch, all
liquid was centrifuged 10 min at 7,500 rpms and pellet suspension in 55 mL of new CWP solution,
with the respective concentration of each experiment. (20 or 30 g/L). The plateau of organic acids
production determined the end of batch.
3.2.1.2 Batch trials at microcosm scale: immobilization supports study
The next experiments were prepared in order to determine the parameters for the set up of the
PBBRs. The microcosm were prepared and treated in the same way as in 3.2.1, but utilizing a support
to obtain immobilization. In order to be able to perform a comparison between the different supports,
the packed and working volume were fixed. The packing volume, that corresponds to the bottle
volume occupied by immobilization materials, was set by marking an horizontal line over the glass,
corresponding to 45 mL of water, previously added. Then, the bottles were filled up, with water, to 55
mL level, which represents the working volume. This volume will comprise the liquid volume, CWP
solution and inoculum, and the immobilization material volume. Then, empty and dried bottles were
filled with each support, Vukopor S10 and Granular Activated Carbon, till completing the packing
volume. Support accommodation and packing was obtained by giving smalls hits to the bottle. Since
both supports have different specific volumes and the working volume was fixed, the liquid amount-
comprising the CWP and inoculum necessary to add is different for Vukopor and AC. To determine
that, water was added until reaching the 55 mL line. The quantity of added water in each bottle
corresponds to the total liquid volume, comprising the inoculum and CWP solution, necessary to add
to each bottle. This step was performed with the supports already wet in order to avoid the absorption
phenomenon since it was previously observed that AC had a strong absorbent capacity and because
during sequential batches the supports will be already wet in the beginning of each.
After setting up of all experimental volumes, cultures were started with the corresponding
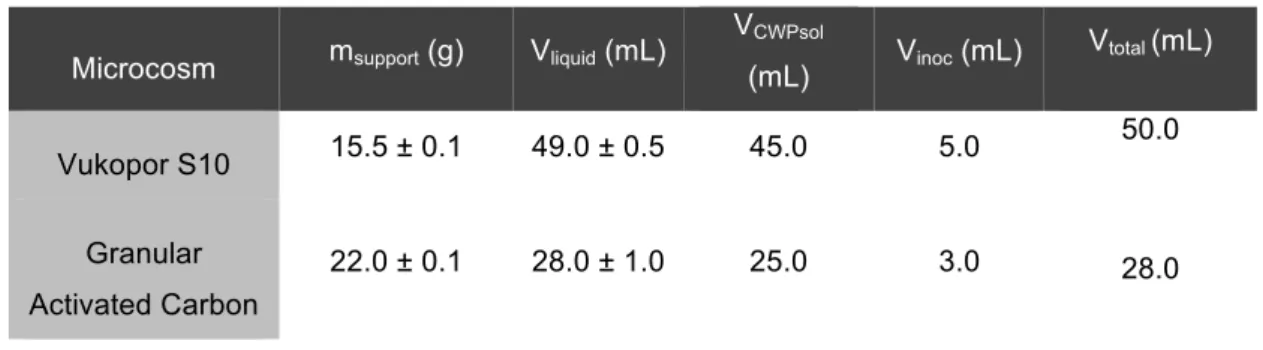
Table 3.2. Volumes determined for microcosm preparation as the final volumes added.
3.2.1.2.1 Experiment 2 - Preliminary immobilization supports study
The aim was to study the bioconversion process when employing the immobilization supports.
Being a preliminary activity, it was carried out just in double, for AC and Vukopor. Microcosm set-up
parameters are presented in Table 3.2. The experiment was carried out for 98 days under the
incubation conditions described in 3.2.1. In total eight consecutive batch were performed, six for
biofilm formation - the first, second, fourth, fifth, sixth and seventh – and two for VFAs accumulation -
third and eighth.
At the end of each batch, all liquid phase was took out and replaced with new CWP solution (20
g/L), leaving the supports inside the bottles. The total consumption of lactose was the parameter that
determined the end of “biofilm formation batch”, while the end of VFAs production was determined
when all organic acids concentration arrive to their plateau.
3.2.1.2.2 Experiment 3 - Improved immobilization supports study
With some gained knowledge from the preliminary test and in order to confirm those previous
results, this test was carried out with four bottles for each support – AC and Vukopor. The preparation
was as described in 3.2.1.2 with one added step: the bottles with the supports inside were autoclaved
at 120ºC during 20 minutes before inoculation. This was because of the reutilization of support
material that arrived from another process. Each bottle had the characteristics as described in Table
2.3. Along the 38 days of experiment, three sequential batches were performed for biofilm formation
and the fourth batch was dedicated to VFAs production study. Microcosm msupport (g) Vliquid (mL)
VCWPsol
(mL) Vinoc (mL)
Vtotal (mL)
Vukopor S10 15.5 ± 0.1 49.0 ± 0.5 45.0 5.0
50.0
Granular
Activated Carbon
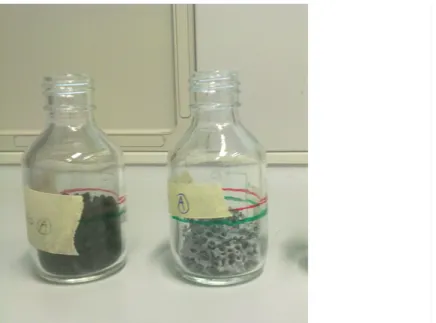
Figure 3.2. Microcosms preparation. In this step it was already determine the packing volume line (green), which
corresponds to 45 mL of water, and working volume line (red) which corresponds to 55 mL.
3.2.1.3 Experiment 4 - Batch production for consortia characterization
With the aim of characterizing the inoculum and the consortium which forms the biofilm and
responsible for single metabolic activities, this experiment is a replica from previous experiment but
only performed with ceramic material. In order to have enough liquid volume and support material for
molecular analyses sampling, this experiment was carried, in double, in 1L-Pyrex bottles filled with
Vukopor S10. Although the total volume of the bottles was different, the ratio between the packed and
working volume were the same as in the previous immobilisation experiments, which results in 400
mL and 500 mL, respectively. The preparation was the same as described in 3.2.1.2, with the
adjusted volumes.
In addition to the 1 mL sample, for analyse of VFAs, lactose and lactic acid, supports and liquid
were taken out for molecular analyses. For the supports, 8 Vukopor cubes were removed from the
bottle with a long clamp and placed in falcons of 50 mL, where were cleaned, very carefully, with
physiologic solution NaCl 8 g/L. The cleaning step is important since the cells that form the biofilm will
stay attached to the supports. For liquid, 5 mL were mixed with 5 mL of ethanol 98%. This sampling
Table 3.3. Volumes determined for 1 L Pyrex bottles preparation and final volumes of CWP solution and incolum added.
3.2.2 Continuous process
A freely suspended cells bioreactor and two identically configured anaerobic packed-bed biofilm
reactors (PBBRs) were developed, similar to the bioreactor developed by [Bertin et al., 2010]. All of
them were started in batch and then, when VFAs concentrations arrived to the plateau, changed to
continuous operation. Each bioreactor consists of 1L-hermetically closed glass column (5 cm of
diameter and 40 cm high) wrapped with a silicon tubing serpentine continuously recycling
thermostated water, maintaining 37 ± 2ºC inside of the bioreactors, and equipped with a down flow
recycle line. The liquid and the gas effluent were collected in a bottle, hydraulically connected to a 2.5
L “Marriotte” bottle through which the produced biogas volume was determined, as described in 3.3.2.
All bioreactors had a working volume of 830 mL and were inoculated with 20% of liquid volume of
CWP solution.
Before the inoculation and CWP solution addition, all volumes were determinate as it was
performed for microcosm experiments (described in 3.2.1.2) but this time with the reactors. Also in
this case all supports were autoclaved.
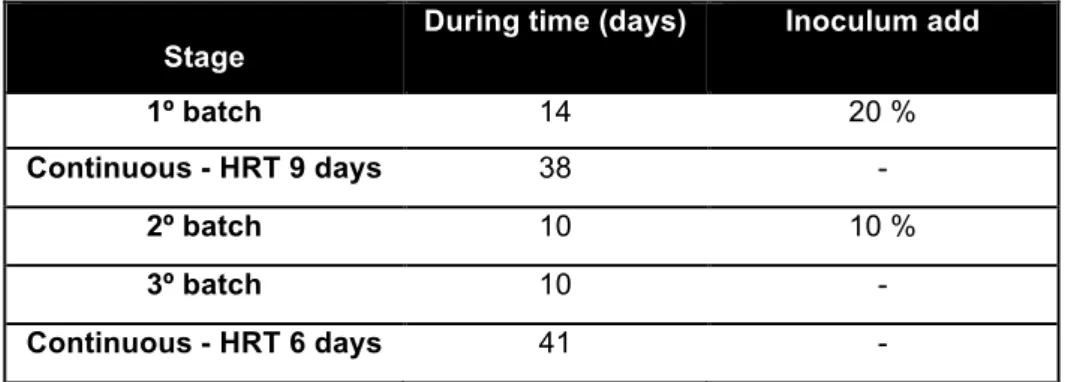
The PBBR with Vukopor (PBBR-Vuko) was operated in three batches and two continuous mode
experiments: one with HRT of 9 days and other with HRT of 6 days. It was packed with 120.36 g of
support and filled with 790 mL of liquid. After 14 days of initial batch operation, a continuous process
was started with a HRT of 9 days for 38 days. Then, another two sequential batches were performed,
each one with the durance of 10 days. In the first, in addition to the solution of CWP, 10% of the liquid
corresponded to inoculum. In the second only solution of CWP was added. Once this latter batch
ended, the continuous state was started again but with a HRT of 6 days having a durance of 41 days.
The recycle was maintained at 44 mL/min all along the 113 days, during which the PBBR-Vuko
was working. Besides the change in the HRT the PBBR-Vuko was always operated in a CSTR
equivalent.
nº Vukopor S10 msupp (g) VCWP (mL) Vinoculum (mL)
Table 3.4. Stages in which PBBR-Vuko was operated with respective time as also the inoculation.
The PBBR with Granular Activated Carbon (PBBR-AC) was operated in one single batch, for 15
days, and one continuous experiment with a HRT of 9 days, along 33 days. The bioreactor was filled
with 366.336 g of Granular Activated Carbon and 500 mL of total liquid, comprised CWP solution and
inoculum.
The freely suspended cells bioreactor, without any support was operated in batch for 16 days and
then in continuous state with HRT of 6 days.
Figure 3.3. Pictures of the three bioreactors. a) PBBR-AC. b) The bioreactor on the left is PBBR-Vuko while on the right is the freely suspended cells bioreactor.
Stage
During time (days) Inoculum add
1º batch 14 20 %
Continuous - HRT 9 days 38 -
2º batch 10 10 %
3º batch 10 -
Continuous - HRT 6 days 41 -
3.3 Analytical Methods
3.3.1 Liquid analysis
The VFAs concentrations were determined by gas chromatography using a GC (Agilent
Technologies, Milano, Italy), which is coupled to a Flame Ionization Detector (GC-FID model 7890A)
and equipped with a HP-INNOWAX column (length 30 m, diameter 0.250 mm film 0.25 µm) [Bertin et
al., 2010]. Injection volume was 1 µl with injector temperature at 250°C; column head pressure 5 psi.
The column was initially at 40 °C; 1 min isotherm; temperature rate 25°C/min; final temperature
150°C; 6 min isotherm; temperature rate 4°C/min; final temperature 180°C; temperature rate
25°C/min; final temperature 240°C; detector temperature 280°C). Nitrogen was the gas carrier with a
flow rate of 17.6 mL/min. The samples were centrifuged at 14,000 RPM for 10 minutes; supernatant
was diluted 2-4 times with oxalic acid solution 60 mM. The acidified mix contains all VFAs in their
protonated form therefore these lasts are able to be separated by GC; finally samples were filtered
(0.45 µm membrane).
The lactose and lactic acid concentrations were determined by HPLC using IR as detector and a
Varian Hi-Plex H 300 x 7.7 mm column. 0.01 N sulfuric acid was used as eluent, with an elution rate of
0.6 mL/min and a 65°C operating temperature. The samples were centrifuged at 14,000 RPM for 10
minutes and filtered (0.45 µm membrane).
COD was determined using a Kit Aqua Lytic 420721. Calibration was done with glucose.
Total proteins was determinate - either for the liquid as for the liquid-solid mix - using the modified
Lowry method [Lowry et al., 1951; Hartree et al., 1972]. Albumin serum albumin was used as
standard. To determine the proteins in the liquid the samples were centrifuged at 14,000 rpm during
10 min. To determine of total proteins in the liquid-solid mix the samples were vortex. The fowling
procedure is equal for both liquid and mix. 40 µL of sample were added to 960 µL water and 900 µL
of Lowry solution (Appendix Solutions for total protein determination) and incubated 10 min at 50ºC.
After that time 100 µL of Solution B (Appendix – Solutions for total protein determination) was add
and left 10 min at ambient temperature. 3 mL of Follin solution were added leaving. During 10 min the
preparation was left at 50ºC. In a 2 mL cuvvet the absorbance was read using a spectrophotometer
(Cary 100 Scan UV-Visible, Varian) at 750 nm.
3.3.2 Biogas analysis
The biogas production was determined, either for microcosms experiments and bioreactors as
described by [Bertin et al., 2004; Scoma et al., 2011].
The total gas production determination procedures were different for microcosm and bioreactors.
In microcosms biogas volume was measured using a graduated glass syringe of 10, 50 or 100 mL,
according with the estimated produced volume. When the biogas is produced, the bottle is in
overpressure, when the syringe is inserted, the biogas produced enters inside the syringe until the
of the total headspace and the biogas measured with the syringe. For the bioreactors a “Mariotte”
system was employed. The head of the bioreactor is connected to a 1 L Pyrex bottle where is
collected the outlet. This bottle is the connection between the top of the bioreactor and the “Mariotte”.
This system is composed by a bottle of 2.5 L filled with a known quantity of water. Its headspace is
connected to the headspace of 1 L bottle by tube. It has also a tube immerse in the liquid phase that is
connected to a graduated cylinder partially filled with water. When biogas is produced it will enter to
the outlet bottle flowing to 2.5 L bottle headspace due to the increased pressure. This pressure
impulses the water inside of the 2.5 L bottle into the cylinder. In this last the water will increase its level
being possible read the volume level. The volume of biogas produced in the bioreactor is equal to the
water volume transferred to the graduated cylinder, discounting the liquid collected in outlet bottle.
After each bioreactor sampling, the system is leaving in equilibrium where the volumes of eater are ate
the same level with known values.
Biogas composition in terms of H2, O2, CH4 and CO2, was measured by gas-chromatography
using a µGC, model 3000 A (Agilent Technologies, Milano, Italy) under the following conditions:
injector temperature 90°C; column temperature 60°C; sampling time 20 s; injection time 50 ms;
column pressure 25 psi; run time is 44 s. and the carrier gas is nitrogen.
Since the microcosms are bottles which can be transported and had a silicone tap, it is possible to
measure directly the composition by connecting the µGC to the bottle. This is done by inserting a
needle until reach the headspace where 3 mL of gas sample are collected. In the case of the
bioreactors, it is not possible to transport them for analysis. Therefore, using a syringe a gas sample of
3 mL was taken from each headspace of the system- three in total- and inserted in different vials of 11
mL. Each vial was cleaned before sampling, procedure to guarantee not having any other gas
influence. The vials, closed with a rubber tap, were empty with a vacuum pump and filled with 11 mL
of nitrogen using a syringe. After the cleaning and the gas collection, the composition was determined
with the µGC.
Figure 3.4. Scheme in which is represent a PBBR (A) connected to the outlet 1 L Pyrex bottle (B) which is connected to the “Mariotte” system (group of C and D).
A B
3.3.3 Microbiological features of Vukopor-attached-cells analysis
The DNA isolation from the Vukopor-attached-cells of the microbial community was carried out
by using a fixed number of carrier units for each kind of sample. Carrier units were first subjected to
enzymatic cell lysis steps, with Lysozyme 160 µg/mL and Proteinase K 100 µg/mL, submerged in 5
mL of Tris–EDTAGlucose pH 8.0 solution for 30 min at 37°C, 120 rpm. Then, 1 mL of SDS 10% (w/v)
and 4.5 g of sterilized quartz beads (0.5-1.0 mm diameter) were added, and tubes were secured
horizontally on a vortex and mixed at maximum speed for 10 min. After centrifugation for 10 min at
8,000 rpm and recovery of the supernatant, proteins were precipitated with 3 mL of NaCl 5 M and
DNA in supernatant was ethanol precipitated over night at -20°C. DNA was then resuspended in 0.7
mL of sterile deionized water and further purified on spin filter columns provided by the NucleoSpin®
Soil (MACHEREY-NAGEL, Germany) kit for Genomic DNA from soil, according to the manufacturer’s
protocol.
DNA quality was checked on 1.0% (w/v) agarose gel stained with Ethidium bromide 0.5 µg/ml.
For Bacterial DGGE analysis, PCR amplification of one region of the genes coding for the 16S
rRNA was performed with primers
GC-357f(5’-CGCCCGCCGCGCCCCGCGCCCGGCCCGCCGCCCCCGCCCCCTACGGGAGGCA
GCAG-3’) and 907r (5’-CCGTCAATTCCTTTGAGTTT-3’) in 50 µL reaction mixtures containing 1×
PCR buffer (Invitrogen, Paisley, UK), 1.5 mM MgCl2, 0.2 mM each dNTP, 0.4 mM each primer, 1.0 U
of Taq polymerase (Invitrogen, Paisley, UK) and 2 µL of template DNA. The reaction began with an
initial 95°C denaturation for 5 min, followed by 30 cycles of 95°C for 30 s, 55°C for 30 s, 72°C for 45
min and a final extension at 72°C for 7 min.
PCR products were resolved with a D-Code apparatus (Bio-Rad, Milan, Italy) on a 7% (w/v)
polyacrylamide gel (acrylamide-N,N_-methylenebisacrylamide, 37:1) in 1 × TAE with a denaturing
gradient from 40% to 60% denaturant, where 100% denaturant is 7 mol/L urea and 40% (v/v)
formamide. The electrophoresis was run at 55 V for 16h at 60°C. The gel was stained in a solution of 1
× SYBR-Green (Sigma Aldrich, Milwaukee, WI) in 1 × TAE for 30 min and its image captured in UV
transillumination with a digital camera supported by a Gel Doc apparatus (Bio-Rad, Milan, Italy).
Bands with the highest intensities, together with those characteristic of a specific DGGE profile, were
cut from the gel with a sterile scalpel and DNA was eluted in 50 µL of sterile deionized water at 4°C for
16 h. 4 µL of the solution were then used as template to re-amplify the band fragments using the same
4.1 Batch trials at microcosm scale
Four experiments at microcosm scale were carried out in order to perform a first production study
and therefore be able to define the process parameters for the production of VFAs at bioreactor scale.
4.1.1 Freely suspended cells study
Freely suspended cells systems were studied in order to gain the knowledge about the
bioconversion trends, useful as “control experiment”. Two sequential batch experiments were
performed. Both batches were carried out till achieving the VFAs concentrations plateau, allowing
observing all expected bioconversions: (a) lactose to lactic acid, (b) and lactic acid to VFAs.
With respect to the first batch, results are shown in Figure 4.1 a). The conversion of lactose in
lactic acid occurred in 7 days, with a yield (C-mol lactic acid/C-mol lactose) of 90%. It was also
observed that until that day no biogas was produced. Biogas production started simultaneously with
VFAs production. As soon as the lactic acid was completely consumed and VFAs started to achieve a
constant concentration, also the biogas production decreased. At day 16, lactic acid was finished and
a VFAs yield (C-mol/C-mol) of 81% was achieved, corresponding to a 9.0 ± 0.1 g/L. Biogas was
composed by CO2 and H2 (Figure 4.1 b)) and achieved the maximum of 513 ± 94 mL/L of CO2 and
539 ± 115 mL/L of H2 at days 12 and 14, respectively.
The second batch experiment was performed to see if process rates could be improved by
biomass accumulation and/or acclimation. This time butyric and acetic acids started to be produced
during lactose consumption, this leading to a lower lactic acid maximum concentration and therefore
yield (C-mol/C-mol) 62%. It was obtained 10.2 ± 0.2 g/L of total VFAs. The VFAs mixture was mainly
composed by (in g/L): acetic (2.5 ± 0.2), propionic (2.3) and butyric (4.2 ± 0.2) acids with a yield of
82% (Table 4.3). With respect to biogas production, it was observed a peak of CO2 (749 ± 208 mL/L),
followed by a H2 production (496 ± 71 mL/L) in the second days of batch, No CH4 was detected during
Figure 4.1. Concentration profiles of main monitored compounds during microcosm experiment with freely suspended cells a) Concentration of lactic acid and VFAs dissolved in liquid phase as a function of time. b) Biogas concentration as a function of time.
4.1.2 Immobilization supports study
Two different supports were tested at microcosm scale for the production of VFAs with
immobilization, namely: Vukopor S10 and Granular Activated Carbon. The packed and working
volumes were the same for both in order to be able to compare results between the immobilizing
materials. 0 2 4 6 8 10 12 14 16 18
0 2 4 6 8 10 12 14 16 18 20 22 24 26 28 30 32 34 36 38 40
L a c to s e , la c ti c a c id a n d VF A s (g /L ) Time (d)
Lactose Lactic acid Acetic acid Propionic acid Butyric acid
0 200 400 600 800 1000
0 2 4 6 8 10 12 14 16 18 20 22 24 26 28 30 32 34 36 38 40
![Figure 1.4. An example scheme of wastes valorization. Intermediates are generated, i.e.: with an anaerobic acidogenic digestion, and consumed/separated in a second stage for fine chemicals production [Li et al., 2011]](https://thumb-eu.123doks.com/thumbv2/123dok_br/16671938.742753/24.892.216.721.699.991/valorization-intermediates-generated-anaerobic-acidogenic-digestion-separated-production.webp)
![Figure 1.5.Scheme representing the different possible pathways during anaerobic digestion [Salminen et al., 2002].](https://thumb-eu.123doks.com/thumbv2/123dok_br/16671938.742753/26.892.132.739.823.1088/figure-representing-different-possible-pathways-anaerobic-digestion-salminen.webp)